Am I right to conclude that my internet provider might be to blame?
Hard to say; *IF* pathping would have worked correctly for that path to the server,
we could have said precisely which node was causing the problem - - I'll show you what happens
from my location:
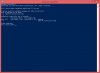
Here's the tracert
tracert dub125.mail.live.com
Code:
Tracing route to a-0009.a-msedge.net [204.79.197.211]
over a maximum of 30 hops:

  1  <1 ms  <1 ms  <1 ms  localrouter [192.168.0.1]
  2  11 ms  8 ms  8 ms  cpe-zz-zz-zz.socal.res.rr.com [zz-zz-zz]
  3  8 ms  8 ms  8 ms  tge0-9-0-23.wlvgcabn02h.socal.rr.com [24.30.172.141]
  4  28 ms  15 ms  15 ms  agg22.vnnycajz02r.socal.rr.com [72.129.14.168]
  5  16 ms  14 ms  15 ms  agg29.tustcaft01r.socal.rr.com [72.129.13.2]
  6  16 ms  14 ms  15 ms  bu-ether16.tustca4200w-bcr00.tbone.rr.com [66.109.6.64]
  7  23 ms  14 ms  15 ms  bu-ether14.lsancarc0yw-bcr00.tbone.rr.com [66.109.6.4]
  8  12 ms  12 ms  14 ms  0.ae1.pr1.lax00.tbone.rr.com [107.14.17.250]
  9  14 ms  15 ms  15 ms  66.109.7.134
10  14 ms  14 ms  15 ms  191.234.230.159
11  13 ms  12 ms  12 ms  10.64.132.12
12  *  *  *  Request timed out.
13  *  *  *  Request timed out.
14  *  *  *  Request timed out.
15  14 ms  11 ms  12 ms  a-0009.a-msedge.net [204.79.197.211]
SO tracert just continues on, has reported 1-11 nodes in the path,
can't see nodes 12,13,14, and arrives at the destination:
dub125.mail.live.com is ip address 204.79.197.211
(actually, dub125.mail.live.com is an alias for a-0009.a-msedge.net)
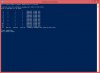
and here's the pathping
(recall, the timeout accessing the 12th line preferts the expected test"
pathping dub125.mail.live.com
Code:
Tracing route to a-0009.a-msedge.net [204.79.197.211]
over a maximum of 30 hops:
  0  jeffpc7 [zz-zz-zz]
  1  localrouter [192.168.0.1]
  2  cpe-75-85-0-1.socal.res.rr.com [zz-zz-zz]
  3  tge0-9-0-23.wlvgcabn02h.socal.rr.com [24.30.172.141]
  4  agg22.vnnycajz02r.socal.rr.com [72.129.14.168]
  5  agg29.tustcaft01r.socal.rr.com [72.129.13.2]
  6  bu-ether16.tustca4200w-bcr00.tbone.rr.com [66.109.6.64]
  7  bu-ether14.lsancarc0yw-bcr00.tbone.rr.com [66.109.6.4]
  8  0.ae1.pr1.lax00.tbone.rr.com [107.14.17.250]
  9  66.109.7.134
10  191.234.230.159
11  10.64.132.12
12  *  *  *
Computing statistics for 275 seconds...
  Source to Here  This Node/Link
Hop  RTT  Lost/Sent = Pct  Lost/Sent = Pct  Address
  0                                jeffpc7 [zz-zz-zz]
                       0/100 =  0%  |
  1  0ms  0/100 =  0%  0/100 =  0%  localrouter [192.168.0.1]
                       0/100 =  0%  |
  2  9ms  0/100 =  0%  0/100 =  0%  cpe-75-85-0-1.socal.res.rr.com [zz-zz-zz]
                       0/100 =  0%  |
  3  9ms  0/100 =  0%  0/100 =  0%  tge0-9-0-23.wlvgcabn02h.socal.rr.com [24.30.172.141]
                       0/100 =  0%  |
  4  11ms  0/100 =  0%  0/100 =  0%  agg22.vnnycajz02r.socal.rr.com [72.129.14.168]
                        0/100 =  0%  |
  5  14ms  0/100 =  0%  0/100 =  0%  agg29.tustcaft01r.socal.rr.com [72.129.13.2]
                        0/100 =  0%  |
  6  15ms  0/100 =  0%  0/100 =  0%  bu-ether16.tustca4200w-bcr00.tbone.rr.com [66.109.6.64]
                        0/100 =  0%  |
  7  17ms  0/100 =  0%  0/100 =  0%  bu-ether14.lsancarc0yw-bcr00.tbone.rr.com [66.109.6.4]
                        0/100 =  0%  |
  8  16ms  0/100 =  0%  0/100 =  0%  0.ae1.pr1.lax00.tbone.rr.com [107.14.17.250]
                        0/100 =  0%  |
  9  14ms  0/100 =  0%  0/100 =  0%  66.109.7.134
                        0/100 =  0%  |
 10  13ms  0/100 =  0%  0/100 =  0%  191.234.230.159
                      100/100 =100%  |
 11  ---  100/ 100 =100%  0/ 100 =  0%  10.64.132.12

Trace complete.
*IF* any 0/100 had been any other value (like 20/100), then the line containing it would identify
the node that had a problem. Notice also for example between #8 and #9 we see 0/100 = 0% and nothing else.
That represents the wire connection between the two nodes - - and a node can be perfect,while the wire
between them can have problems.