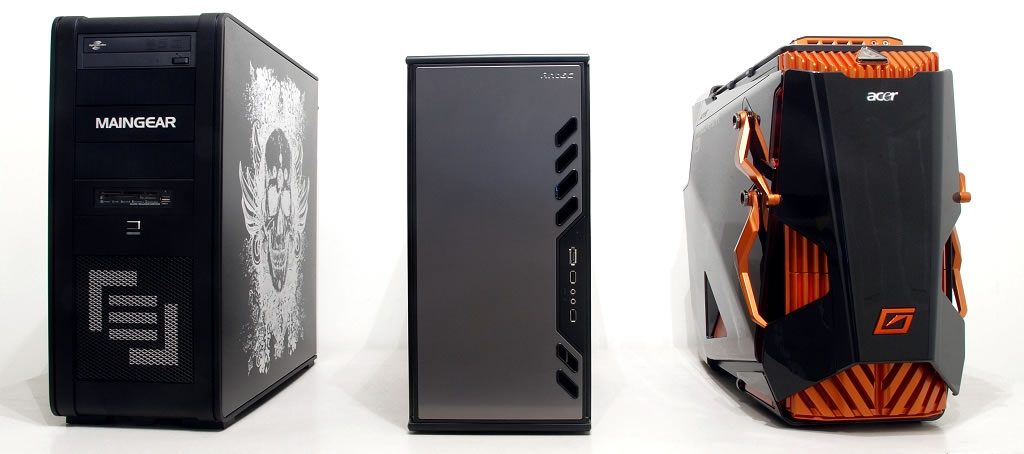
Specs and Benchmarks
After installing the latest Windows updates, we put every system through its paces with several benchmark tests to give you an idea of how its processor, graphics card, hard drive and memory system perform under load. Many of the components found on these systems have been reviewed by us before. If you are looking for a straight performance comparison between processors or high-end graphics cards we suggest you check our standalone hardware reviews.
Puget Deluge Mini System Specs
Hardware:
- Intel Core i7 875K (2.93GHz, 8MB L3 cache)
- x2 2GB Kingston DDR3-1333 (4GB total)
- Asus P7P55-M motherboard
- Asus Radeon HD 5870 1GB V2
- 1TB SATA 6Gb/s hard drive (Western Digital Caviar Black 7200RPM)
- Corsair TX 650W power supply
- Pioneer 22X DVD-RW
Software:
- Microsoft Windows 7 Home Premium (64-bit)
Maingear F131 System Specs
Hardware:
- Intel Core i5 655K (4.5GHz overclock, 4MB L3 cache)
- x2 2GB Crucial DDR3-1333 (4GB total)
- Asus P7P55D-E Pro motherboard
- 2x Nvidia GeForce GTX 460 in SLI (1536MB GDDR5 Total)
- 1TB SATA 6Gb/s hard drive (Western Digital Caviar Black 7200RPM)
- SilverStone Strider Plus 750W modular power supply
- 24x dual layer DVD RW drive
Software:
- Microsoft Windows 7 Home Premium (64-bit)
Acer Predator
Hardware:
- Intel Core i7 930 (2.8GHz, 8MB L3 cache)
- x6 2GB Samsung DDR3-1333 (12GB total)
- Acer motherboard with Intel X58 Express chipset
- Nvidia GeForce GTX 470 with 1280MB of memory
- 1.5TB Western Digital 7200 RPM hard drive
- FSP Group 750W power supply
- 16x DVD RW optical drive
Software:
- Microsoft Windows 7 Home Premium (64-bit)
Benchmark Results
| Puget | Maingear | Acer | |
| 3DMark 06 (higher is better) | |||
| 3DMark Score | 19476 3DMarks | 23592 3DMarks | 19024 3DMarks |
| CPU Score | 5474 | 4763 | 5140 |
| 3DMark Vantage (higher is better) | |||
| 3DMark Score | P17776 | P26349 | P18003 |
| GPU Score | 17228 | 23502 | 14872 |
| CPU Score | 19649 | 41391 | 48871 |
| Super PI Mod 1.5 (lower is better) | |||
| 1M test | 0m 11.981 sec | 0m 9.516 sec | 0m 13.588 sec |
| 4M test | 1m 00.092 sec | 0m 52.509 sec | 1m 09.092 sec |
| Sandra processor arithmetic (higher is better) | |||
| Agregate arithmetic performance | 76.69 GOPS | 55.78 GOPS | 72.86 GOPS |
| Dhrystone iSSE4.2 | 92 GIPS | 64.73 GIPS | 84.22 GIPS |
| Whetstone iSSE3 | 61.34 GFLOPS | 46.84 GFLOPS | 61.5 GFLOPS |
| Sandra processor multimedia (higher is better) | |||
| Aggregate multimedia performance | 152 MPixel/s | 105.47 MPixel/s | 139.23 MPixel/s |
| Multimedia Integer x16 iSSE4.1 | 174.36 MPixel/s | 120.26 MPixel/s | 159.67 MPixel/s |
| Multimedia Float x8 iSSE2 | 129.75 MPixel/s | 90.68 MPixel/s | 118.79 MPixel/s |
| Multimedia Double x4 iSSE2 | 70.46 MPixel/s | 49.35 MPixel/s | 64.58 MPixel/s |
| Sandra memory bandwidth (higher is better) | |||
| Aggregate Memory Performance | 16.9 GB/s | 13.76 GB/s | 19 GB/s |
| Integer Buff'd iSSE2 Memory Bandwidth | 16.9 GB/s | 13.74 GB/s | 19 GB/s |
| Float Buff'd iSSE2 Memory Bandwidth | 16.9 GB/s | 13.78 GB/s | 19 GB/s |
| Sandra memory latency (lower is better) | |||
| Memory Latency | 76 ns | 103 ns | 82 ns |
| Speed Factor | 64.10 | 110.50 | 58.50 |
| Sandra file systems | |||
| Drive Score (higher is better) | 162 MB/s | 110.44 MB/s | 84 MB/s |
| Random Access Time (lower is better) | 2.86 ms | 6.54 ms | 9.1 ms |
Gaming Performance
| Puget | Maingear | Acer | |
| Mafia II (High graphics settings) | |||
| 1920 x 1080, 16x AA/AF | 55.1 fps | 64.0 fps | 47.3 fps |
| 1920 x 1080, no AA/1xAF | 80.8 fps | 84.1 fps | 73.0 fps |
| Crysis (Very high graphics settings) | |||
| 1920 x 1080, 16x AA | 35.3 fps | 38.5 fps | 22.9 fps |
| 1920 x 1080, no AA | 39 fps | 47.1 fps | 31.1 fps |
| Far Cry 2 (Highest graphics settings) | |||
| 1920 x 1080, 8x AA | 55 fps | 88.9 fps | 71.2 fps |
| 1920 x 1080, no AA | 90 fps | 97.6 fps | 96.9 fps |
