Google has launched the WebGL Globe, a new visual display for data around the world. The visualization was developed and designed by the Google Data Arts Team.
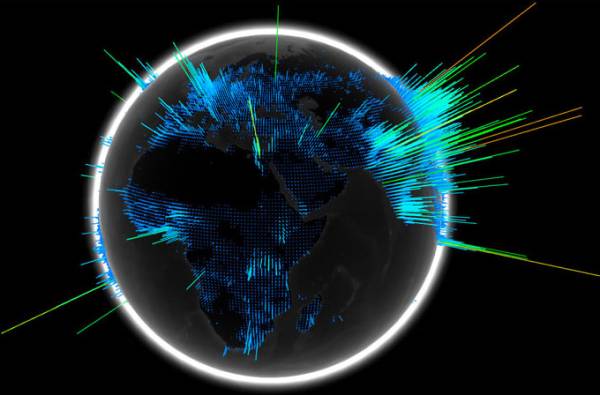
Google is currently showing off two globes: the Search Globe and the Population Globe. The former represents one day of Google searches around the world, organized by volume and language. The language of the majority of queries in an area is shown in different colors. You'll see a bright landscape of queries across North America, Europe, and parts of Asia for instance, but unfortunately significantly fewer searches from parts of the world lacking Internet access—and often electricity as well—like Africa.
The search giant has open sourced this platform so that developers can build their own globes using their own data. There are three main features the company is touting: latitude / longitude data spikes, color gradients based on data value or type, and mouse wheel to zoom. There are still more features under development, though what those actually are is unknown.
The project is powered by WebGL, a new Web technology for modern browsers that uses your computer's hardware to generate 3D graphics. In more technical terms, it's a 3D graphics API for JavaScript, based on the OpenGL ES 2.0 API, that developers can use to create fully 3D apps for the Web. As a result, you need a WebGL-enabled browser to see any of the globes. Google's own Chrome browser has supported WebGL as of version 9.
"We hope that as the Internet continues to become more accessible over time and people continue to ask questions, we’ll see this globe shine brightly everywhere," a Google spokesperson said in a statement.
https://www.techspot.com/news/43694-google-launches-the-webgl-globe.html