
The first 3D graphics cards appeared 25 years ago and since then their power and complexity have grown at a scale greater than any other microchip found in a PC. Back then, these processors packed around 1 million transistors, were smaller than 100 mm2 in size, and consumed just a handful of watts of electrical power.
Fast forward today, and a typical graphics card might have 14 billion transistors, in a die 500 mm2 in size, and consume over 200 W of power. The capabilities of these behemoths will be immeasurably greater than their ancient predecessors, but have they got any better at being efficient with all this tiny switches and energy?
A Tale of Two Numbers
In this article, we'll take a look at how well GPU designers have utilized the increase in die size and power consumption to give us ever more processing power. Before we dive in, you first might to brush up on the components of a graphics card or take a walk through the history of the modern graphics processor. With this information, you'll have a great foundation with which to follow this feature.
To understand how the efficiency of a GPU design has changed, if at all, over the years, we've used TechPowerUp's excellent database, taking a sample of processors from the last 14 years. We've picked this timeframe because it marks the start of when GPUs had a unified shader structure.
Rather than having separate circuits within the chip for handling triangles and pixels, unified shaders are arithmetic logic units that are designed to process all the math required to do any calculation involved in 3D graphics. This allows us to use a relative performance measurement, consistently across the different GPUs: floating point operations per second (FLOPS, for short).

Hardware vendors are often keen to state FLOPS figures as a measure of the peak processing capability of the GPU and while it's absolutely not the only aspect behind how fast a GPU is, FLOPS give us a number that we can work with.
The same is true of die size, which is a measure of the surface area of the processing chip. However, you could have two chips that are the same size, but have vastly differing transistor counts.
For example, Nvidia's G71 (think GeForce 7900 GT) processor from 2005 is 196 mm2 in size and contains 278 million transistors; their TU117 released early last year (GeForce GTX 1650), is just 4 mm2 larger but has 4.7 billion little switches.
A chart of Nvidia's main GPUs showing changes in transistor density over the years

Naturally, this must mean newer GPU transistors are much smaller than the older chip's, and this is very much the case. The so-called process node – the overall design scale of the manufacturing process used to fabrication the processor – used by hardware vendors has changed over the years, progressively getting smaller and smaller. So we'll analyze the efficiency from the perspective of die density, which is a measure of how many millions of transistors there are per mm2 of chip area.
Perhaps the most contentious metric we'll be using is the figure for the GPU's power consumption. We have no doubt that many readers will not like this, as we're using the vendor's stated thermal design power (TDP) value. This is actually a measure (or at least, it's supposed to be) of the amount of heat emitted by the whole graphics card in an average, but high load, situation.
With silicon chips, the power they consume gets mostly turned to heat, but this isn't the reason why using TDP is a problem. It's that different vendors state this number under different conditions, and it's also not necessarily the power consumption whilst producing peak FLOPS. It's also the power value for the whole graphics card, including the onboard memory, although most of it will be the GPU itself.
It is possible to directly measure the power consumption of a graphics card. For example, TechPowerUp does it for their GPU reviews, and when they tested a GeForce RTX 2080 Super, with a vendor-declared TDP of 250 W, they found it averaged at 243 W but peaked at 275 W, during their testing.
But we've stuck with using TDP for the sake of simplicity and we've been somewhat cautious in making any judgements solely based on the processing performance against thermal design power.
We're going to directly compare 2 metrics: GFLOPS and unit die density. One GFLOPS equates to 1,000 million floating point operations per second, and we're dealing with the value for FP32 calculations, done exclusively by the unified shaders. The comparison will take the form of a graph like this:

The x-axis plots GFLOPS per unit TDP, so you want this to be as high as possible: the lower the position along with axis, the less power efficient the chip is. The same is true for the y-axis as this plots GFLOPS per unit die density. The more transistors you have packed into a square mm, the more performance you would expect. So the overall GPU processing efficiency (accounting for the number of transistor, die size, and TDP) increases as you go towards the top-right hand corner of the graph.
Any data points near the top-left are basically saying "this GPU is getting good performance out of die design, but at a cost of using a relatively large amount of power." Going towards the bottom right and it's "good at using power effectively, but the die design isn't generating much performance."
In short, we're defining processing efficiency as how much does the GPU do for the package and power it's got.
GPU Efficiency: TDP vs. Unit Die Density
Without further ado, let's move on to the results:
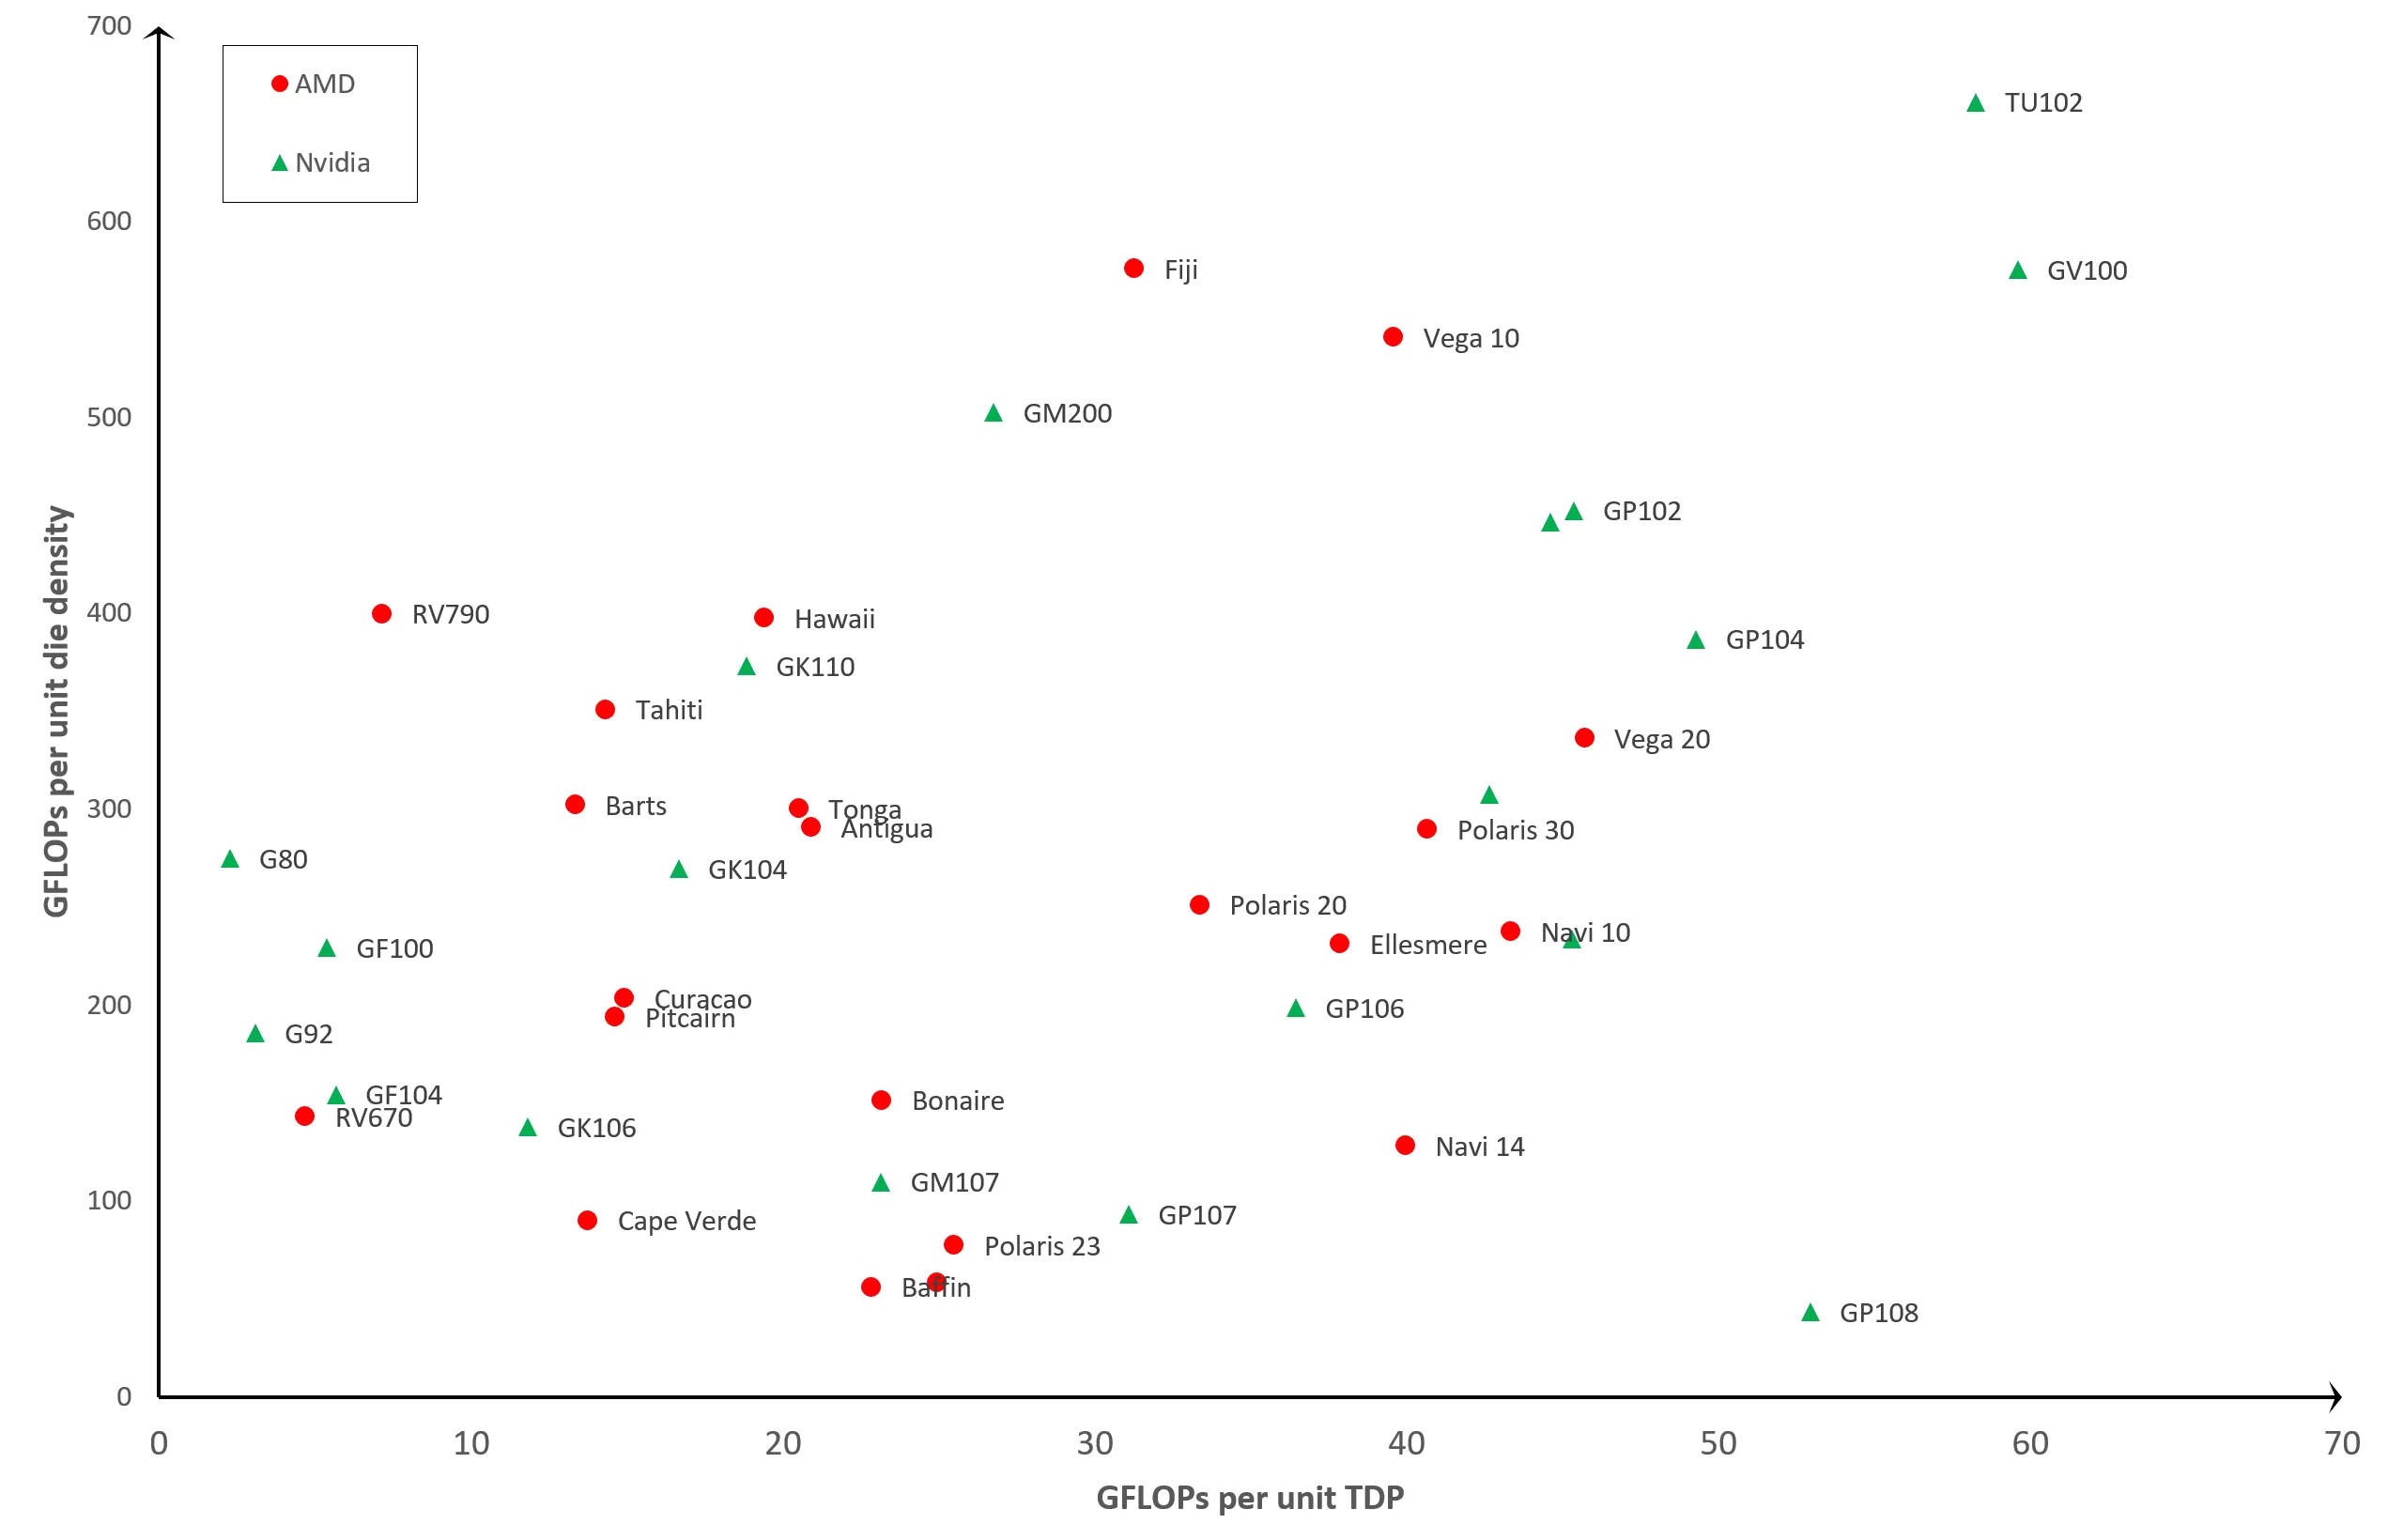
On face value, the results seem rather scattered about, but we can see a basic pattern: old GPUs, such as the G80 or RV670, are far less efficient compared to newer designs, such as the Vega 20 or the GP102. Which is what you would expect! After all, it would be a pretty poor team of electronic engineers who would go out of their way to constantly design and release new products that are less efficient with each release.
But there are some interesting data points. The first of which are the TU102 and GV100. Both of these are made by Nvidia and can be found in graphics such as the GeForce RTX 2080 Ti and Titan V, respectively.

You could argue that neither GPU was designed for the general consumer market, especially the GV100, as they're really for workstations or compute servers. So although they seem to be the most efficient of the lot, that's what you'd expect for processors designed for specialized markets, that cost vastly more than the standard ones.
Another GPU that sticks out, and somewhat like a sore thumb, is the GP108 – this is another one of Nvidia's chips and is mostly commonly found in the GeForce GT 1030. This low-end product, released in 2017, has a very small processor just 74 mm2 in size with a TDP of only 30 W. However, it's relative floating point performance is actually no better than Nvidia's first unified shader GPU, the G80, from 2006.

Across from the GP108 is AMD's Fuji chip that powered its Radeon R9 Fury series. This design doesn't seem to be overly power efficient, especially given that use of High Bandwidth Memory (HBM) was supposed to help in this respect. The Fiji design ran rather hot, which makes semiconductor processors less power efficient due to increased leakage. This is where electrical energy gets lost to the packaging and surroundings, rather than being constrained within the circuitry. All chips leak, but the rate of loss increases with temperature.
Perhaps the most interesting data point is Navi 10: this is AMD's most recent GPU design and is manufactured by TSMC, using their N7 process node, currently the smallest scale used. However, the Vega 20 chip is made on the same node, but it seems to be more efficient, despite being an older design. So, what's going on here?

The Vega 20 (AMD used it only the one consumer graphics card - the Radeon VII) was the last processor made by AMD to use their GCN (Graphics Core Next) architecture. It packs in a huge number of unified shader cores into a layout that focuses heavily on FP32 throughput. However, programming the device to achieve this performance was not easily done and it lacked flexibility.
Navi 10 uses their latest architecture, RDNA, which resolves this issue, but at a cost to FP32 throughput. However, it is a new layout and manufactured on a relatively fresh process node, so we can expect to see efficiency improvements as TSMC develops its process node and AMD updates the architecture.
If we ignore the outliers, the most efficient GPUs in our chart are the GP102 and GP104. These are using Nvidia's Pascal architecture, and can be found in graphics cards such as the GeForce GTX 1080 Ti, GTX 1070, and GTX 1060. The one next to the GP102, but not labelled for the sake of clarity, is the TU104 which uses Nvidia's latest Turing design, and can be found in a raft of GeForce RTX models: 2060, 2070 Super, 2080, 2080 Super, to name a few.

These are also made by TSMC but using a process node specifically designed for Nvidia's products, called 12FFN, which itself is a refined version of the 16FF node.
The improvements focus on increasing die density, while reducing leakage, which would go some way to explaining why Nvidia's GPUs are seemingly the most efficient.
GPU Efficiency: TDP vs. Unit Die Area
We can reduce the impact of process node from the analysis, by replacing the metric of die density with just die area. This gives us a very different picture...

Efficiency increases in the same direction in this graph, but now we can see that some key positions have swapped. The TU102 and GV100 have dropped right down, whereas the Navi 10 and Vega 20 have jumped up the graph. This is because the two former processors are enormous chips (754 mm2 and 815 mm2), whereas the latter two from AMD are much smaller (251 mm2 and 331 mm2).
If we focus the graph so it only displays the more recent GPUs, and the differences become even more pronounced:

This view strongly suggests that AMD have focused less on power efficiency compared to die size efficiency.
In other words, they've wanted to get more GPU chips per manufactured wafer. Nvidia, on the other hand, appear to have taken the approach where they're designing their chips to be larger and larger (and thus each wafer provides fewer dies), but they're utilizing electrical power better.
So will AMD and Nvidia continue this way with their next GPUs? Well, the former has already stated they're focusing improvement the performance-per-watt ratio in RDNA 2.0 by 50%, so we should see their future GPUs sit further to the right on our chart above. But what about Nvidia?
Unfortunately, they are notorious for keeping very tight lipped about future developments, but we do know that their next processors will be made by TSMC and Samsung on a similar process node to that used for Navi. There have been some claims that we will see a big power reduction, but also a big hike in unified shader count, so we perhaps will see a similar position on the chart for Nvidia.
So How Have GPUs Become More Efficient?
The above is pretty conclusive: over the years, AMD and Nvidia have raised the processing performance per unit die density and unit TDP. In some cases, the increase has been astonishing...
Take Nvidia's G92 and TU102 processors. The first one powered the likes of the GeForce 8800 GT and 9800 GTX, and packs 754 million transistors into a chip 324 mm2 in area. When it appeared in October 2007, it was well received for its performance and power requirements.
Eleven years later Nvidia offered us the TU102 in the form of the GeForce RTX 2080 Ti, with nearly 19 billion transistors in an area of 754 mm2 – that's 25 times more microscopic components in a surface that's only 2.3 times larger.
None of this would be possible if it wasn't for the work done by TSMC to constantly develop their fabrication technology: the G92 in the 8800 GT was built on a 65 nm process node, whereas the latest TU102 is their special 12FFN scale. The names of the production methods don't really tell us the sense of the difference between the two, but the GPU numbers do. The current one has a die density of 24.67 million transistors per mm2, compared to the old one's value of 2.33 million.
A ten-fold increase in the packing of components is the primary reason behind the huge difference in the two GPU's efficiency. Smaller logic units require less energy to operate and the shorter pathways connecting them means it takes less time for data to travel. Along with improvements in silicon chip manufacturing (reduction in defects and better insulation), this results in being able to run at higher clock speeds for the same power requirement or go with using less power for the same clock rate.

Speaking of clocks, this is another factor to consider. Let's compare the RV670, from November 2007 in the Radeon HD 3870, to the Vega 10 powering the Radeon RX Vega 64, released in August 2017.
The former has a fixed clock speed of around 775 MHz, whereas the latter has at least three available rates:
- 850 MHz - when just doing desktop, 2D processing
- 1250 MHz - for very heavy 3D work (known as the base clock)
- 1550 MHz - for light-to-medium 3D loads (known as the boost clock)
We say 'at least' because the graphics card can dynamically vary its clock speed and the power consumed, between the above values, based on its workload and operating temperature. This is something that we take for granted now, with the latest GPUs, but this level of control simply didn't exist 13 years ago. The capability doesn't impact our efficiency results though, as we've only looked at peak processing output (i.e. at the maximum clock speeds), but it does affect how the card performs for the general consumer.
But the most important reason for the constant increase in GPU processing efficiency over the years has been down to the changes in the use of the processor itself. In June 2008, the best supercomputers around the world were all powered by CPUs from AMD, IBM, and Intel; eleven years later and there is one more chip vendor in the mix: Nvidia.

Their GV100 and GP100 processors were designed almost exclusively for the compute market, they feature a raft of key architectural features to support this, and many of them are very CPU-like. For example, the internal memory of the chips (the cache) looks similar to the likes of a typical server CPU:
- Register file per SM = 256 kB
- L0 cache per SM = 12 kB instruction
- L1 cache per SM = 128 kB instruction / 128 kB data
- L2 cache per GPU = 6 MB
Compare this to Intel's Xeon E5-2692 v2, which has been used in plenty of compute servers:
- L1 cache per core = 32 kB instruction / 32 kB data
- L2 cache per core = 256 kB
- L3 cache per CPU = 30 MB
The logic units inside a modern GPU support a range of data formats; some have specialized units for integer, float, and matrix calculations, whereas others have complex structures that do them all. The units are connected to the cache and local memory with high speed, wide interconnects. These changes certainly help in processing 3D graphics, but it would be considered overkill for most games. But these GPUs were designed for a broader set of workloads than just images and there is name for this: general purpose GPU (GPGPU).
Machine learning and data mining are two fields that have benefited hugely from the development of GPGPUs and the supported software packages and APIs (e.g. Nvidia's CUDA, AMD's ROMc, OpenCL) as they involve lots of complex, massively-parallel calculations.
Large GPUs, packed with thousands of unified shader units, are perfect for such tasks, and both AMD and Nvidia (and now Intel is joining the fun) have invested billions of dollars into the R&D of chips that offer increasingly better compute performance.

At the moment, both companies design GPU architectures that can be employed into a variety of market sectors, and typically avoid making completely separate layouts for graphics and compute. This is because the bulk of the profit from making GPUs still comes selling 3D graphics cards, but whether it stays that way isn't certain. It is possible that as the demand for compute continues to rise, then AMD or Nvidia could dedicate more resources to improving the efficiency of chips for those markets, and less for rendering.
But whatever happens next, we know one thing is certain: the next round of multi-billion transistor, high power GPUs will continue to be just that little bit more efficient than their predecessors. And that's good news, no matter who's making it or what it's being used for.