red1776
Posts: 5,128 +200
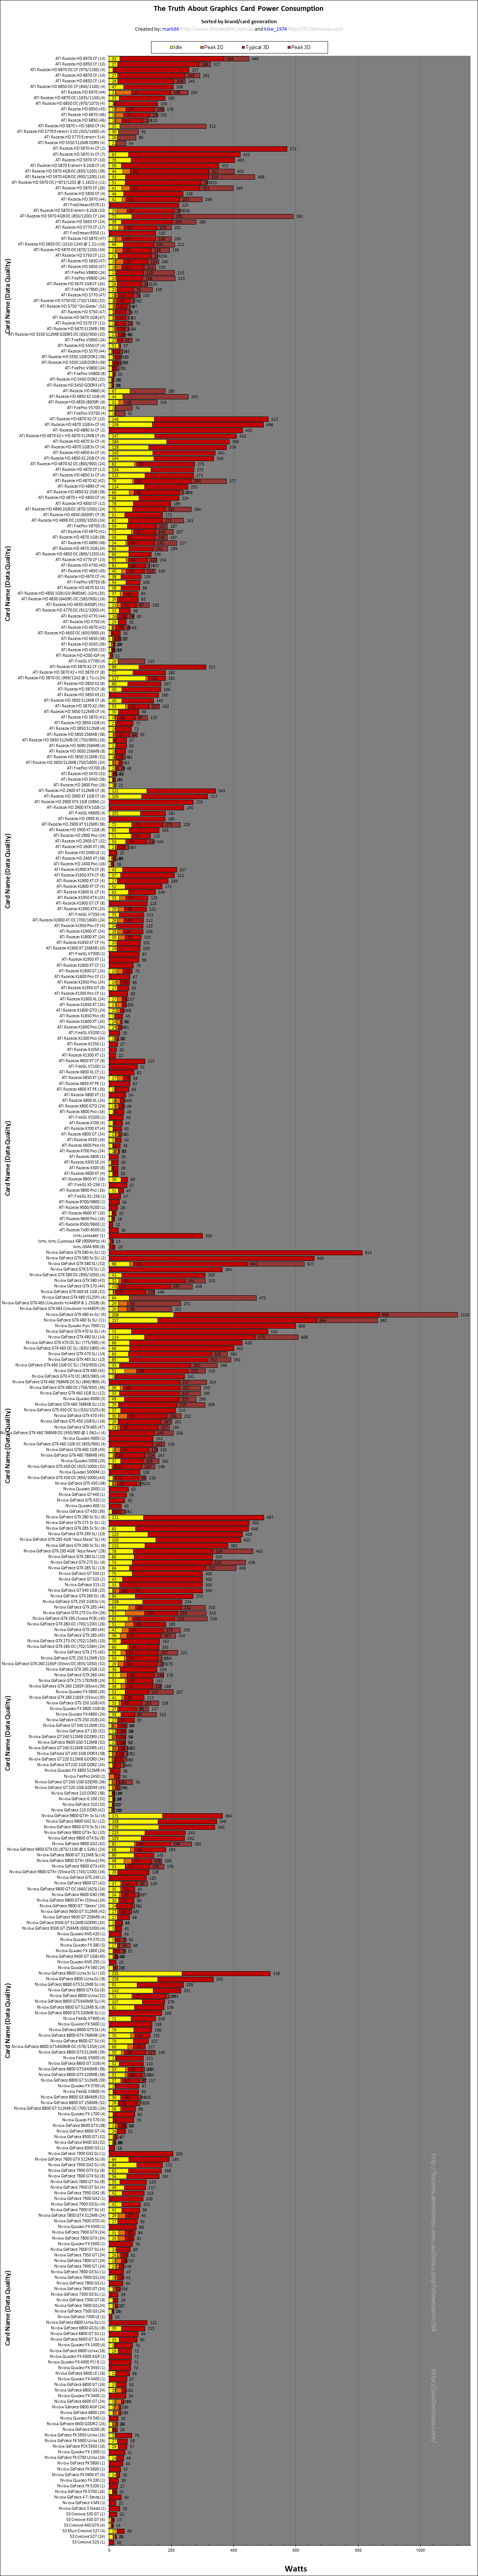
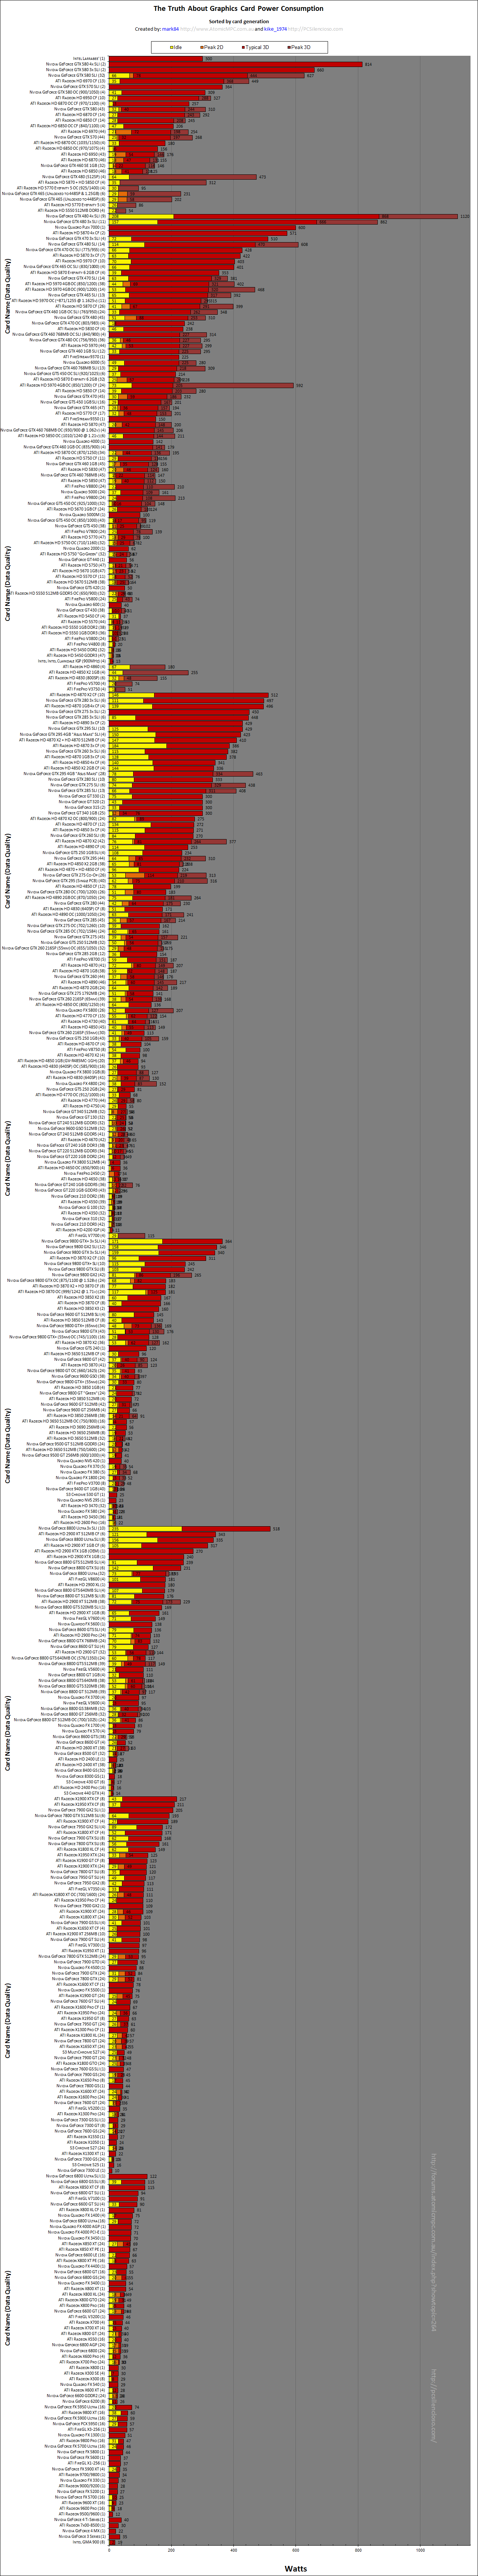
I found this over at Geeks3D.com. Handy if you are putting together a new system, or thinking off adding a second card.

Graphics Card Model TDP (Watts)
Quadro 6000 204 source
Quadro 5000 152 source
Quadro 4000 142 source
Quadro 2000 62 source
Quadro 600 40 source
Quadro FX 5800 189 source
Quadro FX 4800 150 source
Quadro FX 3800 108 source
Quadro FX 1800 59 source
Quadro FX 580 40 source
Quadro FX 380 34 source
Quadro FX 380 LP 28 source
Quadro 2000 62 source
Quadro 600 40 source
Quadro 400 32 source
GeForce GTX 590 365 (power limiter ON) source
ASUS ROG MATRIX GTX 580 Platinum 370 (peak 3D, OC) source
GeForce GTX 580 330 (peak 3D, OC) source
GeForce GTX 580 280 (peak 3D) source
GeForce GTX 580 244 (power limiter ON) source
GeForce GTX 570 240 (peak 3D, OC) source
GeForce GTX 570 217 (peak 3D) source
GeForce GTX 570 219 source
GeForce GTX 560 Ti 260 (peak 3D, OC) source
GeForce GTX 560 Ti 205 (peak 3D) source
GeForce GTX 560 Ti 170 source
GeForce GTX 560 190 (peak 3D, OC) source
GeForce GTX 560 150 source
GeForce GTX 550 Ti 116 source
GeForce GTX 480 260 (peak 3D) source: Geeks3D test
GeForce GTX 480 250 source
GeForce GTX 470 220 source
GeForce GTX 465 200 source
GeForce GTX 460 160 (1GB)
or 150 (768MB) source
GeForce GTX 460 SE 140 source
GeForce GTS 450 106 source
GeForce GT 440 (retail) 81 (peak 3D) source
GeForce GT 440 (retail) 65 source
GeForce GT 440 (OEM) 56 source
GeForce GT 430 49 source
GeForce GT 420 50 source
GeForce GT 340 69 source
GeForce GT 330 75 source
GeForce GT 320 43 source
GeForce 315 33 source
GeForce 310 30.5 source
GeForce GTX 295 289 source
GeForce GTS 285 204 source
GeForce GTX 280 236 source
GeForce GTX 275 219 source
GeForce GTX 260 182 source
GeForce GTS 250 150 source
GeForce GTS 240 120 source
GeForce GTS 150 141 source
GeForce GT 240 69 source
GeForce GT 230 65 source
GeForce GT 220 58 source
GeForce GT 130 75 source
GeForce GT 120 50 source
GeForce G 210 35 source
GeForce 210 30.5 source
GeForce 205 30.5 source
GeForce G100 35 source
GeForce 9800 GX2 197 source
GeForce 9800 GTX+ 141 source
GeForce 9800 GTX 140 source
GeForce 9800 GT 105 source
GeForce 9600 GSO 105 source
GeForce 9600 GT 96 or 52 source
GeForce 9500 GT 50 source
GeForce 9400 GT 50 source
GeForce 8800 Ultra 175 source
GeForce 8800 GTX 145 source
GeForce 8800 GTS 512 135 source
GeForce 8800 GT 105 source
GeForce 8800 GS 105 source
GeForce 8600 GTS 71 source
GeForce 8600 GT 43 source
GeForce 8600 GS 43 source
GeForce 8500 GT 40 source
GeForce 8400 GT 38 source
GeForce 7950 GX2 110 source
GeForce 7900 GTX 84 source
GeForce 7800 GTX 81 source
GeForce 7600 GT 35 source
GeForce 7300 GS 16

Graphics Card Model TDP (Watts)
FirePro V9800 225 source
Radeon HD 6990 375 (@ 830MHz)
or 450 (@ 880Mhz) source
Radeon HD 6970 256 (Peak 3D, OC) source
Radeon HD 6970 250 (PowerTune +20%) source
Radeon HD 6950 252 (Peak 3D, OC) source
Radeon HD 6950 200 (PowerTune +20%) source
Radeon HD 6870 200 (peak 3D, OC) source
Radeon HD 6870 151 source
Radeon HD 6850 127 source
Radeon HD 6790 150 source
Radeon HD 6670 72 (peak 3D) source
Radeon HD 6670 66 source
Radeon HD 6570 60 (GDDR5)
or 44 (DDR3) source
Radeon HD 5970 294 source
Radeon HD 5870 X2 376 source
Radeon HD 5870 188 source
Radeon HD 5850 151 source
Radeon HD 5830 175 source
Radeon HD 5770 108 source
Radeon HD 5750 86 source
Radeon HD 5670 61 source
Radeon HD 5650 60 source
Radeon HD 5570 42.7 source
Radeon HD 5550 40 source
Radeon HD 5450 19.1 source
Radeon HD 4890 190 source
Radeon HD 4870 X2 286 source
Radeon HD 4870 157 source
Radeon HD 4850 X2 230 source
Radeon HD 4850 114 source
Radeon HD 4830 110 source
Radeon HD 4770 80 source
Radeon HD 4670 70 source
Radeon HD 4650 55 source
Radeon HD 4550 25 source
Radeon HD 4350 20 source
Radeon HD 3870 X2 190 source
Radeon HD 3870 105 source
Radeon HD 3850 X2 140 source
Radeon HD 3850 75 source
Radeon HD 2900 XT 215 source
Radeon HD 2900 GT 150 source
Radeon HD 2600 XT 45 source
Radeon HD 2400 XT 25 source
Radeon X1900XTX 135 source
Radeon X1800XT 113 source
Radeon X1800XL 70
Graphics Card Model TDP (Watts)
Quadro 6000 204 source
Quadro 5000 152 source
Quadro 4000 142 source
Quadro 2000 62 source
Quadro 600 40 source
Quadro FX 5800 189 source
Quadro FX 4800 150 source
Quadro FX 3800 108 source
Quadro FX 1800 59 source
Quadro FX 580 40 source
Quadro FX 380 34 source
Quadro FX 380 LP 28 source
Quadro 2000 62 source
Quadro 600 40 source
Quadro 400 32 source
GeForce GTX 590 365 (power limiter ON) source
ASUS ROG MATRIX GTX 580 Platinum 370 (peak 3D, OC) source
GeForce GTX 580 330 (peak 3D, OC) source
GeForce GTX 580 280 (peak 3D) source
GeForce GTX 580 244 (power limiter ON) source
GeForce GTX 570 240 (peak 3D, OC) source
GeForce GTX 570 217 (peak 3D) source
GeForce GTX 570 219 source
GeForce GTX 560 Ti 260 (peak 3D, OC) source
GeForce GTX 560 Ti 205 (peak 3D) source
GeForce GTX 560 Ti 170 source
GeForce GTX 560 190 (peak 3D, OC) source
GeForce GTX 560 150 source
GeForce GTX 550 Ti 116 source
GeForce GTX 480 260 (peak 3D) source: Geeks3D test
GeForce GTX 480 250 source
GeForce GTX 470 220 source
GeForce GTX 465 200 source
GeForce GTX 460 160 (1GB)
or 150 (768MB) source
GeForce GTX 460 SE 140 source
GeForce GTS 450 106 source
GeForce GT 440 (retail) 81 (peak 3D) source
GeForce GT 440 (retail) 65 source
GeForce GT 440 (OEM) 56 source
GeForce GT 430 49 source
GeForce GT 420 50 source
GeForce GT 340 69 source
GeForce GT 330 75 source
GeForce GT 320 43 source
GeForce 315 33 source
GeForce 310 30.5 source
GeForce GTX 295 289 source
GeForce GTS 285 204 source
GeForce GTX 280 236 source
GeForce GTX 275 219 source
GeForce GTX 260 182 source
GeForce GTS 250 150 source
GeForce GTS 240 120 source
GeForce GTS 150 141 source
GeForce GT 240 69 source
GeForce GT 230 65 source
GeForce GT 220 58 source
GeForce GT 130 75 source
GeForce GT 120 50 source
GeForce G 210 35 source
GeForce 210 30.5 source
GeForce 205 30.5 source
GeForce G100 35 source
GeForce 9800 GX2 197 source
GeForce 9800 GTX+ 141 source
GeForce 9800 GTX 140 source
GeForce 9800 GT 105 source
GeForce 9600 GSO 105 source
GeForce 9600 GT 96 or 52 source
GeForce 9500 GT 50 source
GeForce 9400 GT 50 source
GeForce 8800 Ultra 175 source
GeForce 8800 GTX 145 source
GeForce 8800 GTS 512 135 source
GeForce 8800 GT 105 source
GeForce 8800 GS 105 source
GeForce 8600 GTS 71 source
GeForce 8600 GT 43 source
GeForce 8600 GS 43 source
GeForce 8500 GT 40 source
GeForce 8400 GT 38 source
GeForce 7950 GX2 110 source
GeForce 7900 GTX 84 source
GeForce 7800 GTX 81 source
GeForce 7600 GT 35 source
GeForce 7300 GS 16
Graphics Card Model TDP (Watts)
FirePro V9800 225 source
Radeon HD 6990 375 (@ 830MHz)
or 450 (@ 880Mhz) source
Radeon HD 6970 256 (Peak 3D, OC) source
Radeon HD 6970 250 (PowerTune +20%) source
Radeon HD 6950 252 (Peak 3D, OC) source
Radeon HD 6950 200 (PowerTune +20%) source
Radeon HD 6870 200 (peak 3D, OC) source
Radeon HD 6870 151 source
Radeon HD 6850 127 source
Radeon HD 6790 150 source
Radeon HD 6670 72 (peak 3D) source
Radeon HD 6670 66 source
Radeon HD 6570 60 (GDDR5)
or 44 (DDR3) source
Radeon HD 5970 294 source
Radeon HD 5870 X2 376 source
Radeon HD 5870 188 source
Radeon HD 5850 151 source
Radeon HD 5830 175 source
Radeon HD 5770 108 source
Radeon HD 5750 86 source
Radeon HD 5670 61 source
Radeon HD 5650 60 source
Radeon HD 5570 42.7 source
Radeon HD 5550 40 source
Radeon HD 5450 19.1 source
Radeon HD 4890 190 source
Radeon HD 4870 X2 286 source
Radeon HD 4870 157 source
Radeon HD 4850 X2 230 source
Radeon HD 4850 114 source
Radeon HD 4830 110 source
Radeon HD 4770 80 source
Radeon HD 4670 70 source
Radeon HD 4650 55 source
Radeon HD 4550 25 source
Radeon HD 4350 20 source
Radeon HD 3870 X2 190 source
Radeon HD 3870 105 source
Radeon HD 3850 X2 140 source
Radeon HD 3850 75 source
Radeon HD 2900 XT 215 source
Radeon HD 2900 GT 150 source
Radeon HD 2600 XT 45 source
Radeon HD 2400 XT 25 source
Radeon X1900XTX 135 source
Radeon X1800XT 113 source
Radeon X1800XL 70