
Time for a new benchmark series. CPU and GPU scaling tests have been high on the community's wishlist for a while now – and it's time to deliver. Several comparisons are already in the pipeline, including fan favorites like AMD's 5800X3D and Intel's discounted Core Ultra 7 265K, so expect those soon.
To kick things off and establish a baseline, we're starting with the Ryzen 7 9800X3D versus the ever-popular Ryzen 5 7600X. It's a clash between a gaming powerhouse and a budget-friendly performance workhorse – one that should offer valuable insight into where the X3D CPU delivers the biggest performance gains.

Choosing the 9800X3D as a baseline is straightforward, as it sets the benchmark for everything else. The 7600X, while less flashy, is a smart pick too. It mirrors the performance of the Ryzen 5 7500F, 7600, 9600, and 9600X – CPUs that have consistently punched above their weight in gaming. All of these CPUs perform similarly in gaming workloads.
We've kept the game count lean – just four titles – but for good reason. Each one has been tested across two quality presets (medium and ultra), three resolutions (1080p, 1440p, and 4K), and four GPUs. That's 48 unique data points per game, each based on a three-run average. This means a single game requires an enormous amount of testing and produces multiple graphs to analyze. So, a lot of numbers, a lot of graphs, and a lot of time.

On the GPU side, we've included four tiers: GeForce RTX 5090, RTX 5080, Radeon RX 9070, and 9060 XT 16GB. While we usually stick with Nvidia GPUs, given the popularity of the RX 9070 and the solid value behind the 9060 XT 16GB right now, it made sense to include them. Moreover, comparing the RTX 5080 and Radeon 9070 may offer some insight into whether driver overhead is still a concern.
Let's dive into the data…
Benchmarks
Rainbow Six Siege X
1080p - Medium
First, we are looking at performance in Rainbow Six Siege, a competitive shooter, using the medium quality preset with the render scale set to 100% at 1080p. With the RTX 5090, the 9800X3D is 30% faster at a whopping 575 fps. Of course, the 7600X is still very capable, delivering 446 fps, which will be more than enough for most gamers.
With the RTX 5080, performance for the 7600X remains almost unchanged. A few additional frames are rendered, but the difference is just 1%, which falls within the margin of error. The real change appears with the 9800X3D, where the average frame rate drops by 4% and the 1% lows drop by 17%.

Switching to the Radeon RX 9070 brings unexpected but explainable behavior. We have documented the Nvidia driver overhead issue with DirectX 12, and it still appears to affect the Blackwell architecture. In this case, performance using the 9800X3D drops by 10% compared to the RTX 5080.
However, when using the 7600X, performance is actually 10% higher with the RX 9070. The lower overhead of the Radeon GPU helps boost performance with this processor. In fact, the 7600X and RX 9070 combination delivers 12% better performance compared to the RTX 5090.
Once we drop down to the 9060 XT 16GB, the results become heavily GPU limited. Both CPUs are capped at just under 340 fps.
1440p - Medium

At 1440p, results shift noticeably. The RTX 5090 becomes less CPU limited, even with the 9800X3D. As a result, the X3D processor is now 33% faster than the 7600X. Switching to the RTX 5080 brings us to the GPU limit, with both CPUs reaching over 400 fps.
This resolution increase also pushes the RX 9070 down to 356 fps, creating a GPU-limited scenario similar to what we observed with the 9060 XT. Under these settings, the Nvidia overhead issue is no longer apparent.
4K - Medium

At 4K, even with medium settings, we are fully GPU limited. It's worth noting that we use the built-in benchmark to test Rainbow Six Siege, as in-game testing can be inconsistent. While the benchmark is highly repeatable, it is not as CPU demanding as real gameplay, so keep that in mind.
Using this method, we find both the 9800X3D and 7600X delivering identical performance at 4K, with the RTX 5090 maxing out at 370 fps.
1080p - Ultra

Now using the Ultra+ preset (which defaults to 100% render scale), we start with the 1080p results. Even at these higher quality settings, the 9800X3D is still 27% faster than the 7600X when paired with the RTX 5090. With the RTX 5080, that margin drops to just 4%, while performance is identical when using either the RX 9070 or the 9060 XT.
1440p - Ultra

At 1440p, most results become GPU limited. Even with the RTX 5090, the 9800X3D is only 5% faster than the 7600X, or 9% faster when looking at 1% lows. With the RTX 5080, RX 9070, or 9060 XT, performance is fully GPU limited, and both CPUs produce the same results.
4K - Ultra

At 4K with Ultra+ settings, the results are entirely GPU bound. The RTX 5090 tops out at 238 fps, a level both CPUs can comfortably sustain. Naturally, we are also GPU limited with the RTX 5080, RX 9070, and 9060 XT.
Kingdom Come: Deliverance II
1080p – Medium

Next up is Kingdom Come: Deliverance II, a single-player title typically played at the highest possible visual settings. If you own an RTX 5090, it's unlikely you're gaming at 1080p with medium settings. This test is mostly academic. Under these conditions, the 9800X3D is 37% faster than the 7600X.
That margin drops to 11% with the RTX 5080, although the 9800X3D still delivers 22% higher 1% low performance. As we move to the RX 9070 and 9060 XT, results become entirely GPU limited.
1440p – Medium

Increasing the resolution to 1440p adds GPU load, but even so, the 9800X3D remains 24% faster than the 7600X with the RTX 5090. With the RTX 5080, average frame rates converge, though the X3D still delivers 17% better 1% lows. The RX 9070 drops to around 150 fps, a level both CPUs can easily handle, making the results entirely GPU bound. The same is true for the 9060 XT.
4K – Medium

At 4K with medium settings, we've hit the RTX 5090's limit. The 7600X is just 2% slower than the 9800X3D in average frame rate and 6% slower in 1% lows. Beyond that, all data is GPU limited, and both CPUs perform equally.
1080p – Ultra

Switching to Ultra quality settings, the RTX 5090 reaches 225 fps when paired with the 9800X3D, making it 15% faster than the 7600X. With the RTX 5080, the 9800X3D only maintains an advantage in 1% lows, being 9% faster.
Once we test with the RX 9070 and 9060 XT, performance is identical for both CPUs due to GPU limitations.
1440p – Ultra

At 1440p, the additional GPU load limits even the RTX 5090 when paired with the Ryzen 5 processor. Therefore, performance levels are the same across all configurations using the RTX 5080, RX 9070, and 9060 XT.
4K – Ultra

Unsurprisingly, you won't be shocked to learn that at 4K we're entirely GPU limited. Even the RTX 5090 only manages just over 120 fps. So with that, let's move on...
Marvel Rivals
1080p – Medium

Like Rainbow Six Siege, Marvel Rivals is a competitive shooter, so gamers are likely to prioritize frame rates over visuals. For that reason, the medium quality settings make sense, even for those using a high-end GPU like the RTX 5090. At 1080p, the 9800X3D was nearly 40% faster than the 7600X, which is a massive performance gain.
However, dropping down to the RTX 5080 reduced that margin to just 7%, and we observed no performance difference when using the RX 9070 or 9060 XT.
1440p – Medium

Increasing the resolution to 1440p brought the performance advantage of the 9800X3D with the RTX 5090 down to 18%. Beyond that point, results became heavily GPU limited, and both CPUs delivered the same level of performance.
4K – Medium

At 4K using the medium preset, the 9800X3D improved the average frame rate with the RTX 5090 by only 5%, though 1% lows were 13% higher. Once we step down to the RTX 5080, there is no difference between the two CPUs, and the same applies to the RX 9070 and 9060 XT.
1080p – Ultra

Increasing visual quality with the Ultra preset also increases GPU load. At 1080p, the 9800X3D is 21% faster than the 7600X, or 26% faster in 1% lows. Outside of the RTX 5090, however, performance remains unchanged, as the results are again heavily GPU limited.
1440p – Ultra

At 1440p, the GPU bottleneck tightens the gap even more. The only performance difference is seen with the RTX 5090, where the 9800X3D is just 5% faster. Beyond that, the data is entirely GPU limited, and there is no meaningful difference between the two CPUs.
4K – Ultra

At 4K with Ultra settings, performance is clearly GPU limited. The RTX 5090 tops out at 90 fps, the RTX 5080 at 59 fps, the RX 9070 at 44 fps, and the 9060 XT at 27 fps.
Warhammer 40,000: Space Marine 2
1080p – Medium

Finally, we have Space Marine 2, a game that is extremely CPU demanding. These results are significantly different from those seen in the other titles. While it features both single-player and multiplayer modes, it is not necessarily competitive in the sense of requiring ultra-high frame rates. Still, high-refresh rate performance is always ideal.
To achieve that, a fast CPU such as the 9800X3D is required. It was 41% faster than the 7600X. The Ryzen 5 processor was only able to deliver just over 90 fps in our horde battle test, while the 9800X3D reached up to 130 fps.
Because this scenario is largely CPU bound, the RTX 5080 produced identical results to the RTX 5090, and it was a similar story with the RX 9070. Performance began to drop only with the 9060 XT, though even here, the 9800X3D maintained a 22% advantage.
1440p – Medium

Even at 1440p, the 9800X3D remains over 40% faster than the 7600X when paired with the RTX 5090 or 5080. The margin narrows to 31% with the RX 9070, which is still significant. With the 9060 XT, performance equalizes.
4K – Medium

At 4K, the 9800X3D continues to outperform, delivering 43% higher performance than the 7600X with the RTX 5090 and 17% higher with the 5080. However, with the RX 9070 and 9060 XT, results are fully GPU limited, and both CPUs perform the same.
1080p – Ultra

With Ultra settings enabled, the 9800X3D maintains a significant lead at 1080p. Using the RTX 5090, it is 41% faster than the 7600X, and 39% faster with the RTX 5080. It is also 33% faster with the RX 9070. Performance is equal when using the 9060 XT due to GPU constraints.
1440p – Ultra

At 1440p with Ultra settings, the 9800X3D remains 37% faster when paired with the RTX 5090 and 36% faster with the RTX 5080. With the RX 9070, the gap narrows to 13%. The 9060 XT is again GPU limited, and both CPUs deliver the same performance.
4K – Ultra

At 4K with maximum visual settings, only the RTX 5090 shows a performance difference between the CPUs. It is capable of pushing well over 100 fps, giving the 9800X3D a 34% advantage. If you are using an RTX 5080 or anything slower, performance is GPU limited regardless of whether you use the 9800X3D or 7600X.
Performance Summary
1080p – Medium

To wrap things up, we have the four-game average, calculated using the geomean. While this may not be the most insightful metric given we only tested four titles, we include it because skipping it for any reason will definitely generate a lot of comments about that alone, so here you have it to avoid that from happening.
Across the four games tested at 1080p using medium settings, the 9800X3D was, on average, 37% faster than the 7600X when paired with the RTX 5090. That margin dropped to 20% with the RTX 5080, 8% with the RX 9070, and, somewhat surprisingly, we still saw a 5% uplift with the 9060 XT, despite the GPU-limited nature of much of that data.
1440p - Medium

At 1440p, the 9800X3D was 29% faster than the 7600X when paired with the RTX 5090. That advantage dropped to 10% with the RTX 5080 and 7% with the RX 9070. With the 9060 XT, performance was completely GPU limited, eliminating any CPU performance gap.
4K - Medium

At 4K using medium settings, we observed just a 10% performance increase on average with the 9800X3D and RTX 5090. That dropped to 4% with the RTX 5080, and there was no measurable difference with the RX 9070 or 9060 XT.
1080p - Ultra

Switching to the Ultra preset at 1080p, the 9800X3D was 26% faster than the 7600X with the RTX 5090, 10% faster with the RTX 5080, and 8% faster with the RX 9070. No difference was observed with the 9060 XT.
1440p - Ultra
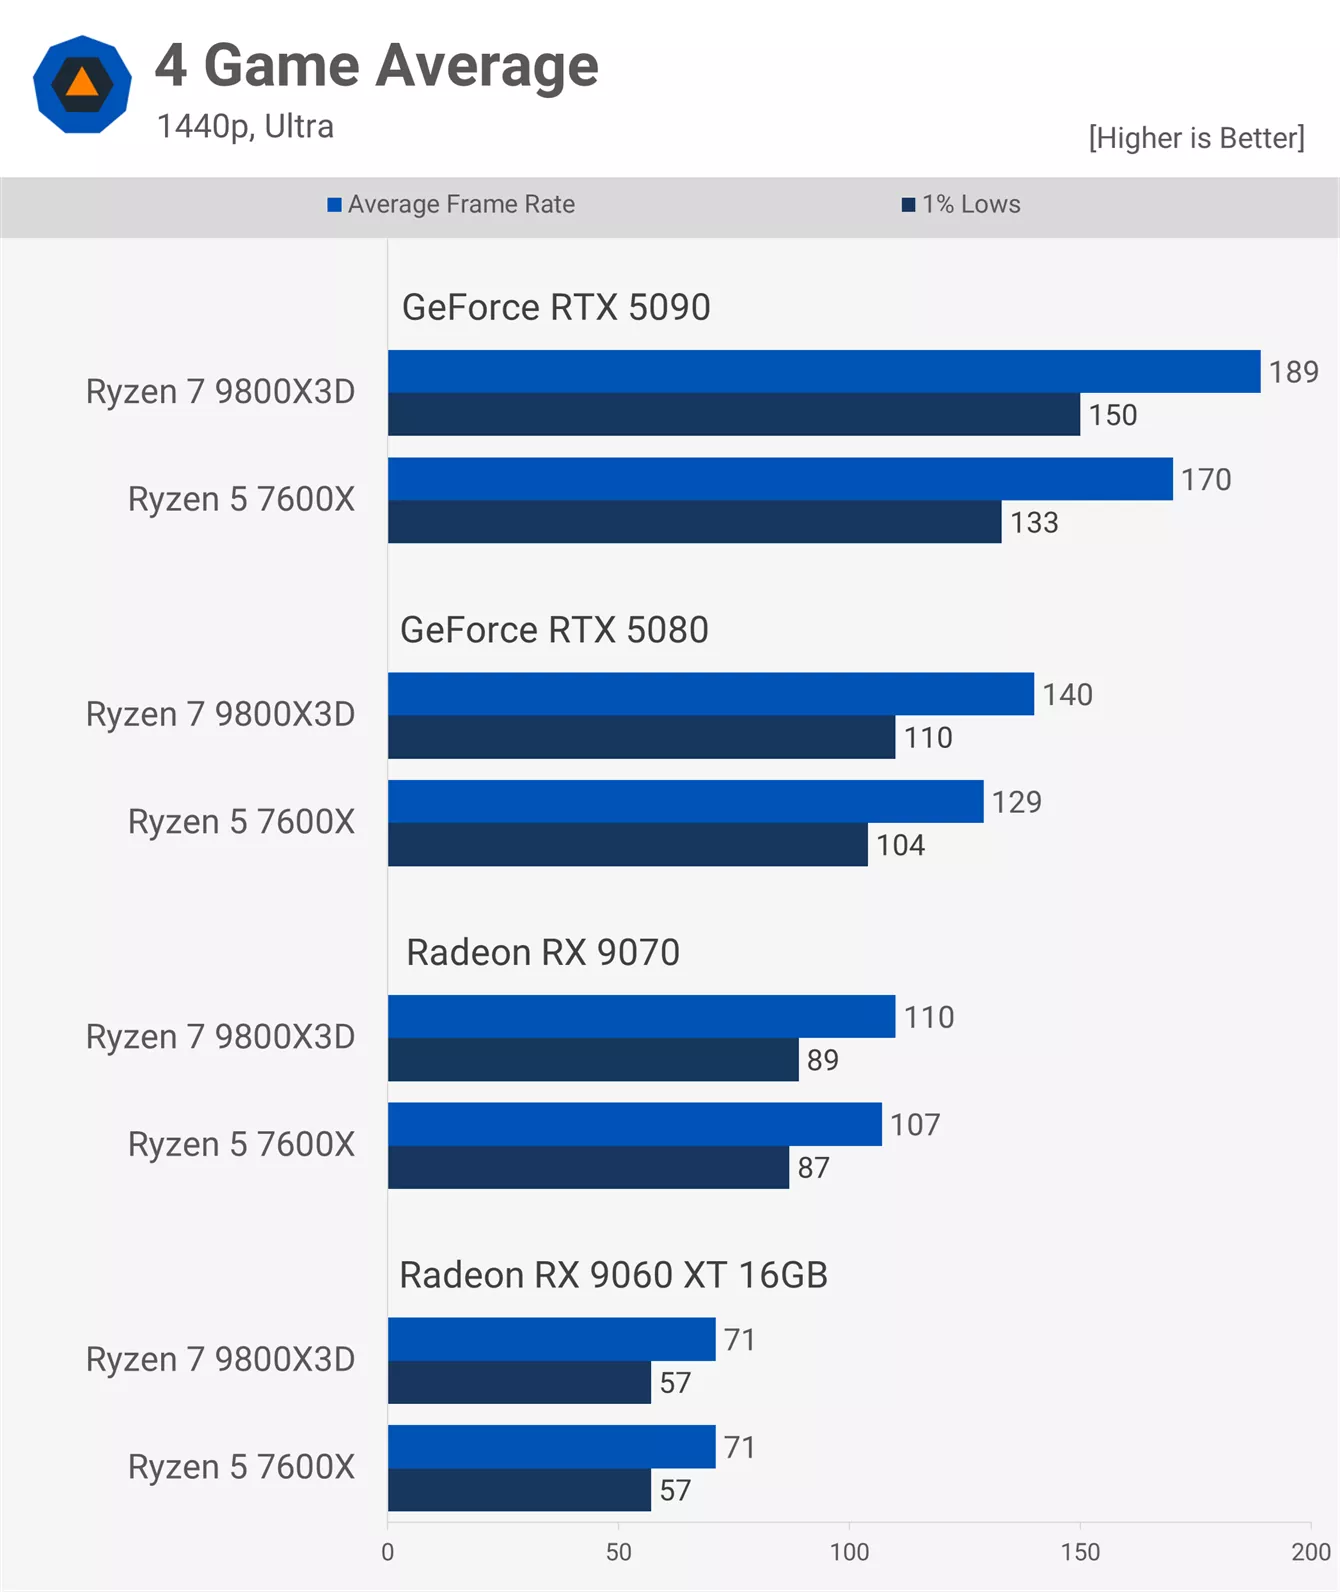
At 1440p, as expected, GPU limitations become more prevalent. The 9800X3D was 11% faster with the RTX 5090, 9% faster with the RTX 5080, and just 3% faster with the RX 9070. Performance was entirely GPU limited with the 9060 XT.
4K - Ultra

Finally, at 4K with Ultra settings, we saw little difference between the CPUs. On average, the 9800X3D was only 8% faster with the RTX 5090, and no difference was observed with the other GPUs.
What We Learned
After running the Ryzen 5 7600X and Ryzen 7 9800X3D through a battery of real-world game tests across a wide range of settings, one thing is clear: the performance difference between these two CPUs depends heavily on the game and the settings used. Generally speaking, competitive shooters tend to be CPU limited, while most triple-A single-player games are GPU limited, but not always.
We saw two clear examples of this. In Kingdom Come: Deliverance II, the Ultra quality data at 1440p was entirely GPU limited, even with the RTX 5090. In these scenarios, GPU performance is the priority – as long as your CPU is at least equivalent to the Ryzen 5 7600X. In such cases, upgrading to the 9800X3D won't deliver extra performance. One caveat, however, is that more CPU-intensive scenes could change that outcome.

Space Marine 2, on the other hand, flips the script because it is a very CPU-intensive title. We tested a section that is known to stress the CPU, and at 1440p using Ultra settings, the 9800X3D was 37% faster than the 7600X when paired with a high-end GPU like the RTX 5080 or above. That advantage dropped to 13% with the Radeon RX 9070, but it is still a reasonable increase.

It's not just a matter of choosing between two processors. These CPUs serve different kinds of gamers. The 9800X3D, priced around $450, is for those chasing top-tier performance. The $190 7600X, meanwhile, offers outstanding value for the money. Most players aren't deciding between them as these two segments rarely overlap.

That said, in CPU-bound scenarios, the 9800X3D can be roughly 40% faster. Looking at our launch-day review data for the 9800X3D, we saw an average uplift of 38% across 14 games compared to the 7600X. The numbers in today's test align closely with that. Depending on the games you play and how you play them, you may or may not see that level of improvement today – but as CPU demands increase in future titles, that margin could become the norm.

At the end of the day, it's important to understand your own CPU demands. You can determine this by looking at the games you play and how you play them.
For now, that wraps up this CPU scaling comparison. More benchmarks are coming, so if you enjoyed this benchmark format stay tuned and subscribe to our email newsletter for updates.