Pre-installed Software and Performance
The ThinkPad X220 we received for review came with Windows 7 Professional 64-bit, although Home Premium and Basic will also be available as options. As we've seen on other ThinkPads, the X220 comes with a light installation of third-party applications. The only questionable app was the Bing Toolbar. Other software includes a Microsoft Office 2010 trial along with Office Starter 2010, Skype, Norton Internet Security and Microsoft Silverlight.
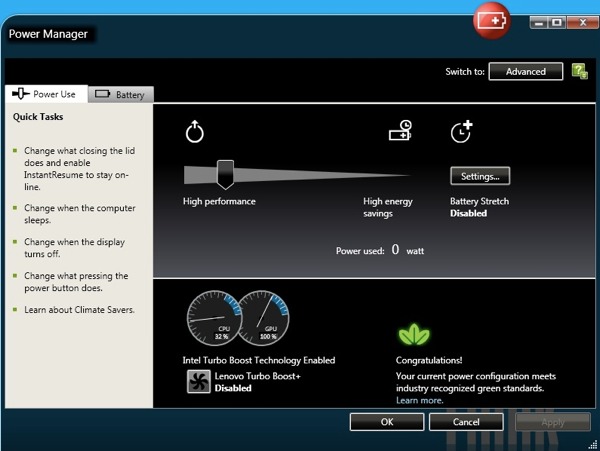
Lenovo installs plenty of their own software such as the ThinkVantage Toolbox, which is a suite of programs that cover things like system health, security, networking and diagnostics. Lenovo's custom power management program, Power Manager 3, is also included and set to a medium power / energy saving profile by default. Out of the box, the X220 takes about 47 seconds to boot into Windows and become fully responsive.

Intel's Turbo Boost 2 is also part of the new second generation Core series chips and is designed to better manage workloads by dynamically adjusting individual core speeds depending on the processing power is needed.
Intel is quick to point out that this is not considered overclocking as the processor is still running within its thermal specifications. The Core i5-2520M in our unit is clocked at 2.5 GHz and should ramp up to 3.2GHz as and if needed.
Below we've included a set of benchmark numbers and graphs from several tests run on the ThinkPad X220 to give you an idea of how the system performs under load.
- 12.5" Premium HD LED-backlit IPS 1366 x 768 display
- Intel Core i5-2520M (2.5GHz - 3.2GHz, 3MB L3 cache)
- 4GB PC3-10700 DDR3 SDRAM
- Intel HD 3000 Graphics (650MHz - 1.3GHz)
- Hitachi 320GB 7200RPM hard drive
- Microsoft Windows 7 Professional (64-bit)
- 12.5" HD AntiGlare 1366 x 768 display
- Intel ULV Core i5-470UM (1.33GHz, 3MB L2 cache)
- 4GB PC3-8500 DDR3 SDRAM
- Intel HD Graphics
- Hitachi 320GB 5400RPM hard drive
- Microsoft Windows 7 Home Premium (64-bit)
- 14.5" HP Radiance 1600 x 900 display
- Intel Core i5-450M (2.4GHz - 2.66GHz, 3MB L3 cache)
- 4GB DDR3 system memory
- 1GB ATI Mobility Radeon HD 5650
- Seagate Momentus 500GB 7200RPM
- Microsoft Windows 7 Home Premium (64-bit)
- 15.6-inch HD+ anti-glare 1600 x 900 display
- Intel Core i7-620M (2.66GHz - 3.33GHz, 4MB L3 cache)
- 2GB PC3-8500 DDR3 system memory
- 512MB Nvidia NVS 3100m
- 250GB 5400RPM
- Microsoft Windows 7 Professional (32-bit)
| Synthetic Tests | X220 | U260 | Envy 14 | T510 |
| 3DMark 06 | ||||
| 3DMark Score | 3786 3DMarks | 1148 3DMarks | 6866 3DMarks | 3250 3DMarks |
| PCMark Vantage | ||||
| PCMark Suite | 7201 PCMarks | 3557 PCMarks | 6840 PCMarks | 5781 PCMarks |
The ThinkPad X220 relies on the processor's integrated graphics, however it made an impressive showing in 3DMark 06, only falling behind the HP Envy 14's discrete Mobility Radeon GPU. The X220 handled graphics better than last year's ThinkPad T510 that carried a discrete Nvidia Quadro mobile GPU.
In PCMark Vantage where the CPU plays a more important role, the X220's last-gen Core i5 blasted through somewhat similar 2010's offerings.
| Application Tests | X220 | U260 | Envy 14 | T510 |
| iTunes Encoding Test | 01 min 14 sec | 02 min 39 sec | 01 min 34 sec | 01 min 22 sec |
| File Transfer Test | ||||
| Small files | 1 min 20 sec | 1 min 42 sec | 01 min 20 sec | 02 min 05 sec |
| Large file | 56 sec | 1 min 31 sec | 01 min 14 sec | 02 min 11 sec |
The iTunes encoding tests consist of converting 14 MP3s (119MB) to 128Kbps ACC files and measuring the operation's duration in seconds. For the file transfer test, we measure how long it takes to copy two sets of files from one location to another on the same hard drive. On the small files test we transfer 557 MP3s, totaling 2.56GB. For the large file, these same MP3s were zipped into a single file measuring 2.52GB.
| Gaming Performance | X220 | U260 | Envy 14 | T510 |
| Far Cry 2 | ||||
| 1024x768 Medium Quality | 27.56 FPS | -- | -- | -- |
| Native Resolution, High Quality | 18.46 FPS | -- | -- | -- |
| StarCraft 2 | ||||
| 1024x768 Medium Quality | 15.60 FPS | -- | -- | -- |
| Native Resolution, High Quality | 10.21 FPS | -- | -- | -- |
We have just begun collecting benchmarks with our revamped set of gaming tests for notebooks, hence the lack of scores for comparison. The Far Cry 2 test is meant to give you an idea if the laptop is capable of playing a modern first person shooter, even on reduced settings. Then StarCraft 2, a game that needs no introduction, I'm sure will stick around for the years to come, so it's another game we have set for reference.
The StarCraft 2 test we performed here is the same we use for desktop graphics cards and thus involves a lot of on-screen action which explains the low average FPS. I found that in a beginner style game, I was averaging around double the frame rates that our custom test produced.