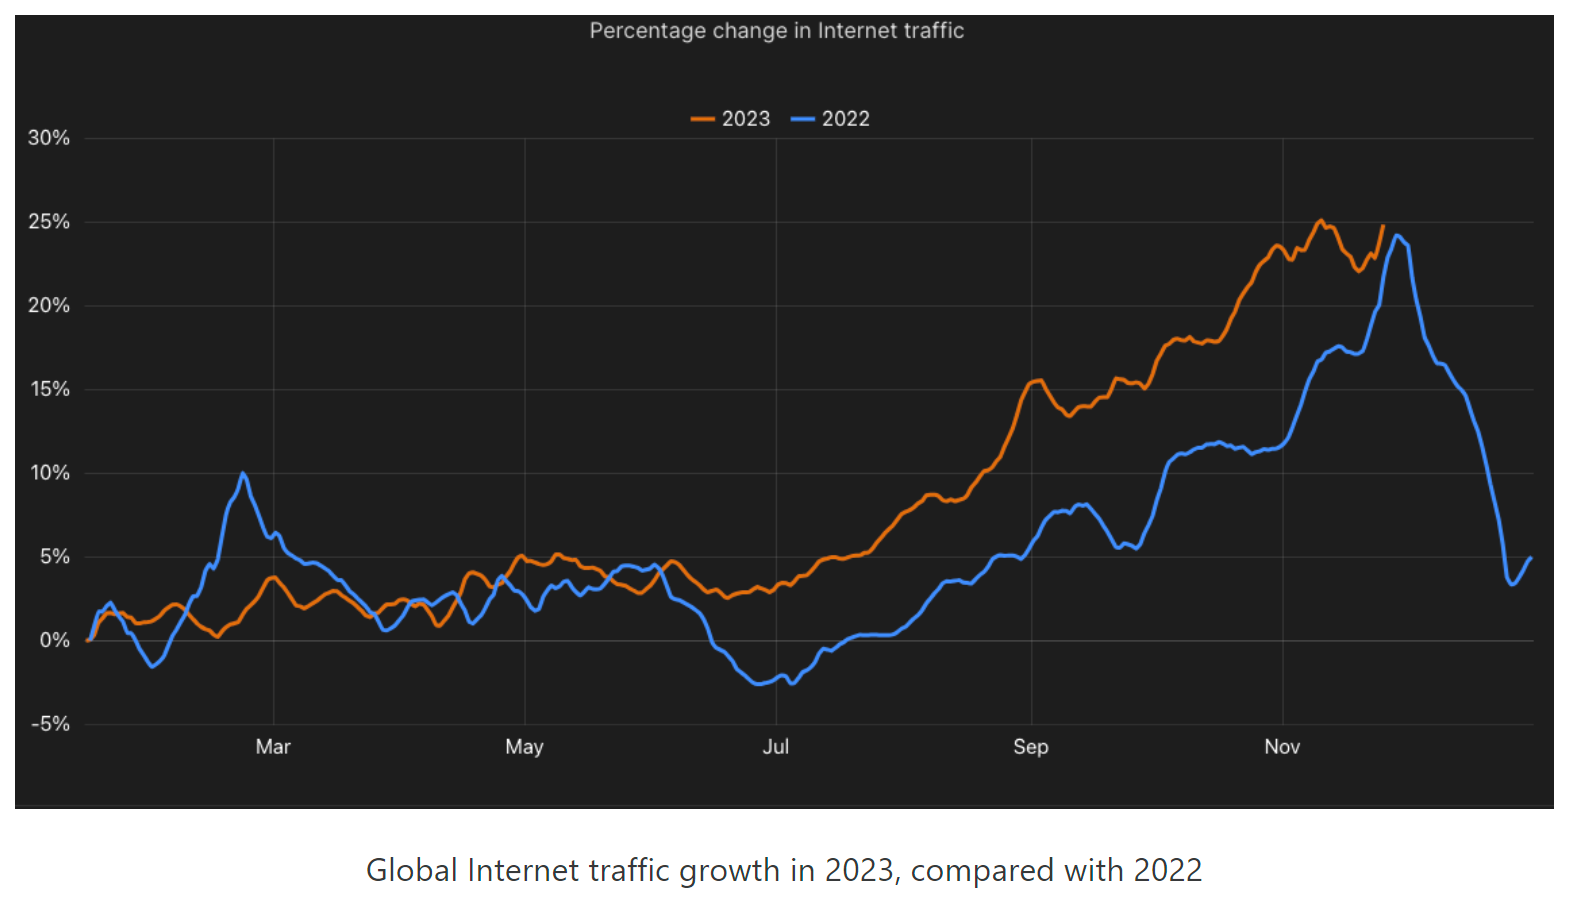
In brief: For the second year in a row, global internet traffic grew 25% over the last 12 months, highlighting how the rate of growth isn't slowing down as more businesses, services, and people rely on being connected. It's one of several facts to come from Cloudflare's 2023 Year in Review report on internet trends and patterns.

Cloudflare's summary of findings for 2023 shows that nearly half of web requests used HTTP/2, with 20% using HTTP/3. Only a third of IPv6-capable requests worldwide were made over IPv6. In India, however, that share reached 70%
Over 40% of global traffic comes from mobile devices, though it's over 50% in more than 80 countries. Desktop was the preferred method of access in the US, with mobile devices accounting for just 33.3% of internet traffic.
Android was the most popular OS for getting online, with over two-thirds of mobile traffic coming from devices running Google's software. Android had an over 90% share of mobile device traffic in over 25 countries and regions while peak iOS mobile device traffic share was 66%. In the US, the split was 46.6% Android and 53.4% iOS.
Another interesting finding is that in the United States, the most common download speed is 0 - 5Mbps, while upload speed is 10Mbps - 15 Mbps. But the average download speed is 201 Mbps and the average latency is 39ms.
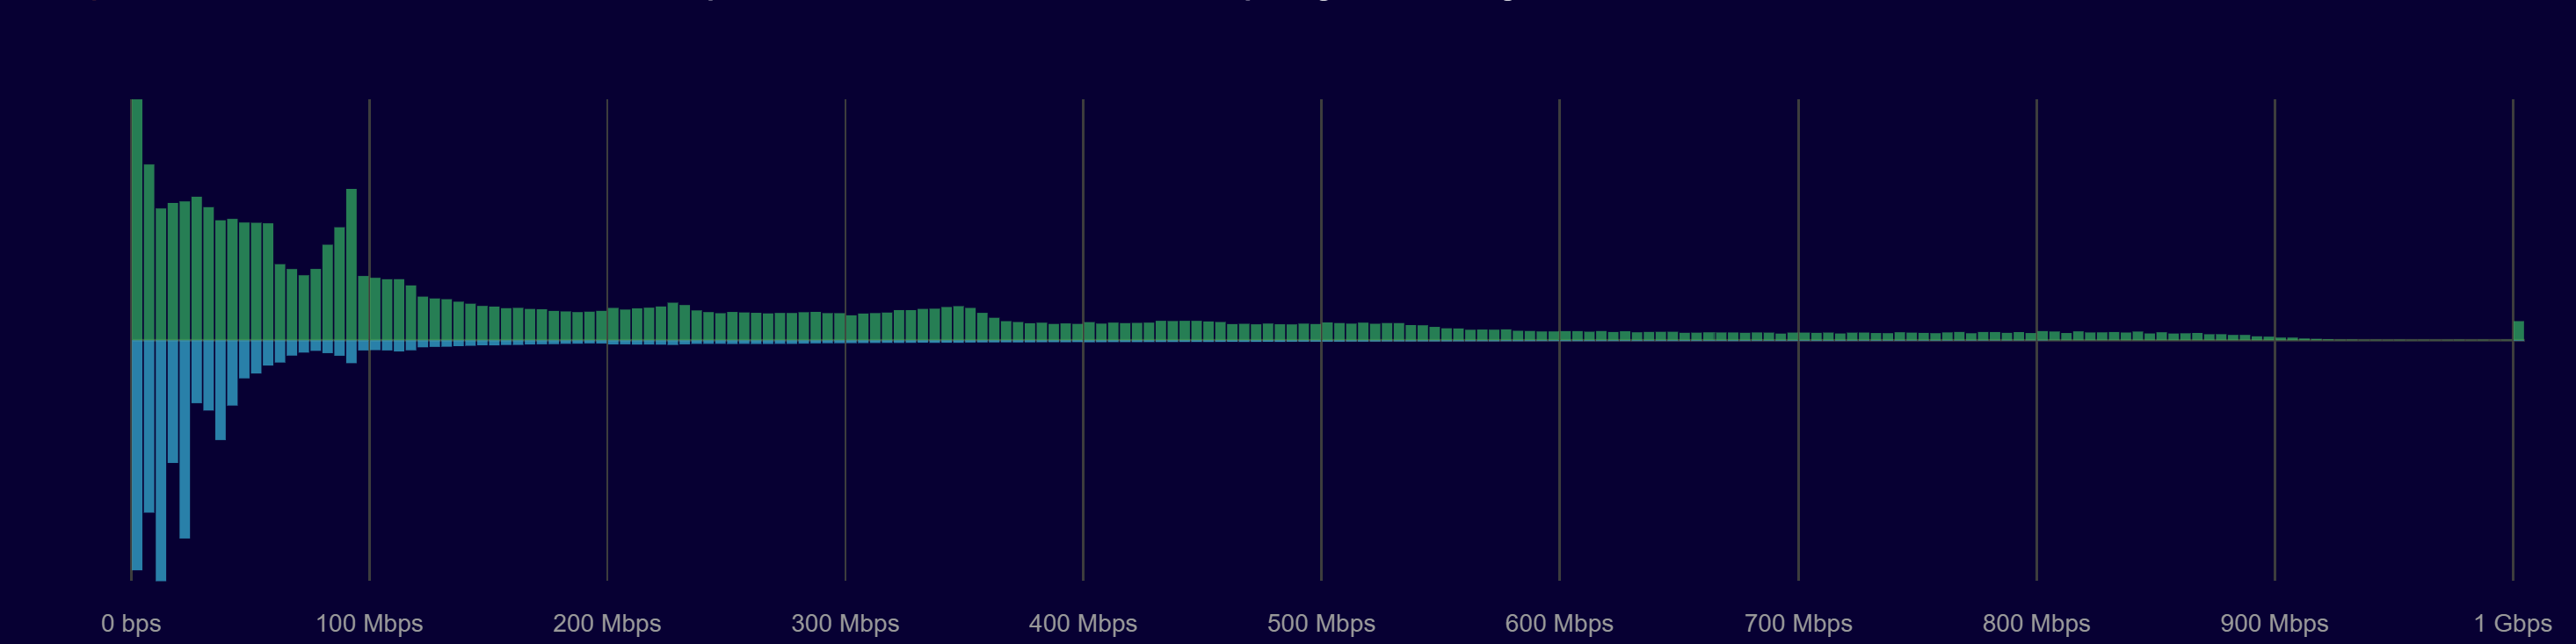
Download/upload speeds in the US
A third of global bot traffic comes from the United States, and over 11% of global bot traffic originates from Amazon Web Services. Finance was the most attacked industry, and deceptive links and extortion attempts were two of the most common types of threats found in malicious email messages
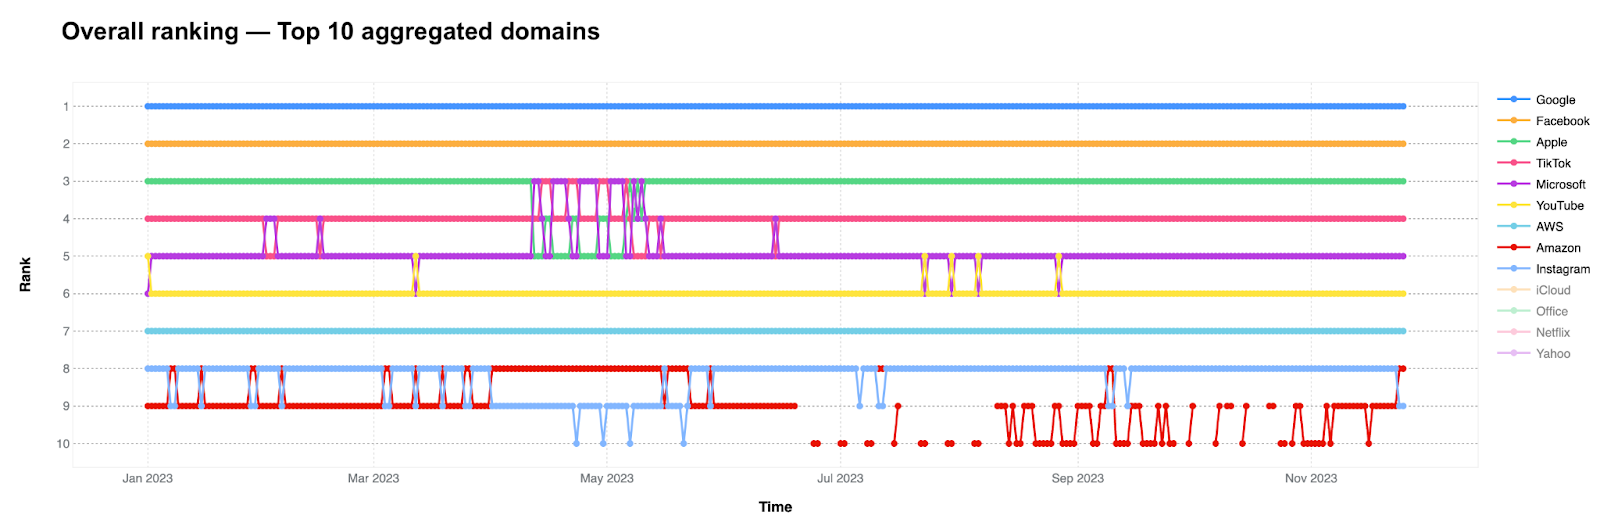
Google was once again the most popular general internet service. It was followed by Facebook, Apple, and TikTok. Mark Zuckerberg's social media giant will be pleased to have placed above rival TikTok, which was the most popular service in 2021.
It should come as no surprise to learn that OpenAI was the most popular service in the generative AI category; the company's Wikipedia entry was the website's most visited article of the year. We also saw "AI" crowned as word of the year by Collins Dictionary.
Roblox topped the metaverse and gaming services category for the year, ahead of Xbox Live, Epic Games/Fortnite, and PlayStation. Oculus was fifth, ahead of sixth-placed Steam, though Valve's service was more popular than Oculus from July to September.
Elsewhere, Stripe knocked PayPal off the top spot in the services category. Binance held on to its crown as the most popular cryptocurrency service, Amazon led in the E-commerce section, YouTube was top for streaming, and WhatsApp the most popular messaging service.
Cloudflare writes that the rankings of service popularity are based on analysis of anonymized query data of traffic to its 1.1.1.1 public DNS resolver from millions of users around the world.
https://www.techspot.com/news/101203-cloudflare-internet-traffic-surges-25-second-year-row.html
