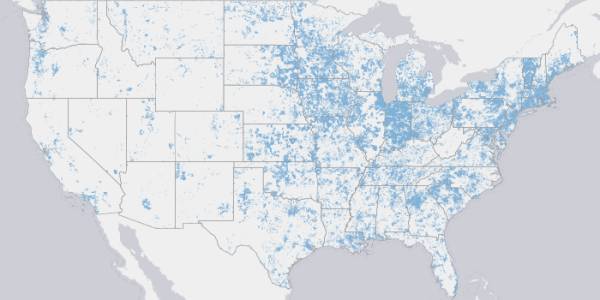
The Department of Commerce's National Telecommunications and Information Administration (NTIA) has unveiled the National Broadband Map for the US. The map is the first public, searchable nationwide map of broadband Internet availability: its goal is to help expand broadband access and adoption in communities at risk of being left behind in the 21st century economy as well as aid businesses and consumers seeking information on their high-speed Internet options.
The NTIA created the National Broadband Map in collaboration with the Federal Communications Commission (FCC), using data that each state, territory, and the District of Columbia (or their designees) collected from broadband providers or other data sources. The result is more than 25 million searchable records showing where broadband Internet service is available, the technology used to provide the service, the maximum advertised speeds of the service, and the names of the service providers. Users can search by address, view the data on a map, or compare broadband across various geographies (states, counties, or congressional districts).

The map shows that between 5 to 10 percent of Americans lack access to broadband at speeds that support a basic set of applications, including downloading webpages, photos, video, and using simple video conferencing. This is a rather confusing number, given that the FCC defined broadband in July 2010 as 4Mbps actual speed downstream and 1Mbps upstream to support these applications. The NTIA only collected data in ranges between 3 to 6Mbps and 6 to 10Mbps maximum advertised download speeds, meaning that all 3Mbps connections were lumped into the broadband category. The FCC found in December 2010 that 68 percent of US broadband connections weren't really broadband.
"The National Broadband Map shows there are still too many people and community institutions lacking the level of broadband service needed to fully participate in the Internet economy. We are pleased to see the increase in broadband adoption last year, particularly in light of the difficult economic environment, but a digital divide remains," Lawrence E. Strickling, Assistant Secretary for Communications and Information and NTIA Administrator, said in a statement. "Through NTIA's Broadband Technology Opportunities Program, digital literacy activities, and other initiatives, including the tools we are releasing today, the Obama Administration is working to address these challenges."
The NTIA has also released a new report previewing data collected through the Internet Usage Survey of 54,000 households, conducted by the US Census Bureau in October 2010. Here are a few highlights:
- Broadband Internet access at home continues to grow: 68 percent of households have broadband access, as compared to 63.5 percent last year. (In the survey, broadband was defined as Internet access service that uses DSL, cable modem, fiber optics, mobile broadband, and other high-speed Internet access services.)
- Notable disparities between demographic groups continue: people with low incomes, disabilities, seniors, minorities, the less-educated, non-family households, and the non-employed tend to lag behind other groups in home broadband use.
- While the digital divide between urban and rural areas has lessened since 2007, it remains significant. In 2010, 70 percent of urban households and only 60 percent of rural households accessed broadband Internet service. (Last year, those figures were 66 percent and 54 percent, respectively.)
- Overall, the two most commonly cited main reasons for not having broadband Internet access at home are that it is perceived as not needed (46 percent) or too expensive (25 percent). In rural America, however, lack of broadband availability is a larger reason for non-adoption than in urban areas (9.4 percent vs. 1 percent). Americans also cite the lack of a computer as a factor.
- Despite the growing importance of the Internet in American life, 28.3 percent of all persons do not use the Internet in any location, down from 31.6 percent last year.
If you want to read the whole 28-page report, check it out here: February 2011 Digital Nation (PDF).