
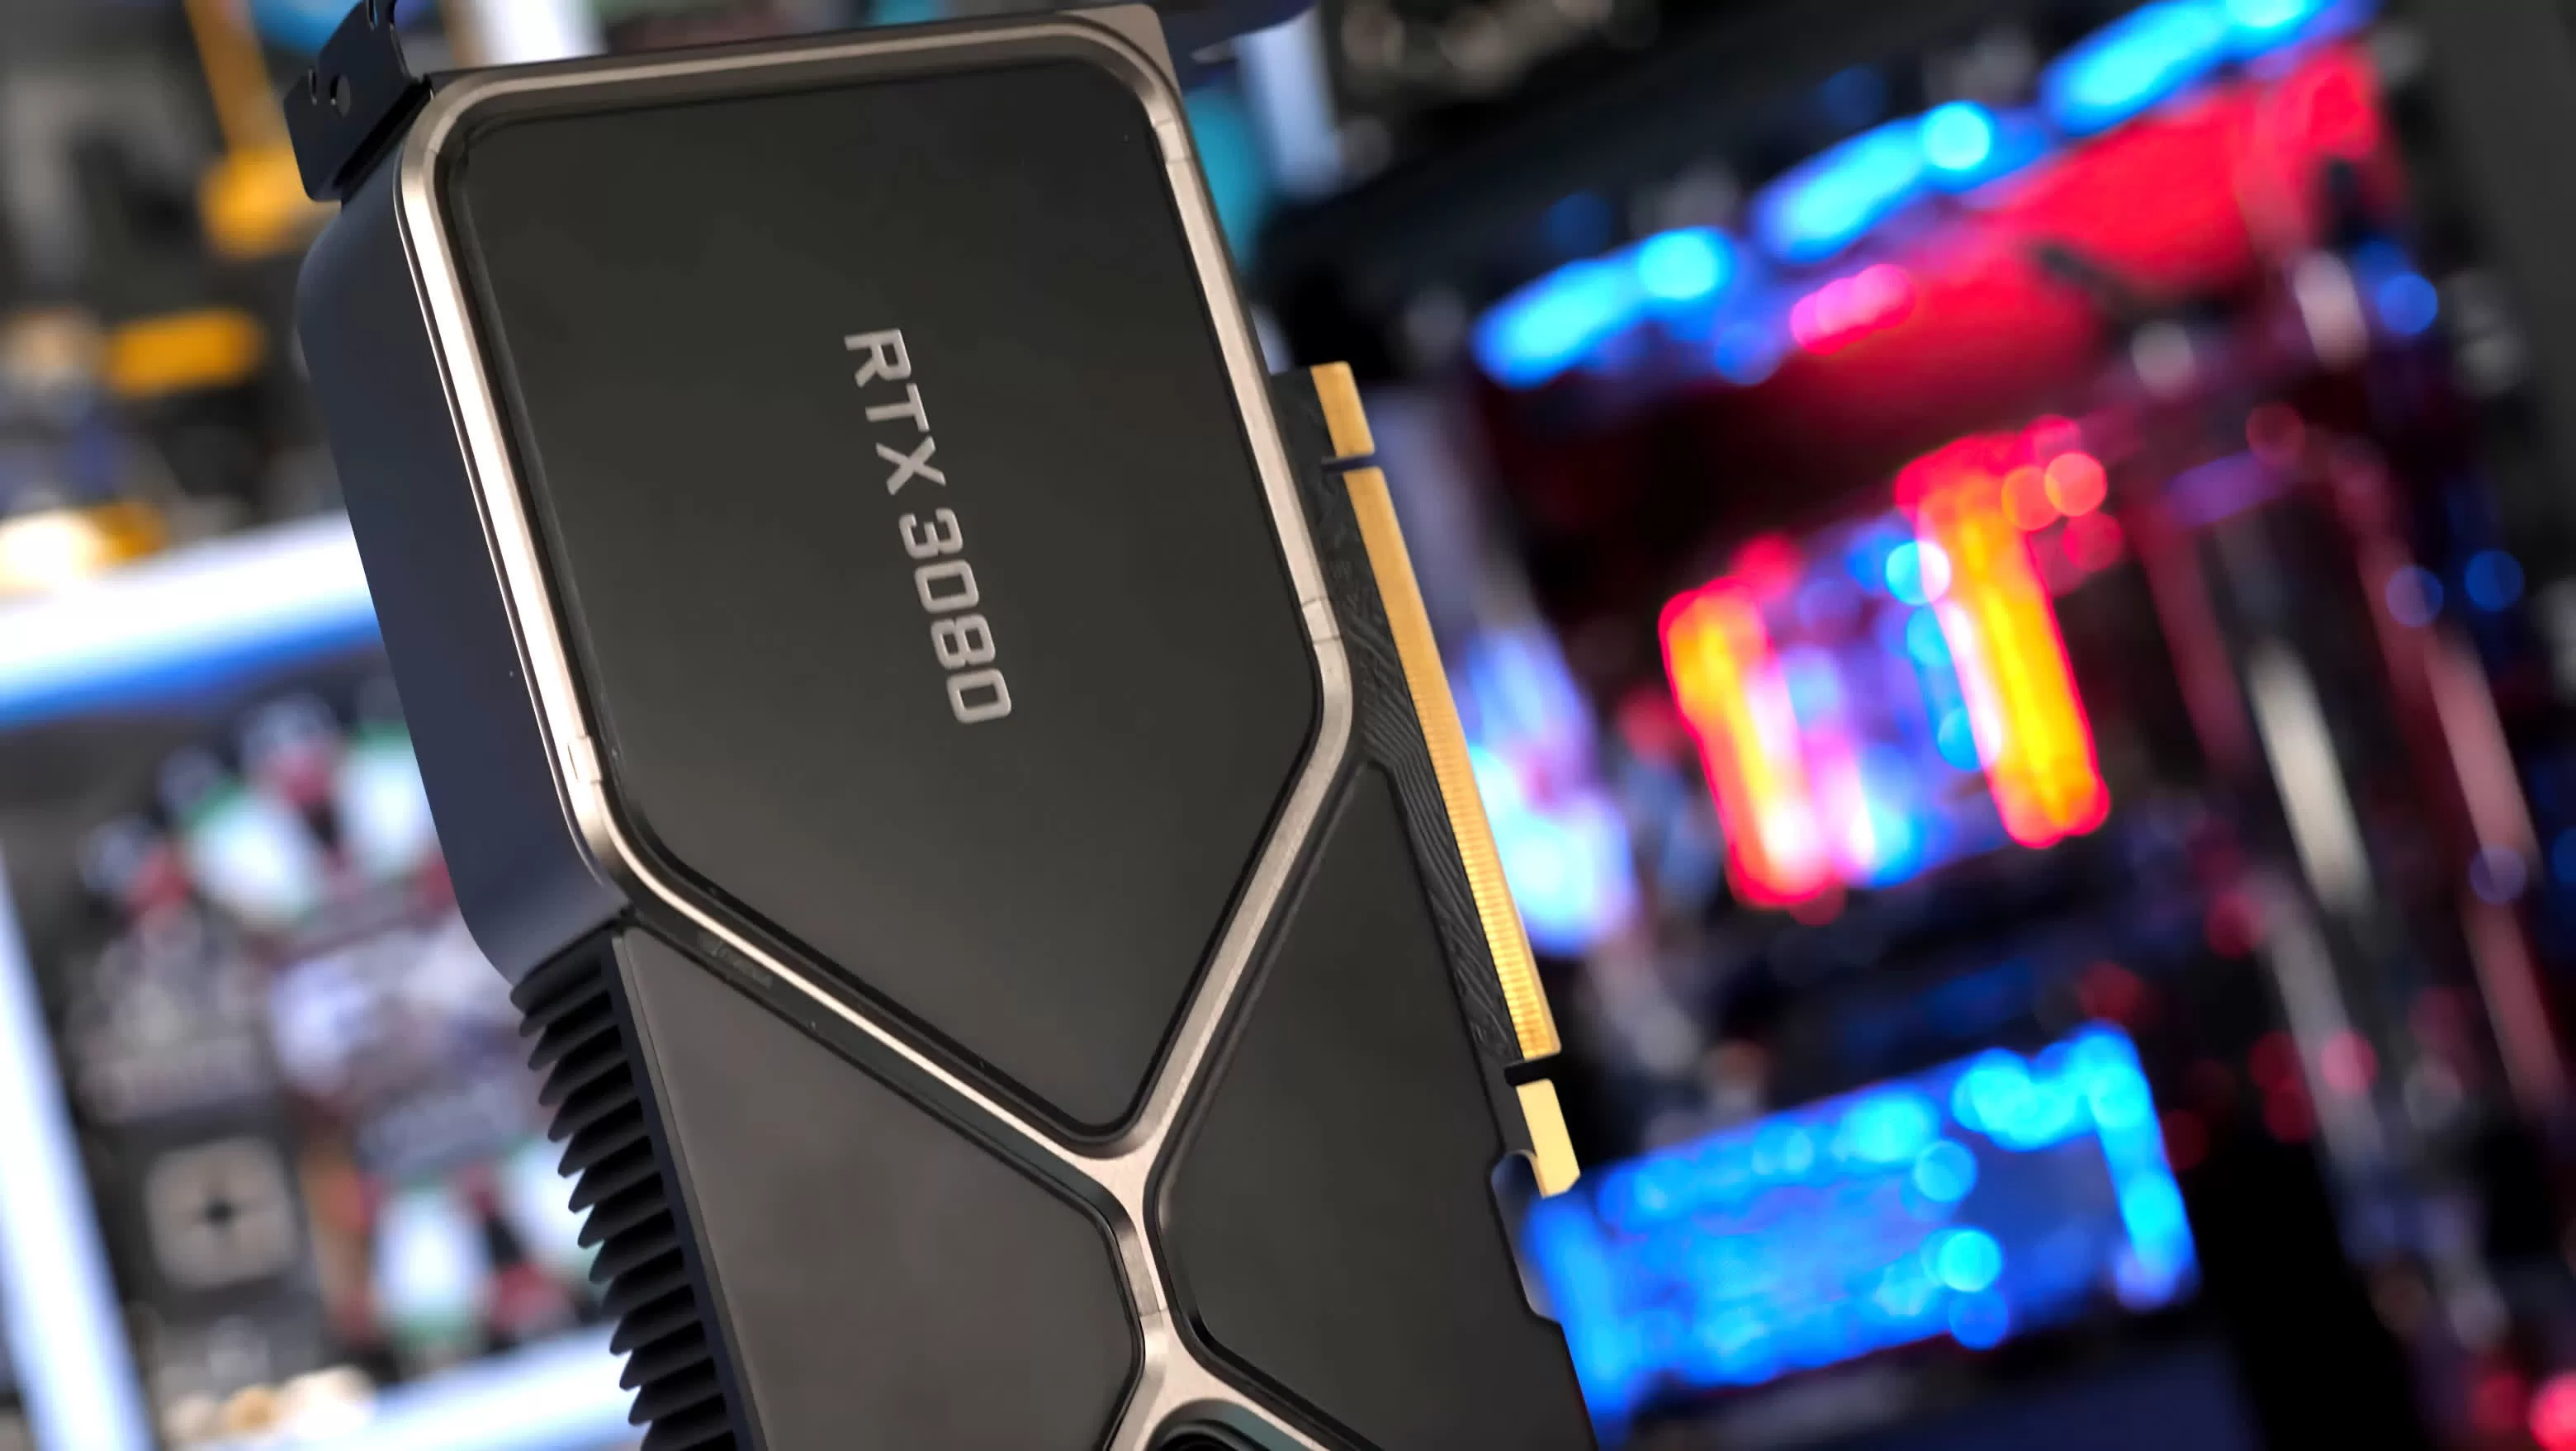
Nvidia claims the new GeForce RTX 30 graphics series provides a giant leap in raw graphics performance, based on the company's latest Ampere architecture and manufactured on Samsung's 8nm process. On paper, the GeForce RTX 3080 certainly looks mighty, packing an insane 28 billion transistors – a 50% increase over the RTX 2080 Ti, the former world's fastest gaming GPU.
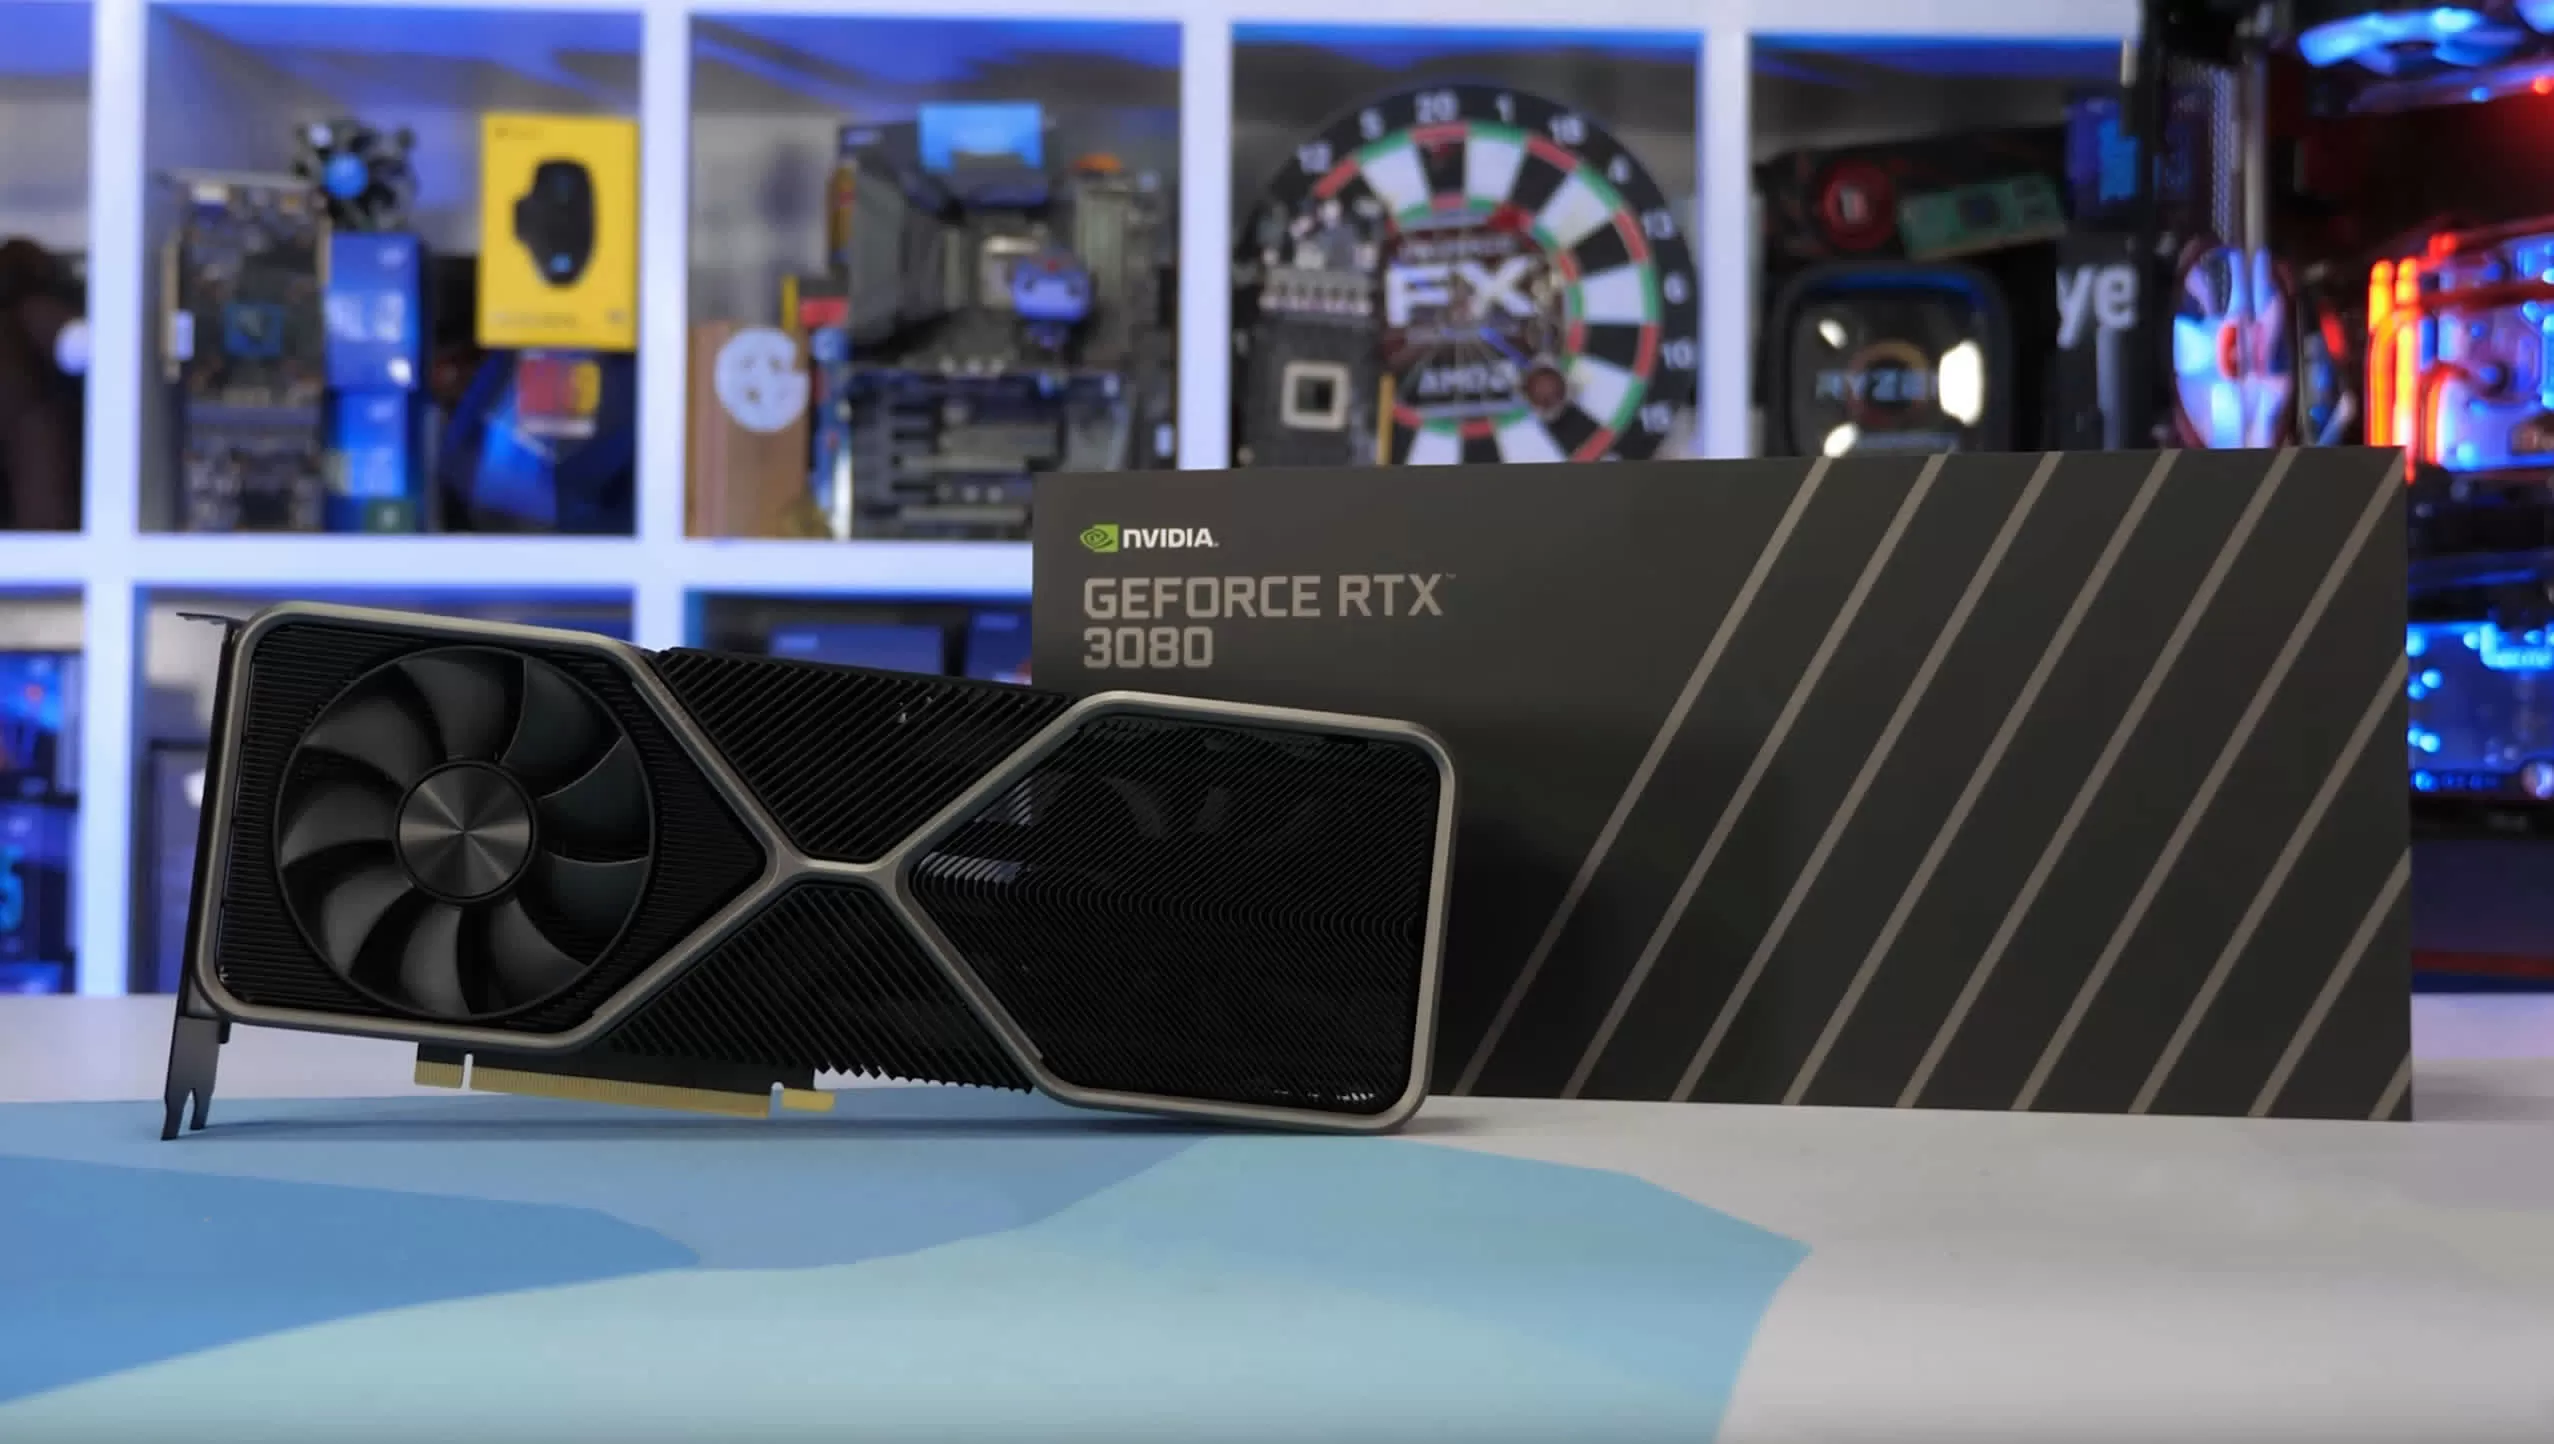
Today we can finally show you how the GeForce RTX 3080 performs and you can of course expect a boatload of benchmark data in this review. There's plenty of architectural information we could go over and we could also explore the Founders Edition card's design, but both of those things easily warrant a dedicated article. Right now it's clear most of you will want the benchmark data first, so we'll cover the hardware basics and then jump into the results.
With Ampere, a big change has been made to the streaming multiprocessor (SM) and its 32-bit floating point or FP32 throughput when compared to GeForce 20 Turing GPUs. Nvidia doubled the throughput by designing a new datapath for FP32 and INT32 operations which results in all four partitions combined executing 128 FP32 operations per clock.
Nvidia says this helps improve gaming performance and while true, its effectiveness depends on a few things which we will explore in this review. Here's a side-by-side specification comparison between the RTX 3080, 2080 and 2080 Ti.
| GeForce RTX 3080 | GeForce RTX 2080 | GeForce RTX 2080 Ti | |
| Price (MSRP) | $700 | $1200 | |
| Release Date | September 2020 | September 2018 | |
| Process | Samsung 8N | TSMC12FFN | |
| Transistors (billion) | 28 | 13.6 | 18.6 |
| Die Size (mm2) | 628.4 | 545 | 754 |
| Core Config | 8704 / 272 / 96 | 2944 / 184 / 64 | 4352 / 272 / 88 |
| Core Clock Frequency | 1440 / 1710 MHz | 1515 / 1710 MHz | 1350 / 1545 MHz |
| Memory Capacity | 10 GB | 8 GB | 11 GB |
| Memory Speed | 19 Gbps | 14 Gbps | |
| Memory Type | GDDR6X | GDDR6 | |
| Bus Type / Bandwidth | 320-bit / 760 GB/s | 256-bit / 448 GB/s | 352-bit / 616 GB/s |
| TGP | 320 watt | 215 watt | 250 watt |
When compared to the 2080 Ti we're looking at the same number of SM units with the RTX 3080, but thanks to the 2x FP32 redesign, Nvidia is claiming a 100% increase in CUDA cores. That doesn't mean the 3080 will be 100% faster than the 2080 Ti, but it will offer a reasonable performance uplift. Point is, you can't make a meaningful CUDA core count comparison between different generations.

Comparing the memory configuration is a more straightforward affair. The RTX 2080 Ti has an 11 GB memory buffer, while the RTX 3080 offers 10 GB. This is still a 25% increase over the vanilla RTX 2080, but it's surprising since you'd expect a larger buffer for a card targeting 4K gaming.
The memory bandwidth has been greatly increased thanks to the use of 19 Gbps GDDR6X memory on a 320-bit wide bus, resulting in a peak bandwidth of 760 GB/s, a 23% increase from the 2080 Ti and 70% from the 2080.
It's also worth noting the increase in TGP (Total Graphics Power) from 215 watts for the RTX 2080 to 320 watts for the RTX 3080, a massive 49% increase and even a 28% increase from the 2080 Ti. It will be interesting to see how well the RTX 3080 Founders Edition graphics card deals with all that power once it's converted to heat energy.
But enough about all that, it's time to get into the blue bar graphs. For testing we're using our Ryzen 9 3950X test system, featuring four sticks of low latency DDR4-3200 memory operating in a dual-rank configuration. We also have some Core i9-10900K and PCI Express 3.0 vs 4.0 preliminary data that we'll look at, so let's get to it.
Benchmarks
Starting with Death Stranding, we're looking at a 20% performance increase over the 2080 Ti at 1440p and a 41% increase over the RTX 2080. Not bad at all, but not the 80% we suspect many of you were expecting to see. We should note the margins were identical on our Core i9-10900K test system.

Moving to 4K does improve margins for the RTX 3080 and now it's 29% faster than the 2080 Ti and 62% faster than the vanilla 2080, so that's starting to get up there. Also 107 fps on average at 4K is a very impressive result, the game looked spectacular and as you might imagine, was very smooth.

Unfortunately the performance gains in Microsoft Flight Simulator 2020 at 1440p are very weak and this is largely due to our choice to use the 3950X, the game just doesn't utilize Ryzen processors very well right now and is in desperate need of low-level API support.

Here we're looking at a measly 9% increase over the 2080 Ti and 30% over the 2080, but even with an Intel CPU you're still only looking at a 20% increase over the 2080 Ti.

Jumping to 4K does help alleviate the CPU bottleneck and the RTX 3080 was 29% faster than the 2080 Ti. We saw the same frame rates on our 10900K test system. So with an RTX 3080 you're looking at just 40 fps at 4K over big cities in Flight Simulator 2020.

Shadow of the Tomb Raider was one of the games that impressed me the most two years ago when testing the 2080 Ti, the 4K experience was amazing. At 1440p the RTX 3080 is seen to be 28% faster than the 2080 Ti and 57% faster than the 2080, at 154 fps on average under these conditions is very impressive.

Then at 4K we see that 87 fps on average is possible with the RTX 3080, pretty impressive stuff. That's a 67% increase over the 2080 and 30% over the 2080 Ti, so both are quite impressive gains, particularly given this is a $700 GPU.

Moving on to Tom Clancy's Rainbow Six Siege, we're looking at a 28% increase over the 2080 Ti and 63% over the standard 2080 or 54% over the Super version.
We're probably not going to reference the 2080 Super much since it offered a mere 5% increase over the original model and most of you bought the original.

Now at 4K we're looking at a 29% increase over the 2080 Ti and 71% over the 2080. Those are some pretty solid gains. It also means whereas the 2080 Ti averaged 135 fps the 3080 saw 1% lows of 152 fps, providing a better experience for high refresh rate gaming at 4K.

Next up we have F1 2020 and here we're seeing what has become a fairly typical 30-ish % boost over the 2080 Ti at 1440p, this time it's a 29% performance uplift to be exact. That meant the RTX 3080 was 57% faster than the vanilla 2080, so another solid performance uplift there.

Once again we see the margins grow a little at 4K and now the RTX 3080 is 36% faster than the 2080 Ti and 72% faster than the 2080, which is far more significant and much closer to the 80% that's been put out there since the announcement.
It's also worth noting that we're talking about 129 fps on average at 4K, that's staggering performance.

Moving on to Gears 5, we see "mild" performance gains at 1440p. An 18% boost from the 2080 Ti and 37% over the standard 2080. It will depend on your perspective but for this title, we're talking about a 34% improvement over the 3+ year-old GTX 1080 Ti which also sold for $700.

Again increasing the resolution to 4K helps widening the gap and now the RTX 3080 is 47% faster than the GTX 1080 Ti.

This time we're looking at a 33% performance uplift for the RTX 3080 over the 2080 Ti at 1440p, so that's one of the better performance gains we've seen at this resolution so far.
It also means the new Ampere GPU was 76% faster than the GTX 1080 Ti which is a significant performance uplift and we also saw an almost 70% increase over the RTX 2080, so we're very impressed with these results.

And of course, they only get better at 4K.
The RTX 3080 was a whopping 43% faster than the 2080 Ti, a massive performance uplift. It's also 83% faster than the 2080 and 92% faster than the 1080 Ti. Those are some of the best margins we've seen so far and certainly appear to be a best case scenario for the RTX 3080.

With Assassin's Creed Odyssey we're back to milder gains at 1440p. The RTX 3080 leads the 2080 Ti by a 25% margin and the 1080 Ti and 2080 by 42%. We know it sounds strange to say "just 42%" but remember the 1080 Ti cost the same amount as the 3080 when released 3.5 years ago.

At 4K, the RTX 3080 provides a 35% performance bump over the 2080 Ti and it was 51% faster than the 1080 Ti and 2080.

With no help from dynamic resolution scaling, the RTX 3080 pumped out 190 fps on average at 1440p in World War Z using the maximum in-game quality settings.
That's a stunning frame rate, though only a ~17% boost over the 2080 Ti and 42% over the 2080. We should note that the 3950X does create a small bottleneck in WWZ at 1440p, however the margins are virtually identical on the Core i9-10900K, moving by a few percent in the 3080's favor.

Moving to 4K shows the RTX 3080's prowess, it's now 34% faster at 4K than the 2080 Ti which is a massive improvement.

Next up we have Metro Exodus and the 3950X does become a problem in this title. This is a rare instance where the Ryzen CPU heavily limits performance at 1440p and as a result the RTX 3080 suffers. That's still a 25% boost over the RTX 2080, but let's see what happens at 4K...

At 4K we're no longer CPU limited and there is a 35% uplift over the 2080 Ti and 70% over the 2080.

Moving on to Resident Evil 3, we see an impressive 196 fps average from the RTX 3080 when using the best visual quality settings. That meant it was 31% faster than the 2080 Ti and 66% faster than both the GTX 1080 Ti and RTX 2080.

Jumping up to the 4K resolution and we're seeing just over 100 fps on average for a 30% boost over the 2080 Ti and a massive 76% improvement over the RTX 2080 and GTX 1080 Ti

Doom Eternal has been heavily touted by Nvidia to show off RTX 3080 performance and you'll see why once we move to the 4K testing. At 1440p the results aren't overly impressive as the 3080 is ~20% faster than the 2080 Ti and 51% faster than the 2080. Again, 50% remains an impressive gain.
Now moving to 4K we see some interesting stuff using the 'Ultra Nightmare' preset, which in our test sees 9GB of VRAM used.

Here the 3080 was 35% faster than the 2080 Ti, but quite incredibly 115% faster than the 2080. Also it was 93% faster than the 1080 Ti which does well here relative to the 2080 thanks to the extra VRAM.
This particular test is why many are expecting/claiming up to 100% performance gains over the 2080 after seeing Digital Foundry's Nvidia promo video. The data is accurate, but without more information can be somewhat misleading.
And here is more information. By leaving all other options on 'Ultra Nightmare' with the exception of texture pool size, which we dropped to 'Ultra' reducing VRAM usage to 7GB, this is what we find...

There is no change in performance with GPUs packing 10GB or more VRAM, but for those with 8GB like the RTX 2080, we're seeing a 26% performance uplift and that means the 3080 is now 70% faster, not 115% faster.
We'll discuss this further, but for now let's move on to Wolfenstein: Youngblood.

Starting with the 1440p data we see that the RTX 3080 is good for 242 fps on average as it boosted performance over the 2080 Ti by a 22% margin and 55% over the 2080. Fairly typical gains there for 1440p.

Now at 4K we're looking at 142 fps on average with the 3080 which is extremely impressive, just 22% faster than the 2080 Ti, but 60% faster than the 2080 which is a pretty solid gain.

Finally we have Hitman 2 results and this is another rare instance where the Ryzen 9 3950X limits performance at 1440p and as a result the RTX 3080 is just 5% faster than the 2080 Ti. We also tested using the Core i9-10900K and with the Intel CPU the 3080 was marginally faster (10%) at this resolution.

Pumping the resolution up to 4K means we're back to a GPU limitation and the RTX 3080 performs 29% faster than the 2080 Ti and 69% faster than the 2080. Once more we can see the Ampere GPU come to life at the 4K resolution.
Performance Summary
There is no escaping fact the RTX 3080 is very fast, particularly when compared to the 2080 GPU it replaces, but it will also need a capable system to go along all this power. We tested many different titles and the margins were a bit all over the place, so let's have a look at the 14 game average for all the GPUs tested and then we'll do a few head to heads looking at individual titles.
14 Game Average at 1440p

On average, the RTX 3080 is 21% faster than the 2080 Ti and 49% faster than the 2080 at 1440p. It's also 58% faster than the 1080 Ti and 113% faster than the vanilla 1080. So we're looking at roughly a 50% performance boost at the $700 price point after two years, at least for 1440p gaming.
14 Game Average at 4K

Playing games at 4K takes full advantage of what the GeForce RTX 3080 is capable of. At this resolution, it's 32% faster than the 2080 Ti, 71% faster than the RTX 2080 and 77% faster than the GTX 1080 Ti, on average. Those are far more impressive gains and makes Ampere a tremendous replacement at the same price point.
GeForce RTX 3080 vs 2080 Ti: 14 Game Average at 1440p

Here's a look at the margins on a per game basis and please note due to the way this data is calculated there can be a small discrepancy in the totals when compared to the previous graphs. As before, the 3080 is 21% faster than the 2080 Ti at 1440p and here we see performance gains range anywhere from a few percent right up to 33%.
GeForce RTX 3080 vs 2080 Ti: 14 Game Average at 4K

We see far more predictable margins at 4K and this has little to do with the CPU used and much more to do with the Ampere architecture – we'll discuss this in better detail in the conclusion.
What we see here are gains of at least 22%, with the biggest margin seen in Horizon Zero Dawn where the RTX 3080 was up to 43% faster than the prev-gen 2080 Ti.
GeForce RTX 3080 vs RTX 2080: 14 Game Average at 1440p

At 1440p we see less predictable gains even when compared to the RTX 2080. It's clear however the 3080 is the more powerful GPU with margins going from 25% faster and then as big as 69%.
GeForce RTX 3080 vs RTX 2080: 14 Game Average at 4K

At 4K, the new Ampere GPU can be anywhere from 51 to 83% faster. Looking at this data you could simply say the RTX 3080 is about 70% faster when gaming at 4K.
Also note that we used the 7GB VRAM data for Doom here as the 115% gain using the Ultra Nightmare preset was an outlier and not indicative of raw GPU performance.
Power Consumption
Now let's take a look at power consumption, starting with our total system power draw, so literally everything in the PC is being measured here.
This is useful for a few reasons: first, it lets you know roughly what kind of power supply you'd need for a certain configuration. It also lets you know just how much difference in power draw there is between say the 2080 Ti and 3080 when factoring in the entire gaming system.

We're looking at a big 21% increase in total system usage as the RTX 3080 pushes our test system up to 523 watts. That's beyond what we saw with the GTX 1080 Ti and Vega 64 to name two power hungry graphics cards. So the RTX 3080 does suck down a lot of power to output all that raw performance.
Using Nvidia's PCAT (Power Capture Analysis Tool) we can accurately measure the power draw of the graphics card alone, including what it draws from the PCIe power connectors and the PCIe slot. It's a seriously impressive tool and kudos go to Nvidia for providing it to testers, that's very cool of them.

Here we can see that the RTX 3080 consumes 25% more power than the 2080 Ti and 29% more than the RTX 2080. And while that's a lot of power, technically it is still more efficient. See below:

Here we see that the RTX 3080 offers the most performance per watt, so you can't deny its efficiency. This is a first generation node shrink GPU, meaning that if history serves any indication, in the future Nvidia will likely be able to improve upon this 8% generational efficiency gain.
For testing thermal performance of the RTX 3080 Founders Edition, we installed it in our Corsair Obsidian 500D test system and let it run for an hour in F1 2020 while maintaining a room temperature of 21C. After that point the GPU peaked at just 77C and maintained a core clock speed of around 1830 MHz.

This had the graphics card fans spinning at up to 1900 RPM where they could be heard but we're not overly loud. We don't have any sound measurements right now, but we found the FE model to perform well and given the performance and power draw we were pleasantly surprised. We'll say the card does tend to squeal a lot when pumping out over 300 fps, so if you are sensitive to coil whine, a frame cap will be in order.
Cost Per Frame
One key metric we like to use is cost per frame and at $700 the RTX 3080 will be delivering the goods, even at 1440p.
You all know we liked the value of the Radeon 5700 XT and here we're seeing that level of value despite offering a 64% performance boost. The RTX 3080 can roughly match the cost per frame of the Navi GPU and it's also 33% cheaper per frame when compared to the RTX 2080.

However, if we look at the 4K performance, the cost per frame gets even better, much better.
Here the RTX 3080 is the most affordable graphics card released in the last 4 years when it comes to cost per frame (value), beating even the base model RX 5700 which is almost ridiculous.

DLSS / Ray Tracing
We plan to follow up with a more detailed analysis of DLSS and ray tracing on Ampere on a dedicated article, but for the time being, here's a quick look at both in Wolfenstein Youngblood.
When enabling Ray Tracing the RTX 3080 suffers a 38% performance hit which is better than the 46% performance hit the 2080 Ti suffers. Then if we enable DLSS with ray tracing the 3080 drops just 20% of its original performance which is marginally better than the 25% drop seen with the 2080 Ti. The deltas are not that much different, the RTX 3080 is just faster to begin with.

Using only DLSS sees a 16% performance boost in the RTX 2080. So let's see if things change much at 4K.

Here the RTX 3080 was good for 142 fps when running at the native resolution without any RTX features enabled. Enabling ray tracing reduces performance by 41% to 84 fps on average, which is reasonable performance, but still a massive fps drop. For comparison the RTX 2080 Ti saw a 49% drop.
When using DLSS, the 2080 Ti sees an 18% performance boost whereas the 3080 sees a 23% jump. At least in this game implementation, it looks like the 3080 is faster at stuff like ray tracing because it's a faster GPU and not necessarily because the 2nd-gen RT cores are making a difference. We'll test more games in the weeks to come, of course.
Testing with AMD vs. Intel CPUs
There are a number of reasons why we switched to a Ryzen CPU for game testing moving forward (this was discussed and outlined in this article). But the most important one was that the change wouldn't influence results or manipulate numbers in charts like our cost per frame summary.
Looking at how the 3950X and 10900K compare with the RTX 3080 and 2080 Ti at 1440p across our 14 game sample, the 10900K was 4% faster with the 2080 Ti and 6% faster with the 3080, that 2% margin is not going to skew the results.

Then at 4K we can appreciate that there's no difference at all between the two CPUs as both pushed the RTX 3080 to the same 108 fps average.

What We Learned
This is only the beginning of the journey for Ampere GPUs and RTX 30 series graphics cards, but there you have it, that's the new GeForce RTX 3080 in a nutshell. We've got many more tests that we want to show you and many more we want to run, but for now you should have a pretty good idea of what's on offer.
A big 70% performance jump over the RTX 2080 at 4K is impressive, and a huge improvement in cost per frame, so that's a job well done by Nvidia.
Now, that big jump won't be experienced across the board, or more specifically, we saw less consistent improvements at 1440p where the RTX 3080 could beat the 2080 by as much as 70%, but also by as little as 25% (for a ~50% performance gain on average). That 50% boost is still great to see even though in terms of raw performance at the $700 price point we can look two years back to the RTX 2080 release or 3.5 years since the GTX 1080 Ti was released.

We've looked deeper at the RTX 3080's performance at 1440p, so we want to comment on that. As far as we can tell, CPU bottlenecking alone is not the explanation. The reason comes down to Ampere's architecture and the change to the SM configuration that we mentioned in the introduction. The 2x FP32 design can only be fully utilized at 4K and beyond. This is because at 4K the portion of the render time per frame is heavier on FP32 shaders. At lower resolutions like 1440p, the vertice and triangle load is identical to what we see at 4K, but at the higher resolution pixel shaders and compute effect shaders are more intensive and take longer and therefore can fill the SMs FP32 ALUs better.
We often see high performance GPUs better utilized at higher resolutions for similar reasons, so that in itself isn't unusual. Higher resolutions always do a better job of putting core-heavy GPUs to work, and they also help minimize other system bottlenecks. The 2080 Ti, for example, extends its lead over the 2080 at 4K, going from 23% faster at 1440p to 28% faster at 4K and that's with the lower quality textures in Doom, where memory capacity is not a factor. We're talking about a small 5% discrepancy, the scaling at 1440p and 4K looks very similar, and the 3950X can also be blamed for a small part of that difference. However with the RTX 3080 we're talking about a 21% margin over the 2080 Ti at 1440p and then a much larger 32% margin at 1440p (again, VRAM plays no role in the comparison). And our explanation here is that Ampere is a compute heavy, datacenter and AI optimized architecture that goes beyond gaming needs.

Current RTX 2080 owners targeting high-refresh rates at 1440p will see a 50% performance boost, which is still pretty sweet. The fact that the RTX 3080 simply excels at 4K gaming could be seen as the cherry on top. Doesn't necessarily future proof the GPU however, as Nvidia paired it with 10GB of VRAM which might prove insufficient in a year or two, though PCIe 4.0 will be a lot more useful in mitigating those performance loses in modern platforms.
In the current market the GeForce RTX 3080 is an excellent value product.
We only have to look at the cost per frame data to see that the RTX 3080 is a massive improvement over the RTX 2080 in terms value, it's even better value than the RTX 2060 and comparable to the 5700 XT which not everyone was fond of. In the current market the GeForce RTX 3080 is an excellent value product, one of those rare instances where a high-end product is also a great value. This may be helped by an overpriced GeForce 20 series (we called this one at launch), but the fact is, those RTX boards still flew off shelves no matter what.
In the coming months we're bound to see more of Ampere, but also some competition from AMD and eventually Intel. We're looking forward to that, though clearly Nvidia has upped the ante on this generation. Arguably Nvidia has given AMD an opportunity to strike with a gaming focused architecture, but we'll just have to wait and see on that one.
As for ray tracing and DLSS, our opinion on that hasn't changed. The technology is great, and we're glad it hasn't been used as key selling points of Ampere, it's now just a nice bonus and of course, it will matter more once more games bring proper support for them.
Bottom line, we're very pleased with what the GeForce RTX 3080 delivers at the $700 price point, and it's a hell of a lot better than what we got last generation. I personally would have not bought an RTX 2080, but I would buy an RTX 3080.