This is not the first time we are reviewing or testing AMD's Radeon RX 7900 GRE. That actually happened about six months ago, but technically this is still a new GPU release... because now you can actually buy it. Around mid-last year, AMD quietly released the 7900 GRE as a Chinese exclusive for what amounted to $650.
For those curious, the unique name is a nod to Chinese culture as 2023 marked the year of the Rabbit, that's why it's called the "Golden Rabbit Edition." The Radeon GRE was intended to be a China-only release, and it was for the most part. However, an Australian PC retailer managed to offer it with one of their pre-built systems, and as you might have guessed, we purchased that system to gain access to this GPU.

So, as the proud owners of an AMD reference-designed 7900 GRE, we began benchmarking and provided that review six months ago. Since then, much has changed. Several new Radeon GPUs have been released, making the $650 GRE a really bad deal.
But now, AMD has officially reduced the card's MSRP to $550 and, for reasons unknown to us, has now released it globally. If you're interested and you missed our initial review, what exactly is the 7900 GRE? The GPU is essentially a hybrid 7800 XT with a configuration that increases cores in 33%, however introduces a bottleneck in the memory subsystem.

Like the Radeon 7800 XT, the 7900 GRE is equipped with a 16 MB VRAM buffer and a 256-bit wide memory bus, but it utilizes slightly slower 18 Gbps memory, whereas the 7800 XT uses 19.5 Gbps memory. That means the GRE's bandwidth is reduced by 8%, presenting an unusual configuration with 33% more cores but 8% less memory bandwidth.
Moreover, the cores are clocked 8% lower, and there's a 16% reduction in Infinity Cache bandwidth. It will be interesting to see how the 7800 XT and 7900 GRE compare, especially considering the GRE's MSRP is just $50 more, forming a strange lineup. It will also be interesting to compare the GRE against the RTX 4070 Super, which is currently priced at $600, making it $50 more expensive than the GRE. Those direct comparisons will be made.

What's also new in this review, compared to our coverage six months ago, is that we now have models from board partners for testing, including the Asrock Steel Legend, Gigabyte Gaming OC, PowerColor Hellhound, and Sapphire Nitro+. Towards the end of this review, we will examine the operating behavior of all four models.
For testing, we're utilizing our Ryzen 7 7800X3D test system with 32 GB of DDR5-6000 memory, and the latest display drivers. All data has been validated and updated for this review, and all GPUs have been tested at their base specifications. This approach ensures consistency across all models tested. We've tested 12 games in total but will focus on individual results for a few before examining the 12-game average and, of course, the cost per frame data. Let's dive into the findings…
Benchmarks
First up, we have Cyberpunk 2077, where the GRE managed an average of 97 fps, matching the RTX 4070 Super exactly, despite being only 2% faster than the 7800 XT. This represents a modest improvement for an additional $50.
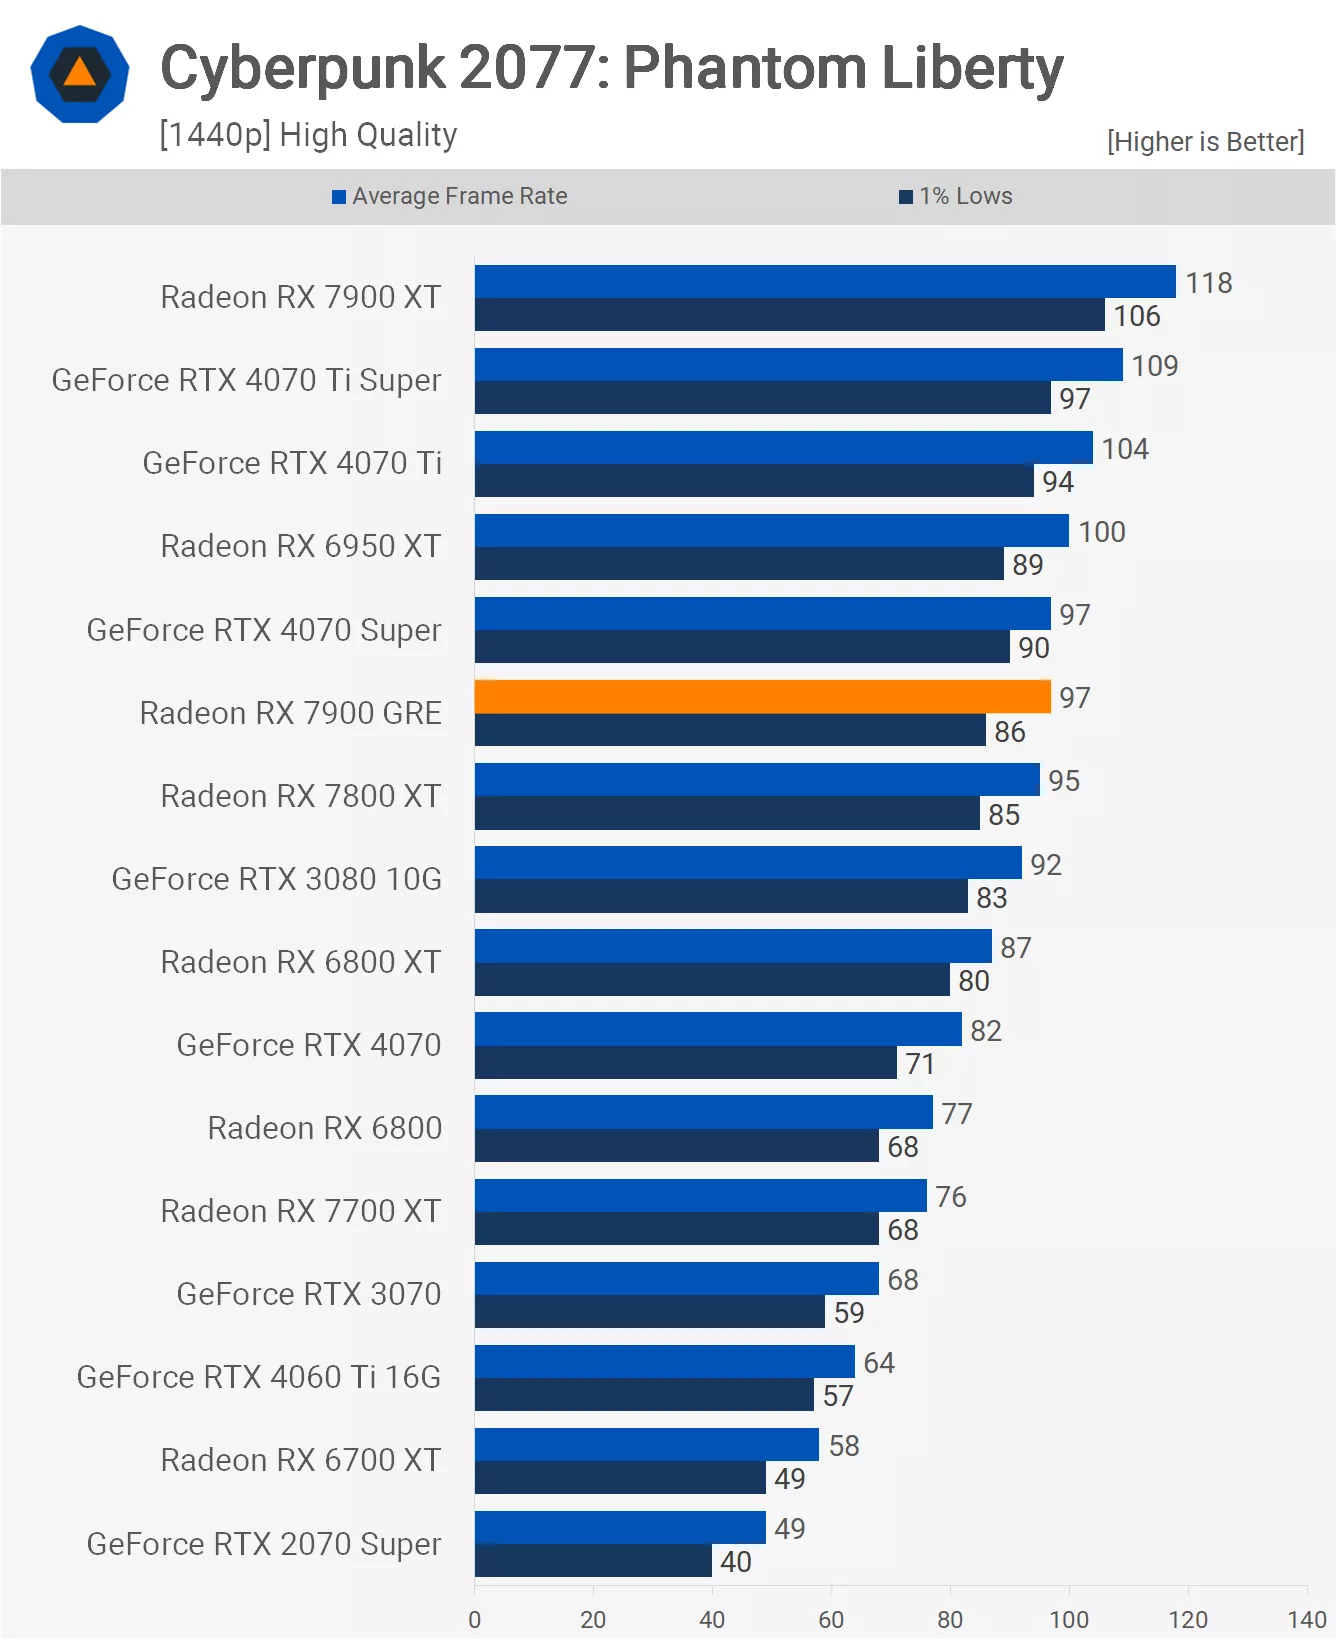

At 4K, the GRE continued to match the 4070 Super while being just 2% faster than the 7800 XT. We hope to see more significant gains in some of the other games we've tested.

In Starfield, at 1440p, the GRE's performance was slightly disappointing, being only 2% faster than the 7800 XT and 7% slower than the 4070 Super.

At 4K, performance was identical to the 7800 XT, making it 9% slower than the 4070 Super.

For The Last of Us Part I, the GRE only managed to match the 7800 XT, resulting in it being 6% slower than the 4070 Super at 1440p.

Moving to 4K, the GRE was only 2% ahead of the 7800 XT, while it was just 2% slower than the 4070 Super.

Dying Light 2 presents more interesting results: at 1440p, the GRE was 11% faster than the 7800 XT. While not a massive margin given its 33% more cores, it's an improvement over the previous titles.

At 4K, the performance remained 11% faster than the 7800 XT, though 7% slower than the 4070 Super.
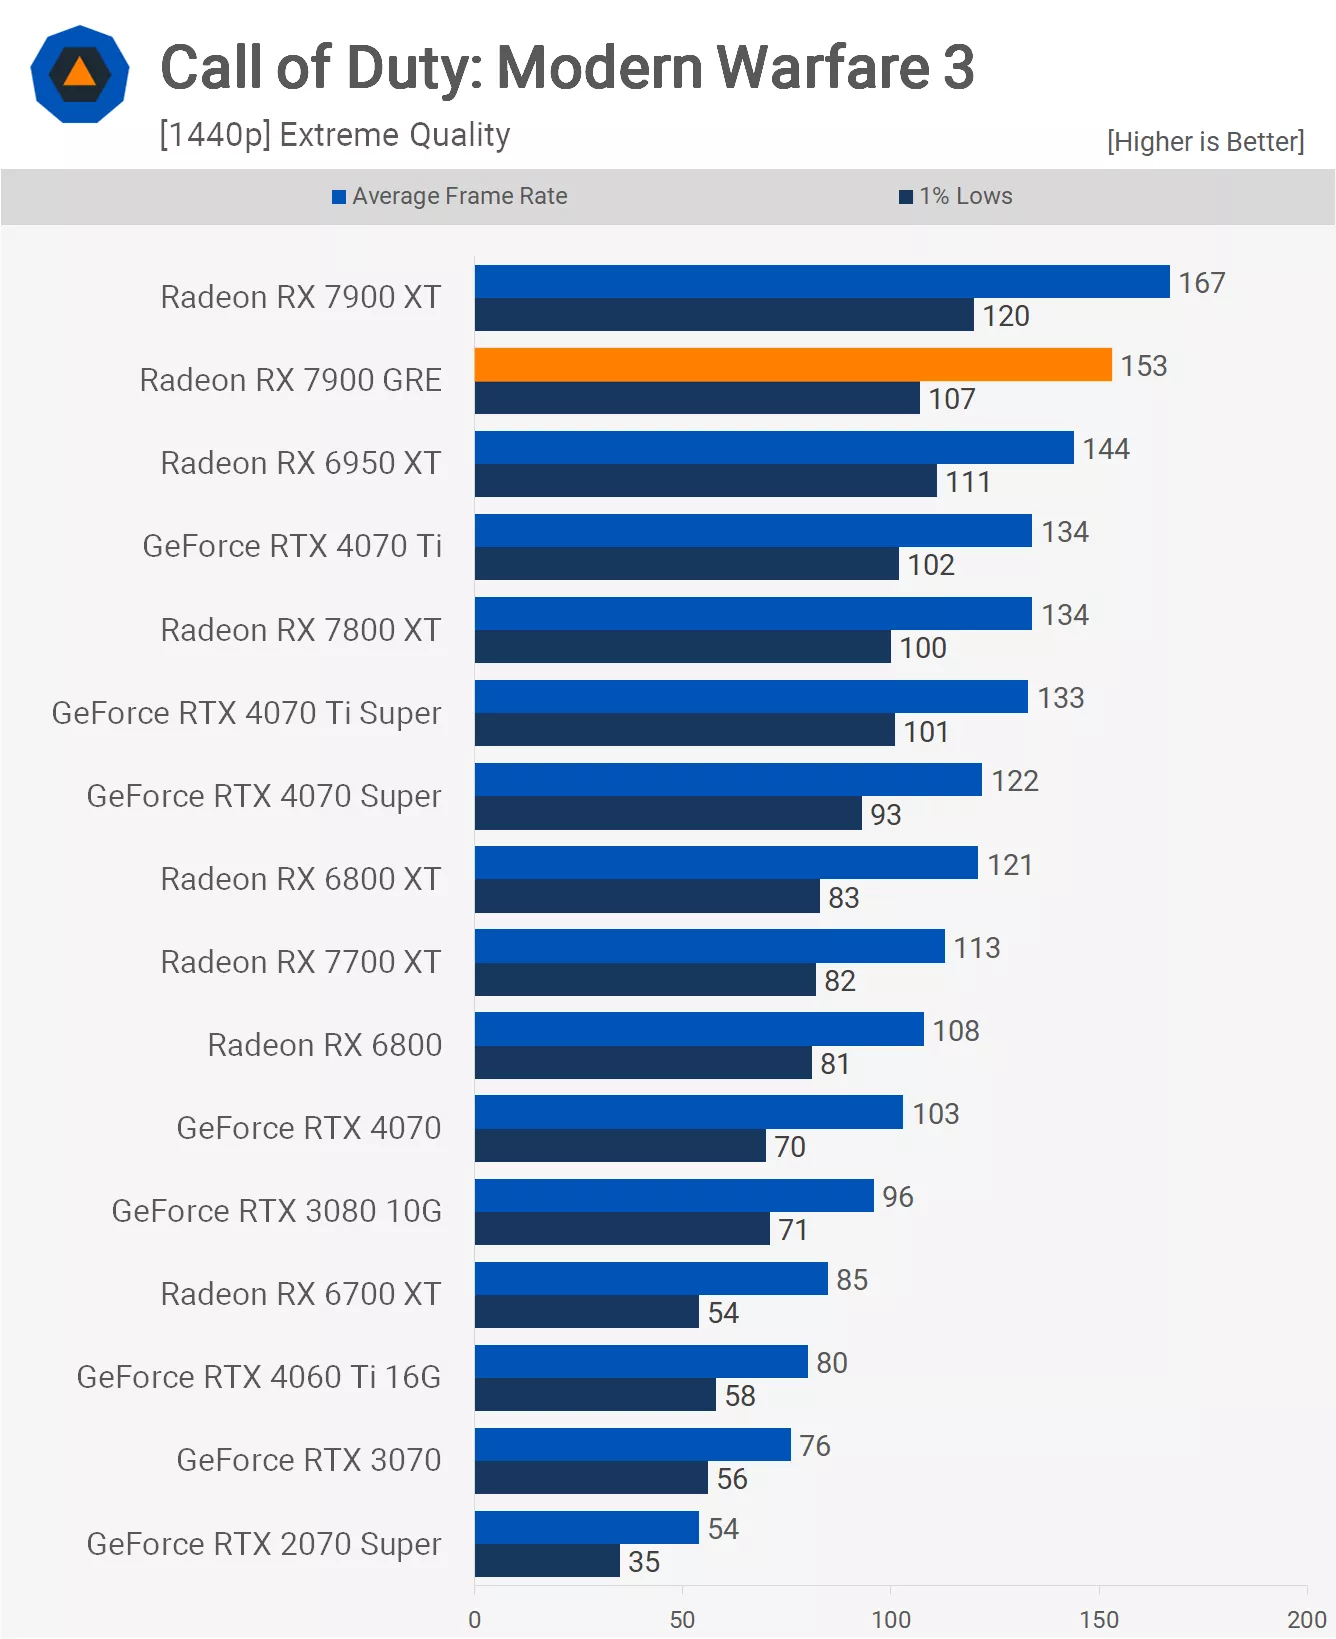
The GRE performed even better in Modern Warfare 3 at 1440p, being 14% faster than the 7800 XT and a significant 25% faster than the 4070 Super, highlighting this title's preference for Radeon GPUs.

At 4K, it was 21% faster than the 7800 XT and 31% faster than the 4070 Super, even outpacing the 4070 Ti Super by 16%.

In Alan Wake 2, the GRE closely resembled the performance of the 7800 XT. At 1440p, it was 3% faster, averaging 63 fps, which also made it 6% slower than the 4070 Super.

The pattern continued at 4K, with the GRE being 3% faster than the 7800 XT and 6% slower than the 4070 Super.

Lastly, looking at Resident Evil 4's rasterization performance at 1440p, the GRE surpassed the 7800 XT by an 8% margin, a notable improvement given the trend of the results.

This margin slightly increased to 9% at 4K, where the GRE also managed to outperform the 4070 Super, beating it by a 5% margin.
Average Performance
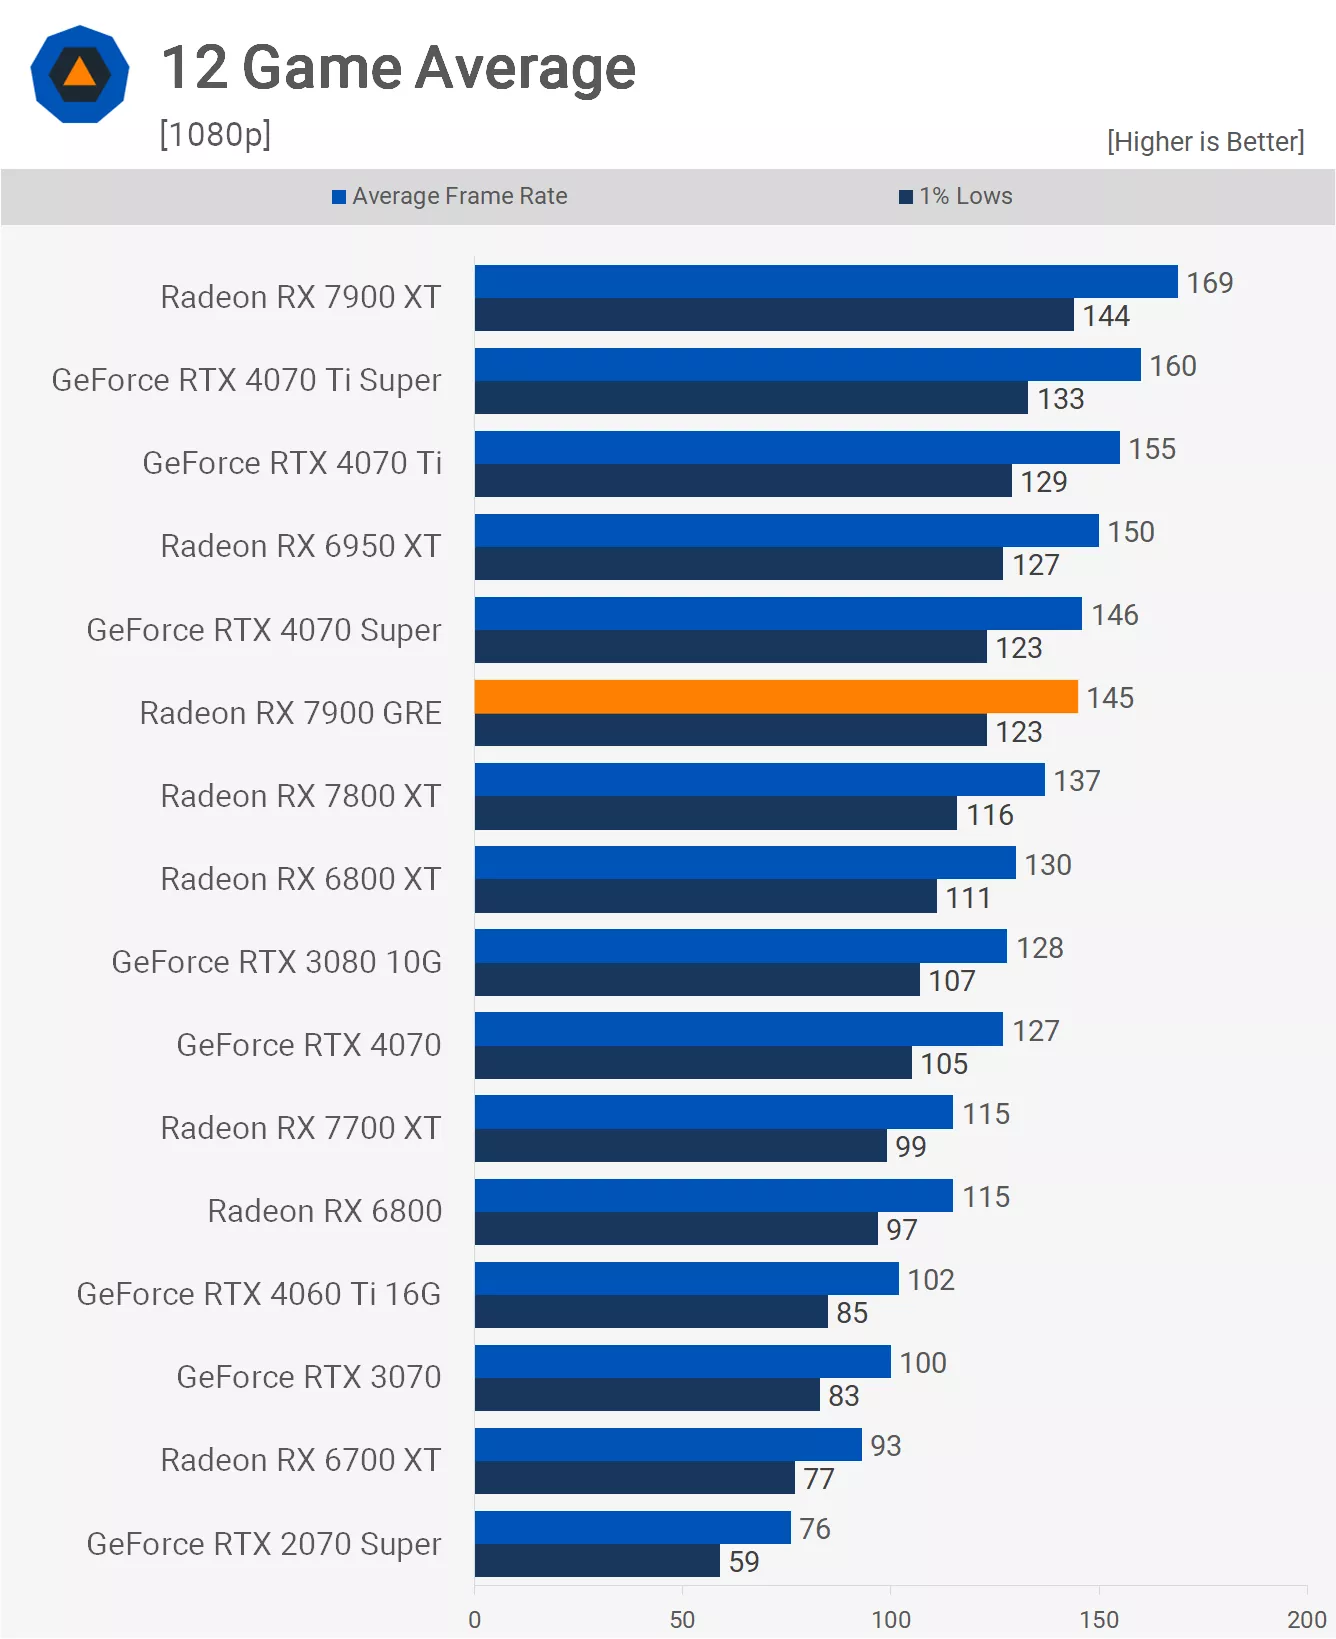
Across all 12 games tested at 1080p, the GRE was, on average, 6% faster than the 7800 XT and only 1% slower than the 4070 Super when focusing solely on rasterization performance. While these results are not outstanding, it's important to note that some 1080p outcomes may be limited by CPU performance. Therefore, we'll examine the 1440p results for a clearer picture of GPU performance.
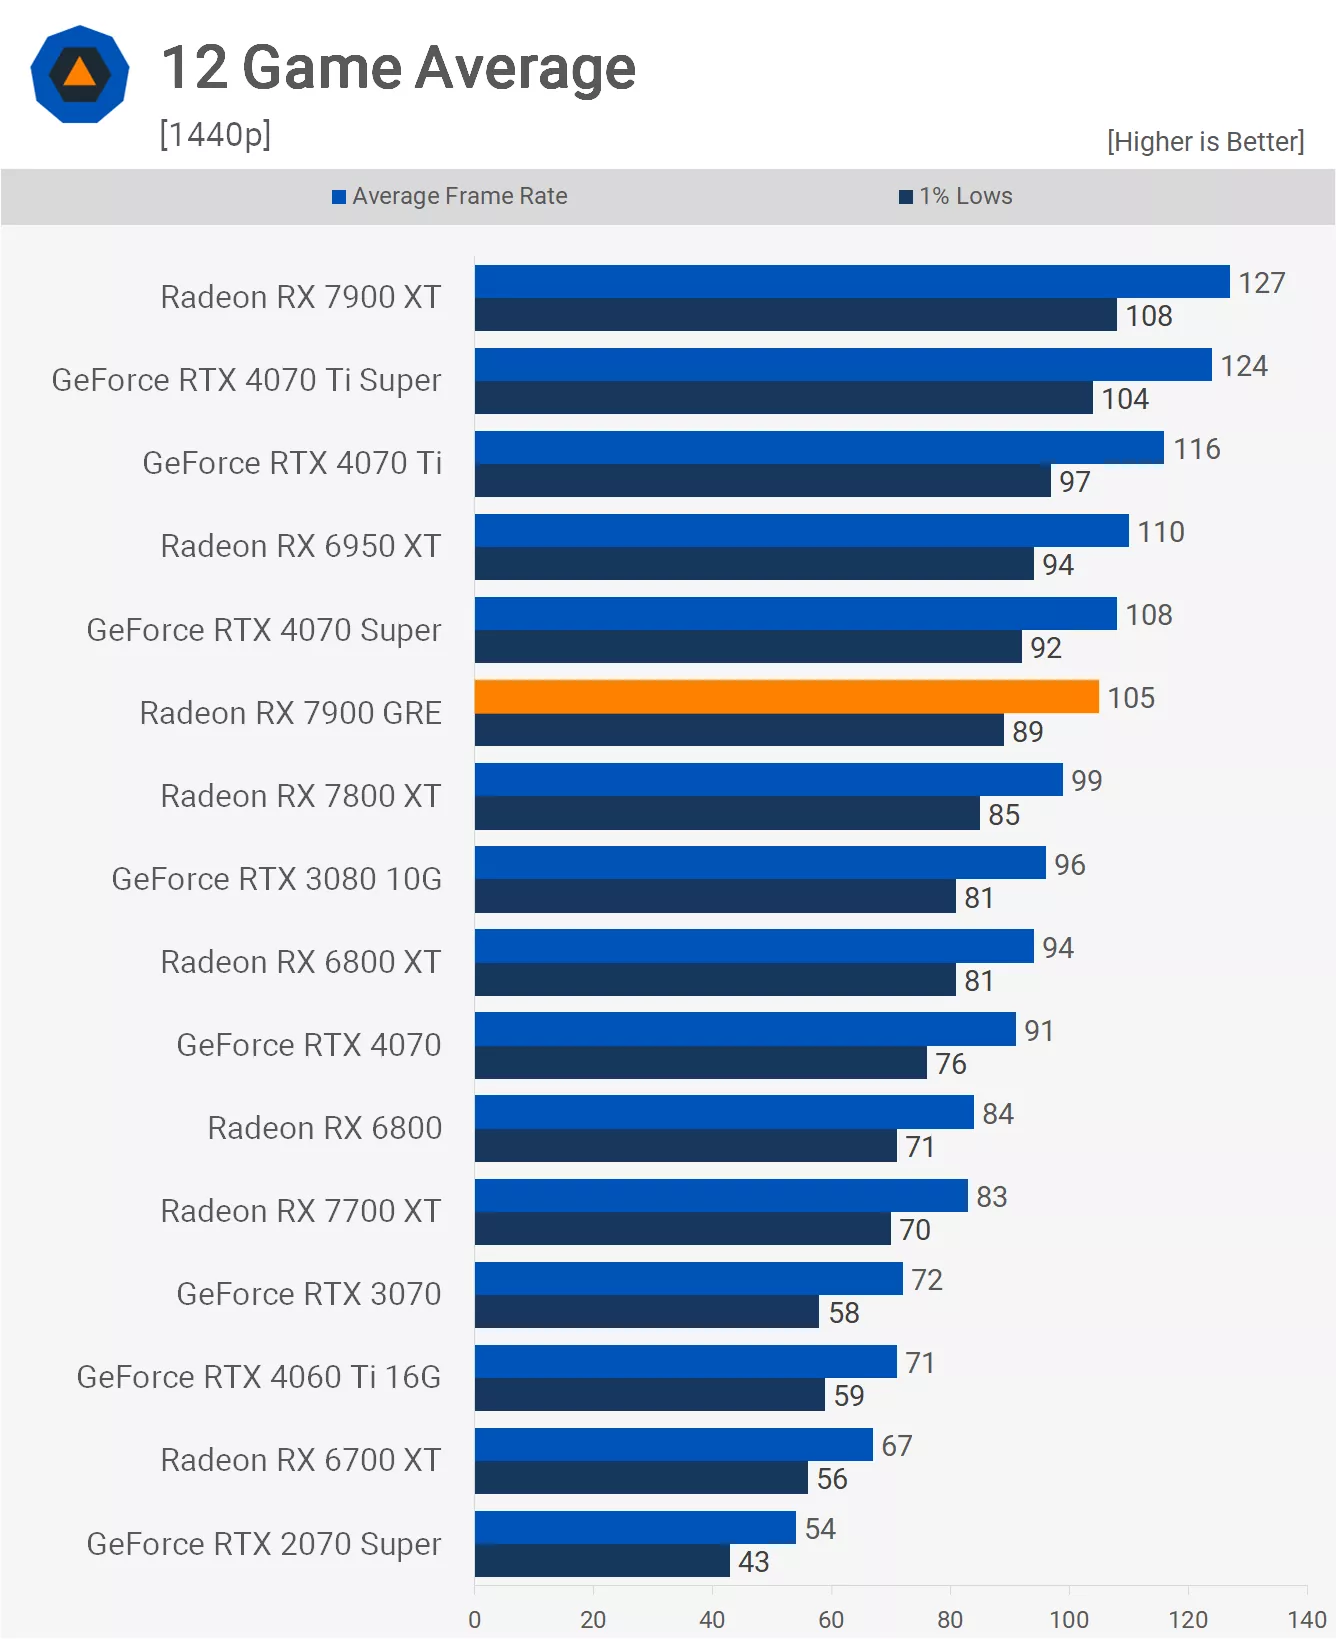
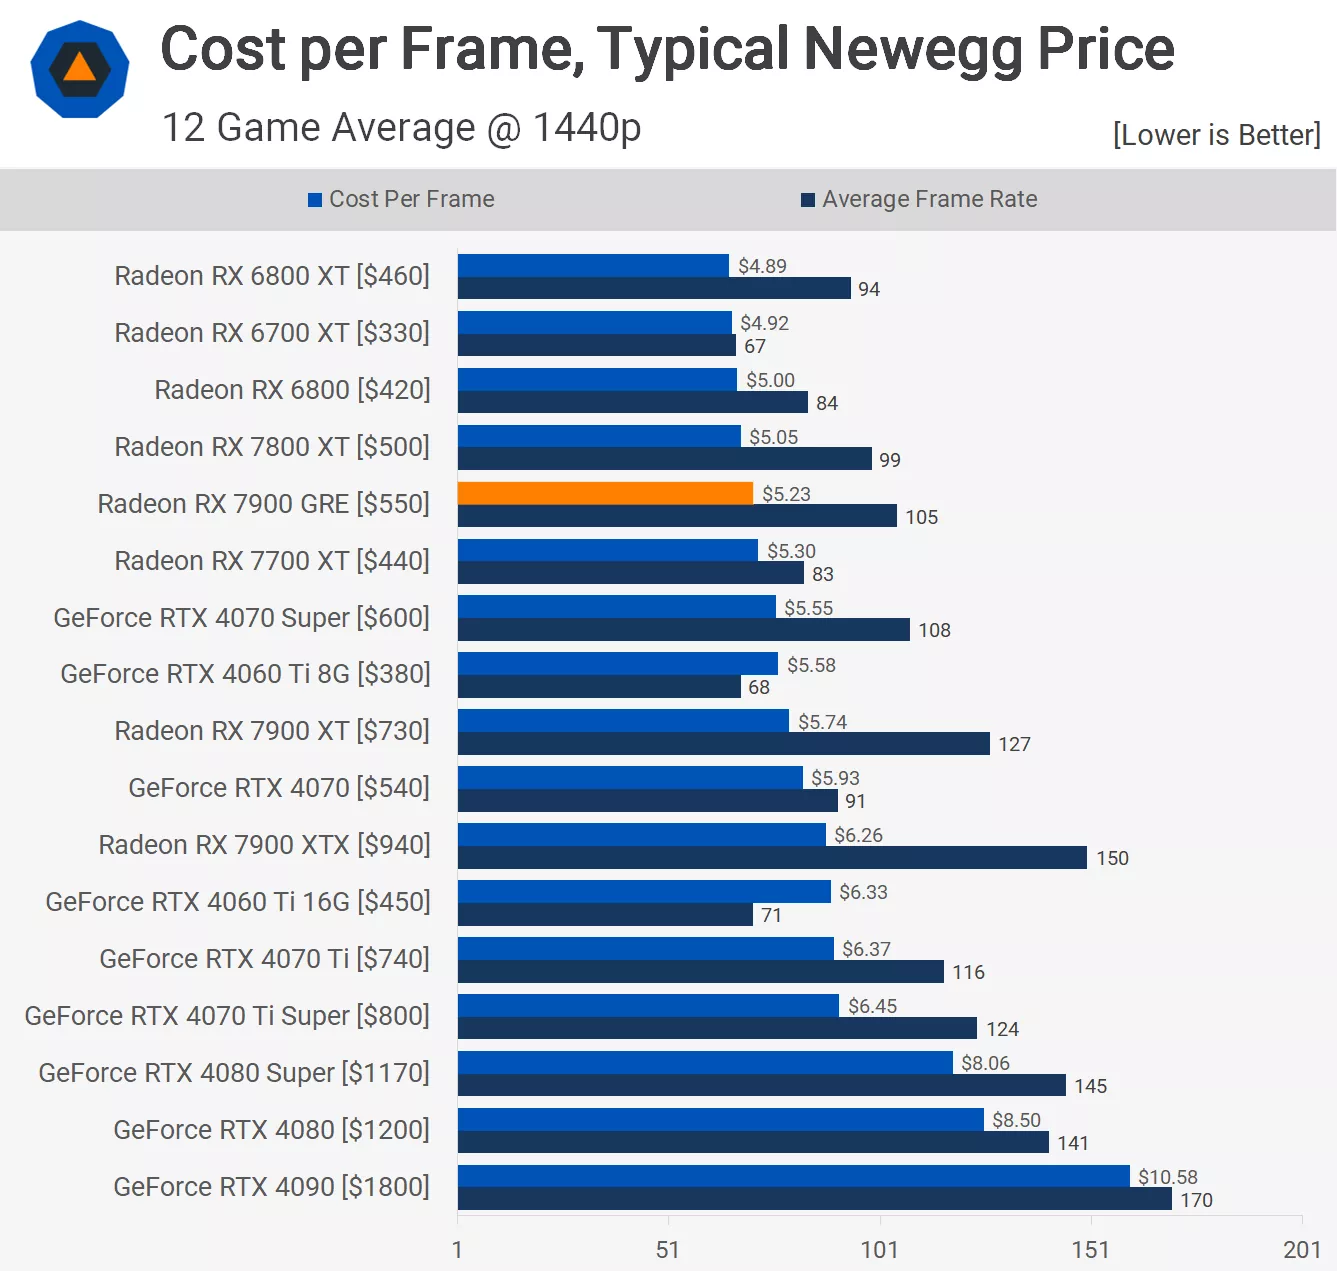
At 1440p, the GRE was still just 6% faster than the 7800 XT on average, delivering 105 fps compared to 99 fps for the more affordable model. It was also 3% slower than the 4070 Super, indicating a minimal difference. However, this places the GRE in an odd position in the market.

At 4K, the GRE managed to match the 4070 Super, despite only surpassing the 7800 XT by a 5% margin. This performance is underwhelming, considering it is supposed to be 10% more expensive. We will discuss the cost per frame in more detail shortly, but let's first review some ray tracing performance figures.
Ray Tracing Performance
In our ray tracing tests with Avatar: Frontiers of Pandora at 1440p, the GRE was 9% faster than the 7800 XT but 13% slower than the 4070 Super.
![]()

The results for Spider-Man Remastered are noteworthy, as the GRE was a significant 26% faster than the 7800 XT. Though we haven't detailed the rasterization performance for Spider-Man, the GRE was just 5% faster in those tests. Enabling ray tracing significantly benefits the GRE in this title, though it remains 11% slower than the 4070 Super, which is a more favorable comparison than with the 7800 XT.

As expected, Radeon's ray tracing performance in Cyberpunk 2077: Phantom Liberty is lacking. With an average of 39 fps at 1440p, the GRE was 11% faster than the 7800 XT but still a substantial 43% slower than the 4070 Super.

Across the 10 games tested with ray tracing enabled, the GRE was 10% faster than the 7800 XT, which is a respectable improvement. However, it was, on average, 28% slower than the 4070 Super, which is disappointing, especially considering it is priced only 8% lower. With this context, let's now examine the cost per frame data.
Cost Per Frame
When analyzing the cost per frame based on the 1440p rasterization data, we find that the GRE is actually more costly than the 7800 XT, with approximately a 4% premium per frame. It also offers just a 6% better value than the 4070 Super, placing the GRE in a challenging position.

At 4K, the situation remains similar, with the GRE being 4% more costly per frame compared to the 7800 XT and offering only slightly better value than the 7900 XT. When compared to the 4070 Super, the savings are around 8% per frame, which is favorable, but we are not convinced it's sufficient to deter gamers from choosing the competing brand.

For those interested in ray tracing performance, the GRE offers the same value as the 7800 XT, which is average. Compared to the 4070 Super, the GRE is 27% more costly per frame, making it a less attractive option for enthusiasts of ray tracing performance, who would likely prefer a GeForce GPU.
AIB Testing: Temperatures, VRM
Examining the new AIB versions of the 7900 GRE in comparison to AMD's reference model, which recorded a peak GPU hotspot temperature of 90°C, the Asrock and Sapphire models both maintained around 80°C, marking a significant improvement. They also achieved around a 7% higher clock speed, and notably, the Sapphire Nitro+ operated almost silently due to its low fan speed.

The Gigabyte Gaming OC model showcased a peak hotspot temperature of 75°C. However, its 1700 RPM fan speed meant it was audible over our case fans.
The standout performer was the PowerColor Hellhound, peaking at just 72°C at a fan speed of only 1,100 RPM, while maintaining a core clock speed of 2,140 MHz, clearly leading the pack.
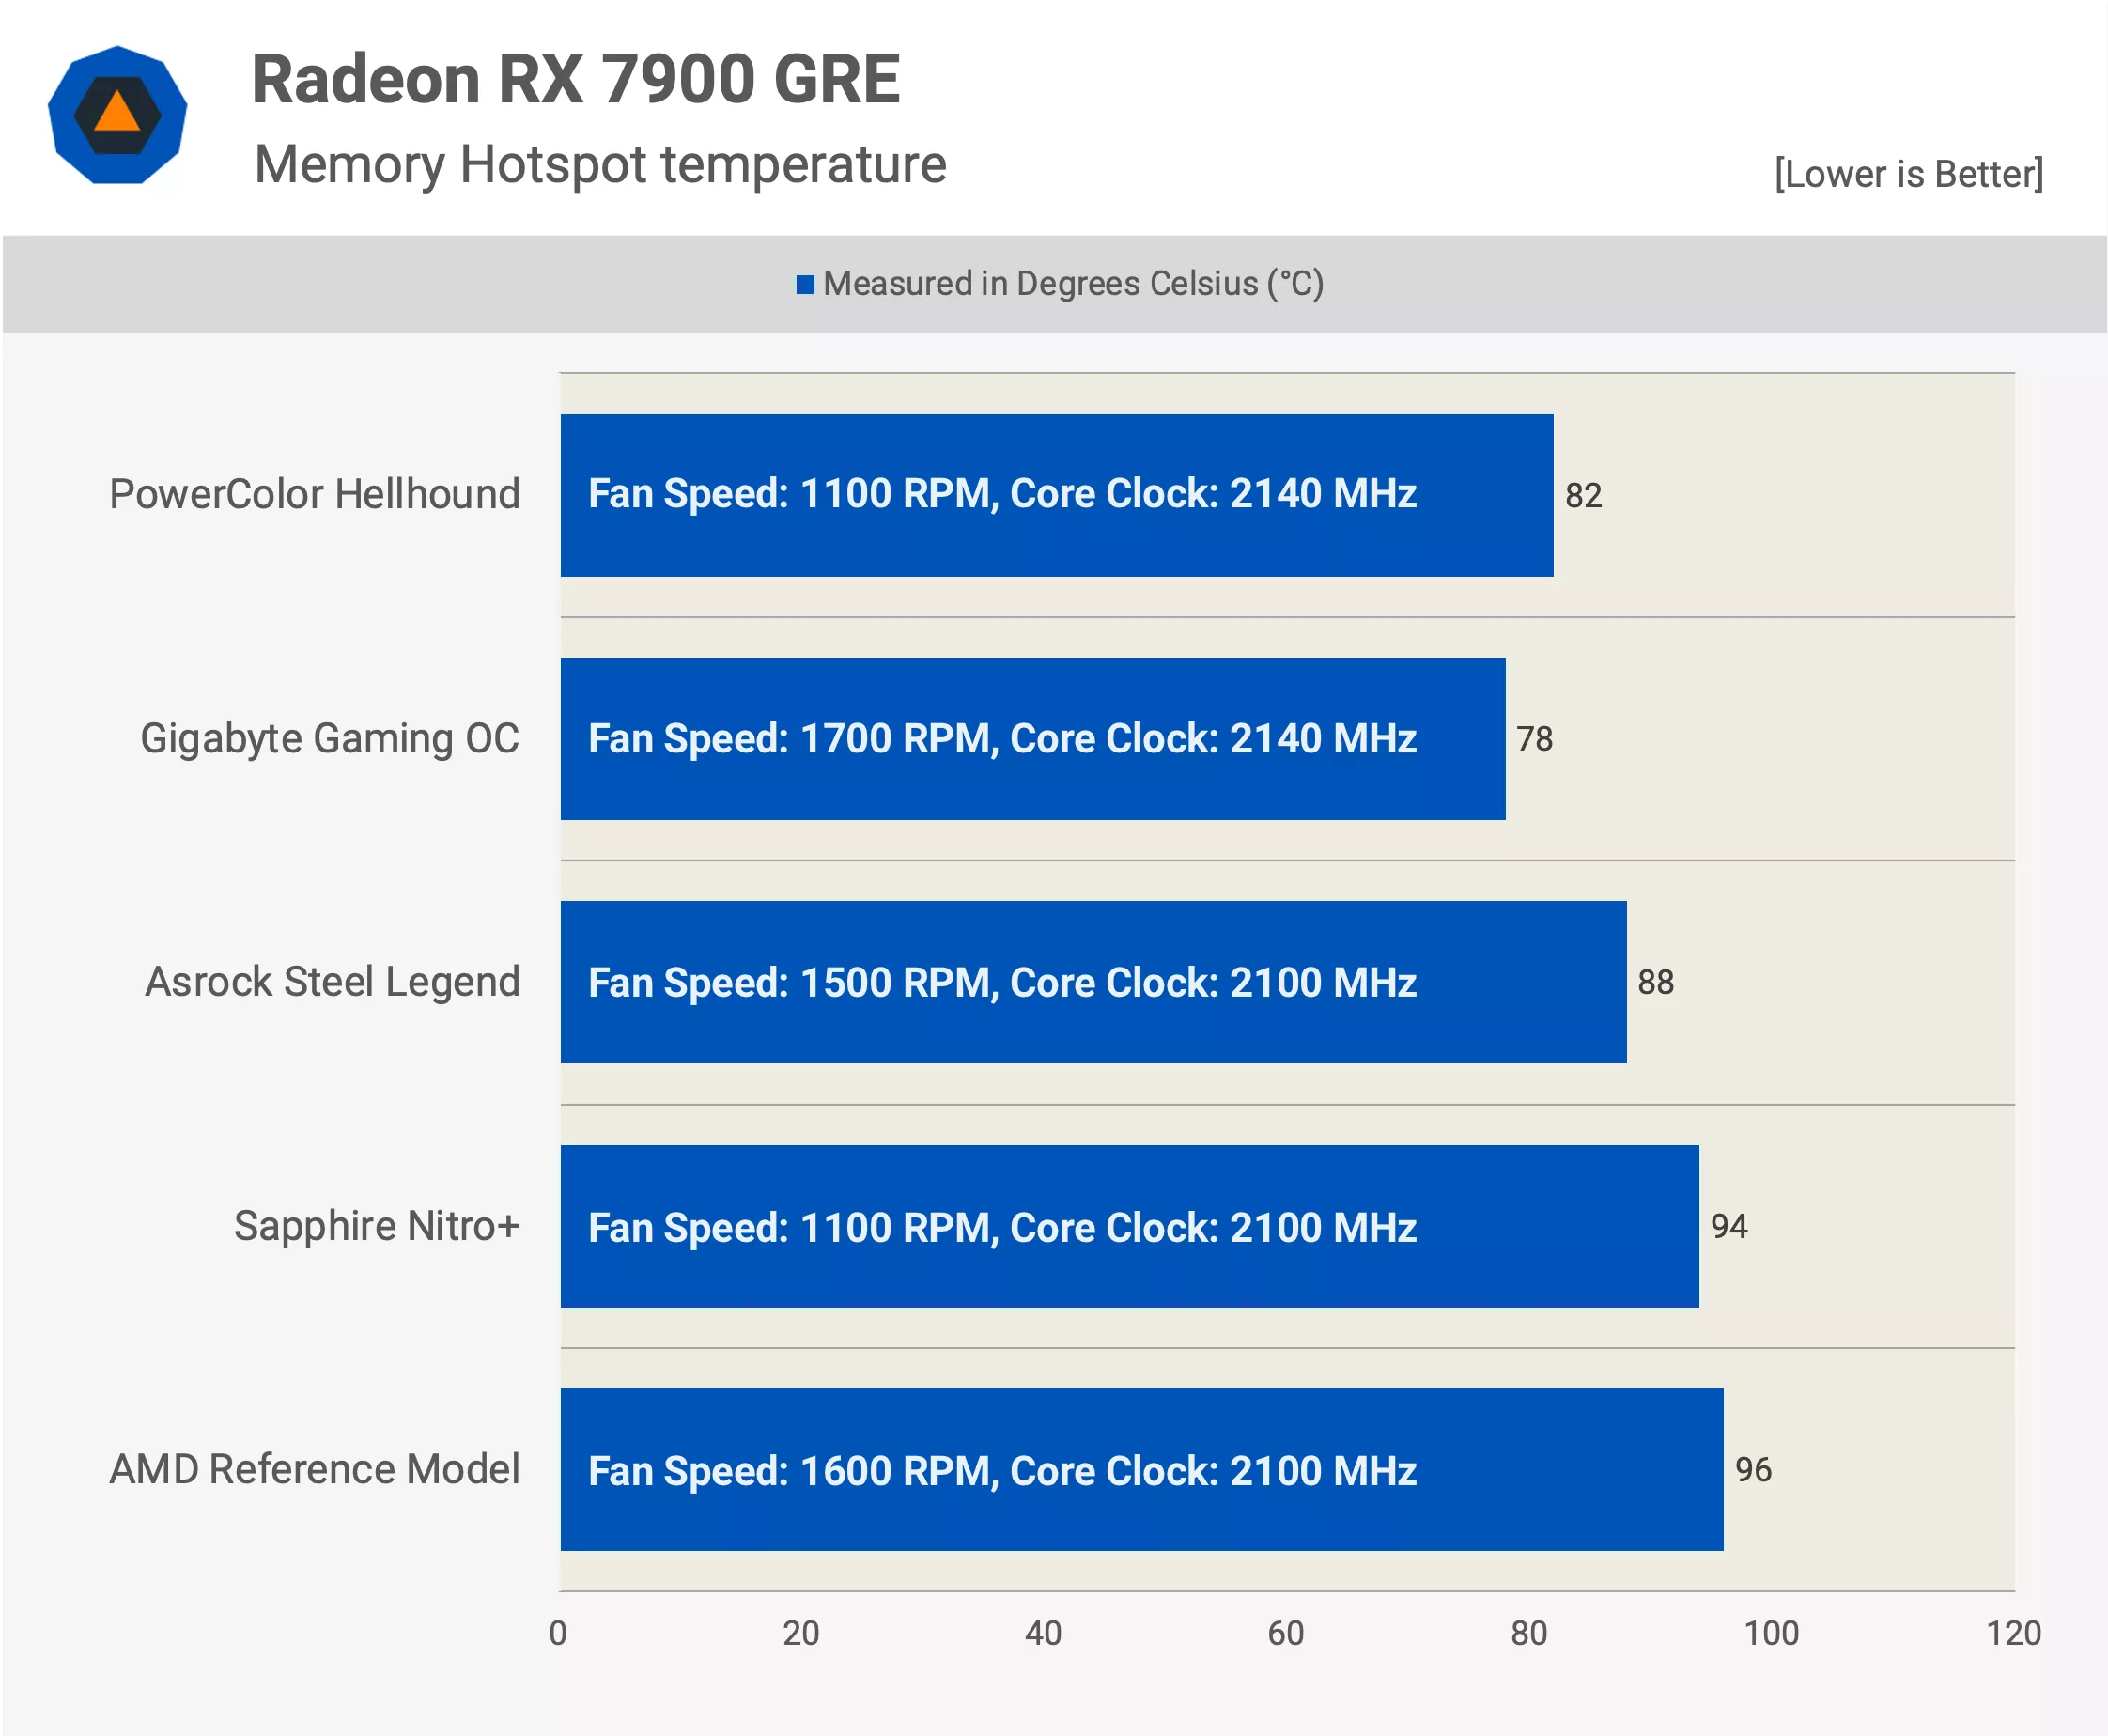
Regarding memory temperatures, the AMD reference model ran hot at 96°C, with the Sapphire Nitro+ showing a marginal improvement at 94°C, albeit with a low fan speed.
The Asrock Steel Legend recorded 88°C, placing it in the mid-tier range, while the PowerColor Hellhound and the Gigabyte Gaming OC excelled at 82°C and 78°C, respectively. The latter's higher fan speed of 1700 RPM did not detract from its top performance, making the Hellhound's result especially commendable.

Finally, for VRM temperatures, the AMD reference model was the least efficient, with a temperature of 80°C, with the Sapphire Nitro+ only slightly cooler at 79°C. The Gigabyte Gaming OC, while the loudest, achieved the coolest VRM temperature.

However, the PowerColor Hellhound's VRM temperature of 68°C, achieved with much less noise, was the most impressive, demonstrating a balance between cooling efficiency and operational noise.
What We Learned
The Radeon RX 7900 GRE has always been a bit of an odd product, and effectively re-launching it today for global consumption at $550 doesn't make it any less odd. The gap between the 7800 XT and 7900 XT has never really made sense; even today, the 7900 XT costs almost 50% more, leaving a rather large $230 gap. It would seem AMD was hoping to fill that gap with the 7900 GRE.

However, the GRE is just too similar to the 7800 XT in terms of performance and would really benefit from faster memory to fully leverage those extra cores. Speaking of which, memory overclocking is almost entirely restricted on the GRE, as AMD only allows the frequency to be increased by a maximum of 3% to 2,316 MHz, resulting in a throughput of 18.5 Gbps.
When compared to the 7800 XT, you're also getting the same 16 GB VRAM buffer, so there's nothing extra on offer with the GRE, meaning for most, the $500 7800 XT is going to offer more value.

Then, when compared to Nvidia's RTX 4070 Super, you do get an extra 4 GB of VRAM, which is nice but not necessarily useful right now, at least in the vast majority of use cases. It's not clear when 12 GB will start to become insufficient.
In terms of performance, the 4070 Super and 7900 GRE are virtually identical for rasterization, but when it comes to ray tracing, the GeForce GPU is generally far ahead. So, if you're mostly interested in RT performance, then the 4070 Super is a no-brainer. However, for primarily rasterization performance, the choice could go either way.

But again, we think if rasterization is the priority, then you're better off either spending a little less on the 7800 XT or quite a bit more on the 7900 XT. Not that we necessarily suggest avoiding the GRE, but based on the results we have here, it's only worth a very small premium over the existing 7800 XT.
That concludes our re-review of the 7900 Golden Rabbit, though this time we had the opportunity to look at more board partner models, with the PowerColor Hellhound being particularly impressive.