
With today's enthusiast and gaming PCs using more energy than at any other time in history, you might be looking to see how you can measure the amount of power your machine is consuming. This information will not only tell you how much heat the machine is releasing, but also how much it costs to run your computer.
Fortunately, it's a very simple task.
Using software to measure power
In order to display how much power any PC component is using, the device has to contain appropriate sensors and associated 'flags' for a program to display the information. Parts such as CPUs and GPUs have them, but most other devices won't.
This is mostly because large processors consume significant amounts of power, which in turn is released as heat, so monitoring these devices is essential to prevent excessive heat from damaging those chips. Every other component will only monitor and present voltage or temperature values.
Which in turn means that there's no program that can tell you how much power the entire computer is using. Well, at least none of that are free.
Some power supply units, such as the Corsair AX1500i, come with a cable that hooks the PSU to the motherboard, providing a means to display real-time operation via software. However, these are relatively rare and nearly always a feature of most expensive models.
So we're just going to focus on measuring the power consumption of the CPU and the graphics card. The information can only be used as an estimate of the total energy usage, but at least you won't need to spend any money to do this.
CPU power monitoring programs
Starting with the central processor, there are various programs that you can use to display how much power the chip is consuming. Both AMD and Intel offer their own application to do this: Ryzen Master and Power Gadget, respectively.
Ryzen Master should work with all Ryzen and Threadripper models, for desktop PCs and laptops, but not all the program features may be available. At least, the power displays should work fine, found in the Home section of the Advanced View.
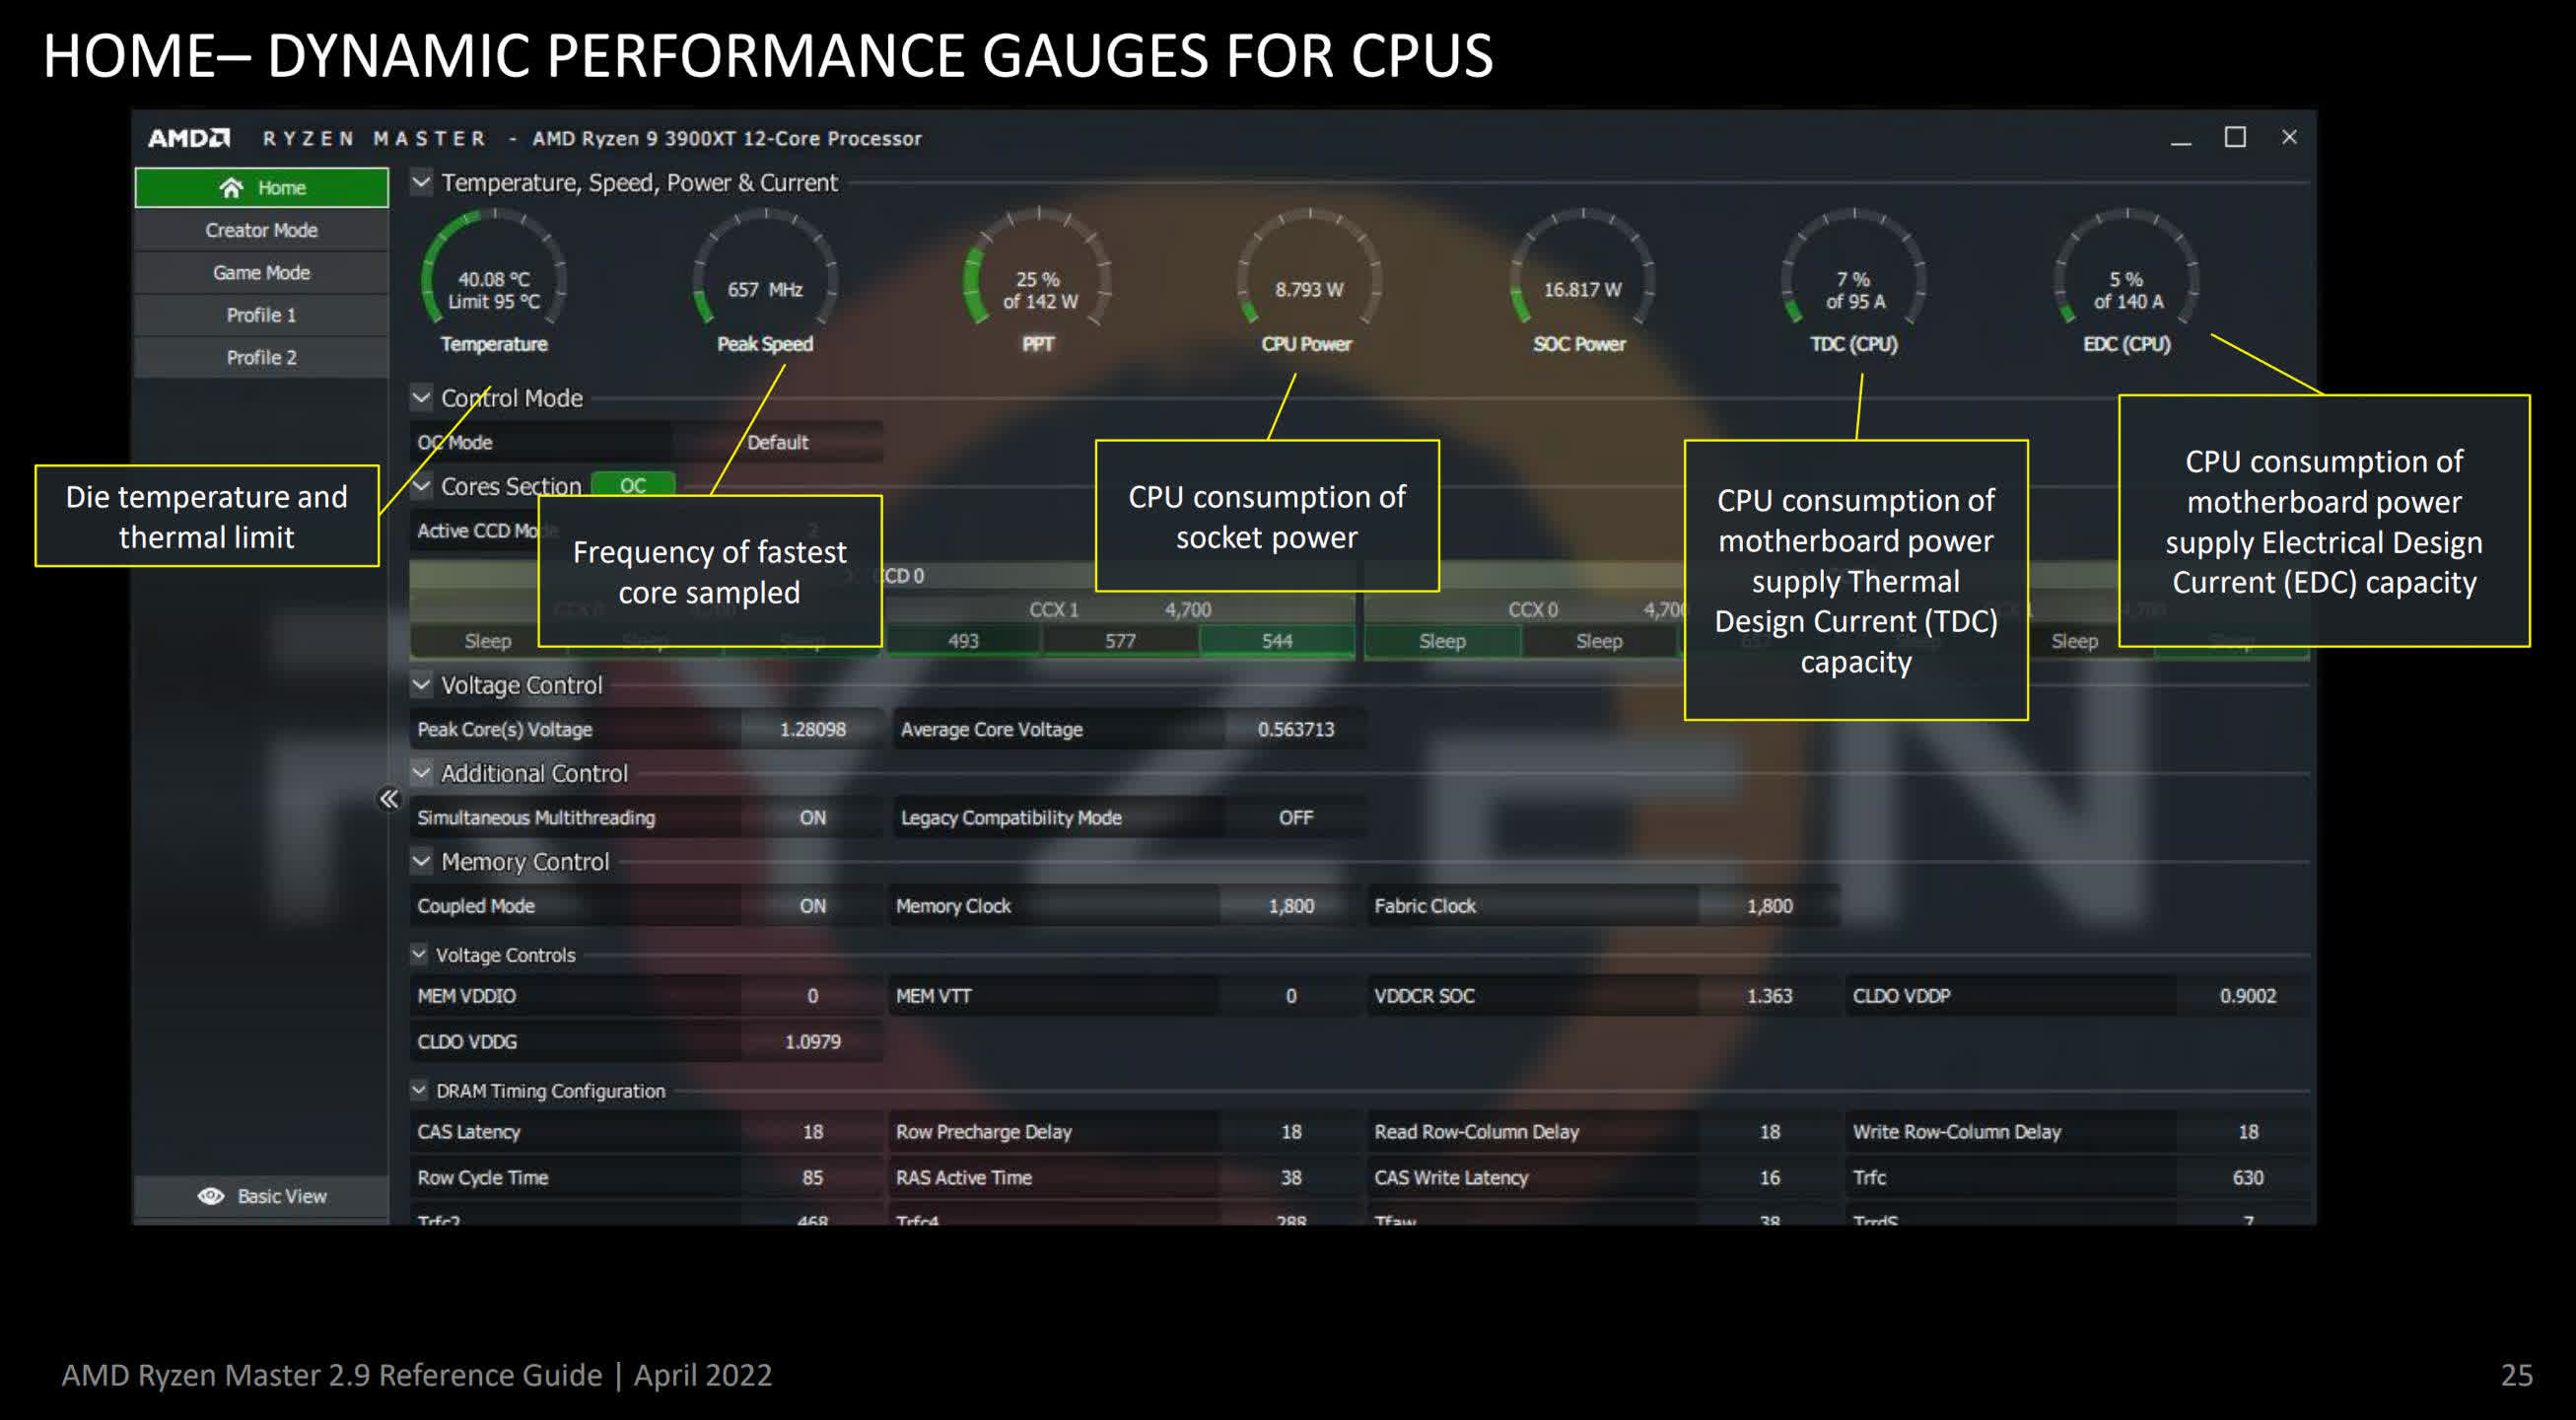
The two dials to check out are labeled CPU and SoC Power (System-on-a-Chip) -- the first one covers the main processing part of the chip, whereas the SoC involves the memory controller and integrated GPU, if your Ryzen chip has one.
Intel's Power Gadget simply shows the CPU and DRAM power consumption, and nothing more. Compared to AMD's software, it's very basic but it does support processors from as far back as 12 years ago (2nd generation Core).
Firing up the program will give you several real-time graphs, showing the total package power (how much energy per second the processor is drawing from the motherboard), along with clock speed, utilization, temperature, and the power consumption of the system memory (DRAM).
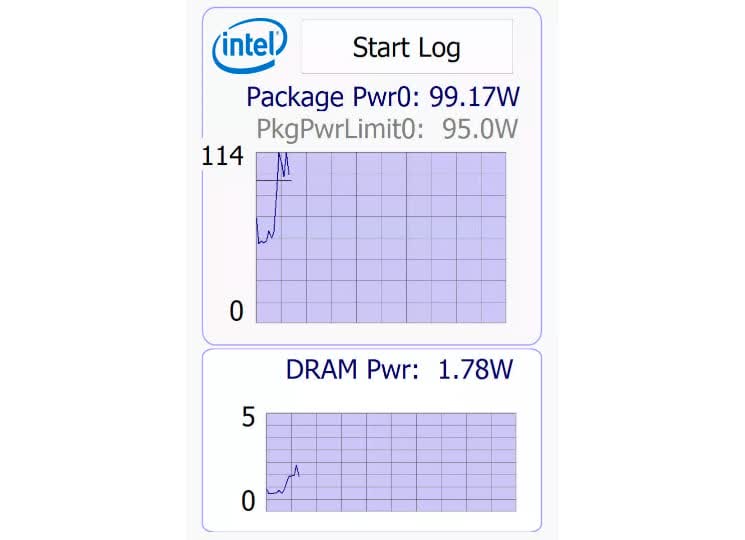
We've had to remove some of those graphs just to make the image a better shape, as there is no way to re-order them, unfortunately. By default, the graphs are very small, so you may want to right-click, select Options and change the size of them.
There is a better program, for monitoring and displaying CPU consumption, though, and it's HWInfo64. This free application can display a vast array of information about your PC, as well as show you almost every sensor inside the machine.
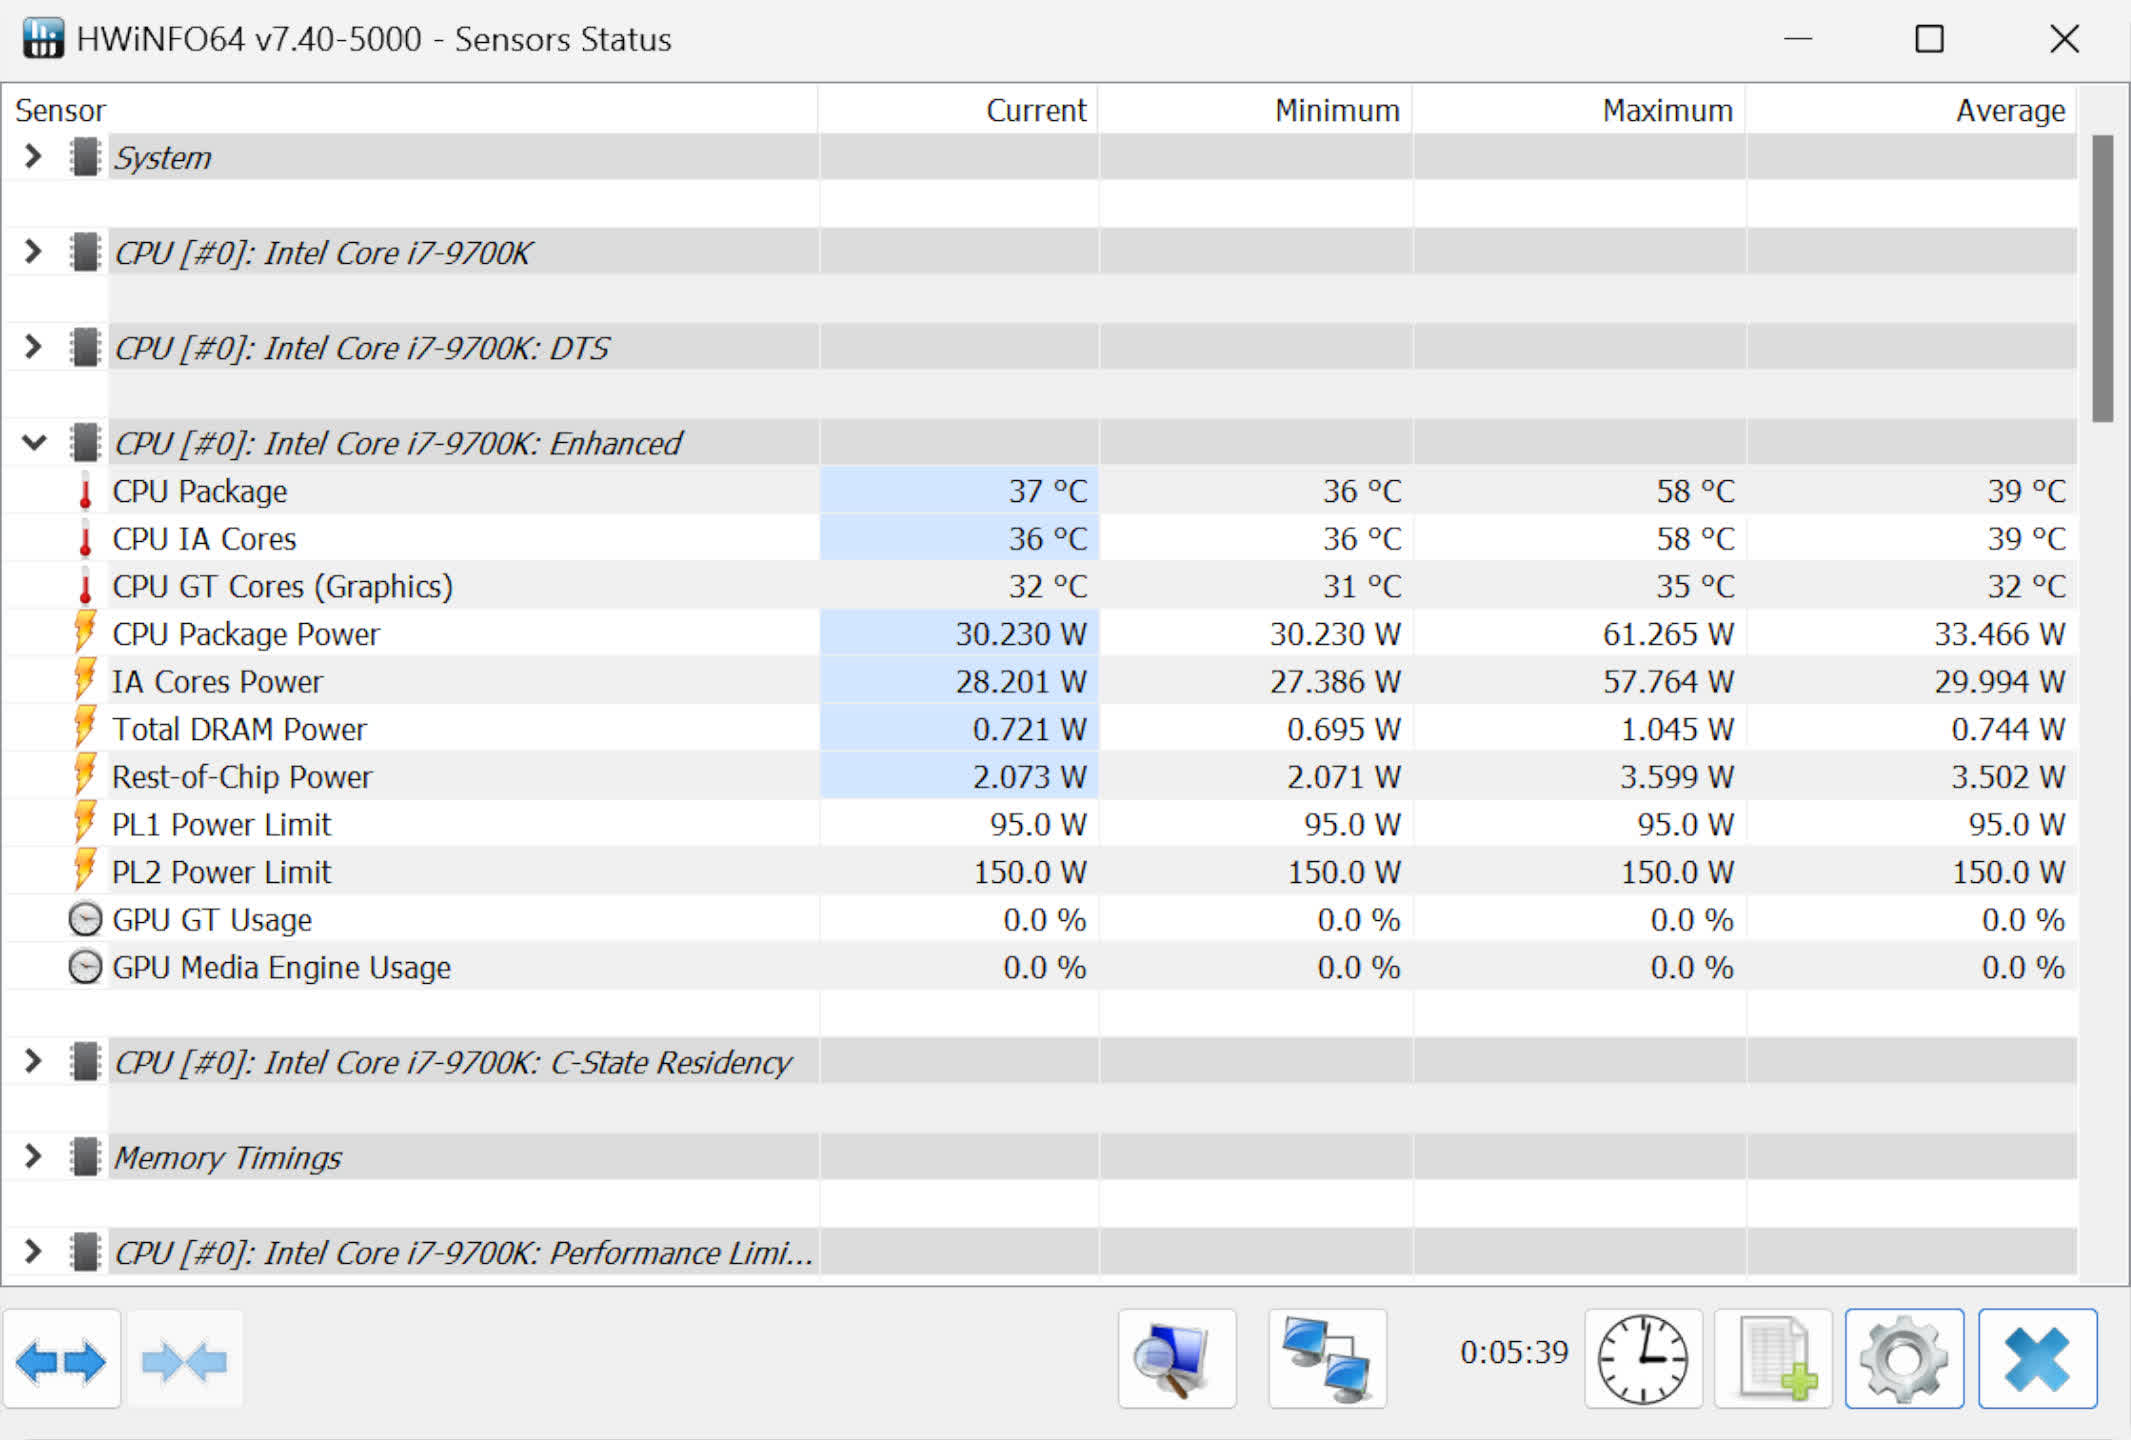
Here, we've just focused on CPU power figures and as you can see, it displays the energy usage in real-time, as well as store the minimum, maximum, and average values while it's running. Clicking on the spreadsheet icon, visible in the bottom-right, will start logging in the data if you want to record the values over a long period of time.
HWInfo64 works on a wider range of processors than Ryzen Master and Power Gadget, but don't forget that if your CPU doesn't have the necessary sensors, the program can't show you the information. AMD and Intel give sensors and power domains different names, so depending on what CPU you have, you may well see a very different screen to the one above.
Programs for GPU power
Graphics chips, just like CPUs, come with a host of sensors for measuring temperature and voltages, and modern GPUs use these to estimate power consumption. Some vendors provide flags, for the drivers to report figures, for more than just the GPU itself.
This is something that HWInfo64 can show, just as it does with CPU information.
Below are the reported power figures for a Zotac GeForce RTX 4070 Ti – other brands may show more or less detail.
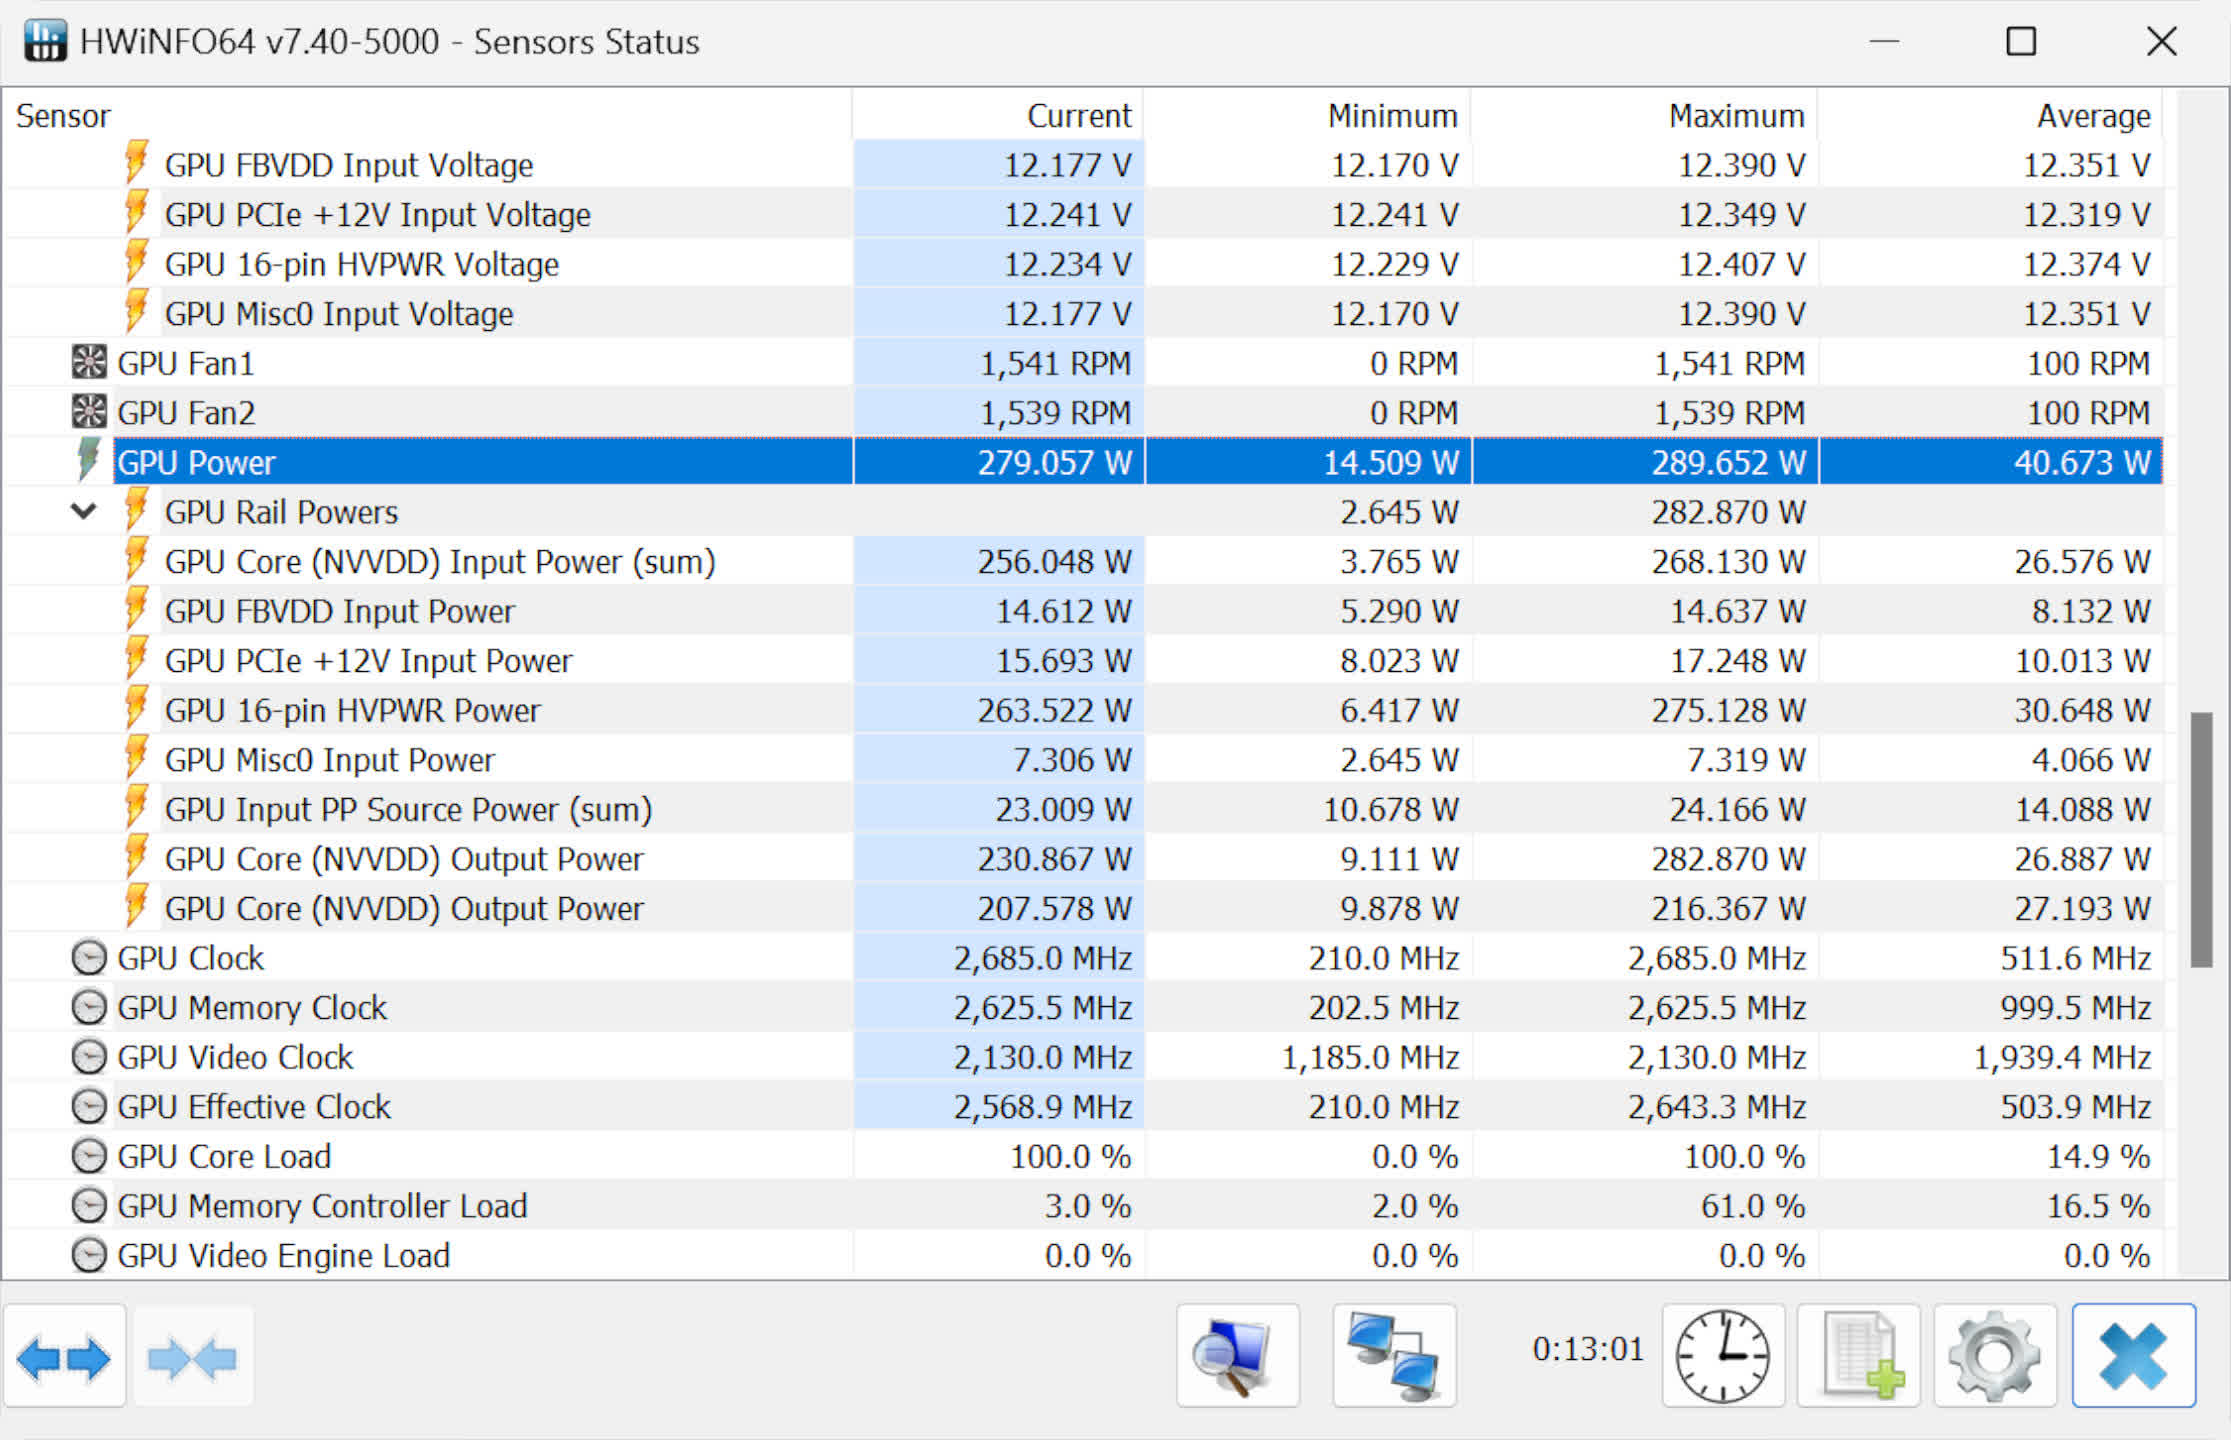
The NVVDD figure is for the GPU itself, whereas the FBVDD is for the frame buffer (FB), i.e. the VRAM on the graphics card. HWInfo64 uses the same sensor names as those given by the drivers, and it's not always very clear as to exactly what you're looking at.
Fortunately, there is one little program that provides a clear picture of the power consumption of your graphics card, called GPU-Z. Developed by the team at TechPowerUp, this piece of software does a much better job at simplifying the power figures. Both programs have tooltips – text descriptions of the sensors will pop up when you rest the mouse cursor on them – but the ones in GPU-Z are more informative, for the general user, than those in HWInfo64.

Using the same graphics card in the same conditions in HWInfo64 and GPU-Z (as shown above), you might wonder, if it's the same card, running the same test, why are the reported figures slightly different?
Unfortunately, very little documentation exists as to precisely how AMD and Nvidia report power figures, but both companies make it clear that the stated values are only estimates. It's good practice to assume that the readings have an accuracy of 90%, at best, perhaps worse with older models.
Also read: Are CPUs and GPUs Becoming Too Energy Hungry?
Unless your PC is packed full of hard drives, a high-end video capture card, or other add-in accessories, the power consumption of the CPU and GPU will form the majority of the energy usage of your computer.
Where the power demand of the main processors will vary enormously, depending on what tasks they're handling, devices like SSDs and HDDs will have a far smaller range. CPUs can go from 30W at idle, all the way up to 125W or more, at full load. A single 512 GB SSD, on the other hand, will only reach 5 or 6W at the most. This is why manufacturers don't provide power monitoring sensors for such devices – there's simply no need.
Devices for measuring total PC power usage
If you read any of our CPU or graphics card reviews, you'll notice that we always show power consumption figures for the entire test system. This is recorded using a monitor that plugs into a wall socket, where we connect our PC and respective PSU.
Since PSUs cannot be 100% efficient at converting 110V AC to 3.3V, 5V, and 12V DC, the unit itself will demand more power from the socket than it actually supplies to the computer. For example, if the load on the PSU is 450W, it might actually draw 530W from the socket.
For people wanting to monitor power consumption for electricity cost purposes, this is the best method to use, as software displaying CPU/GPU power figures can't account for this.
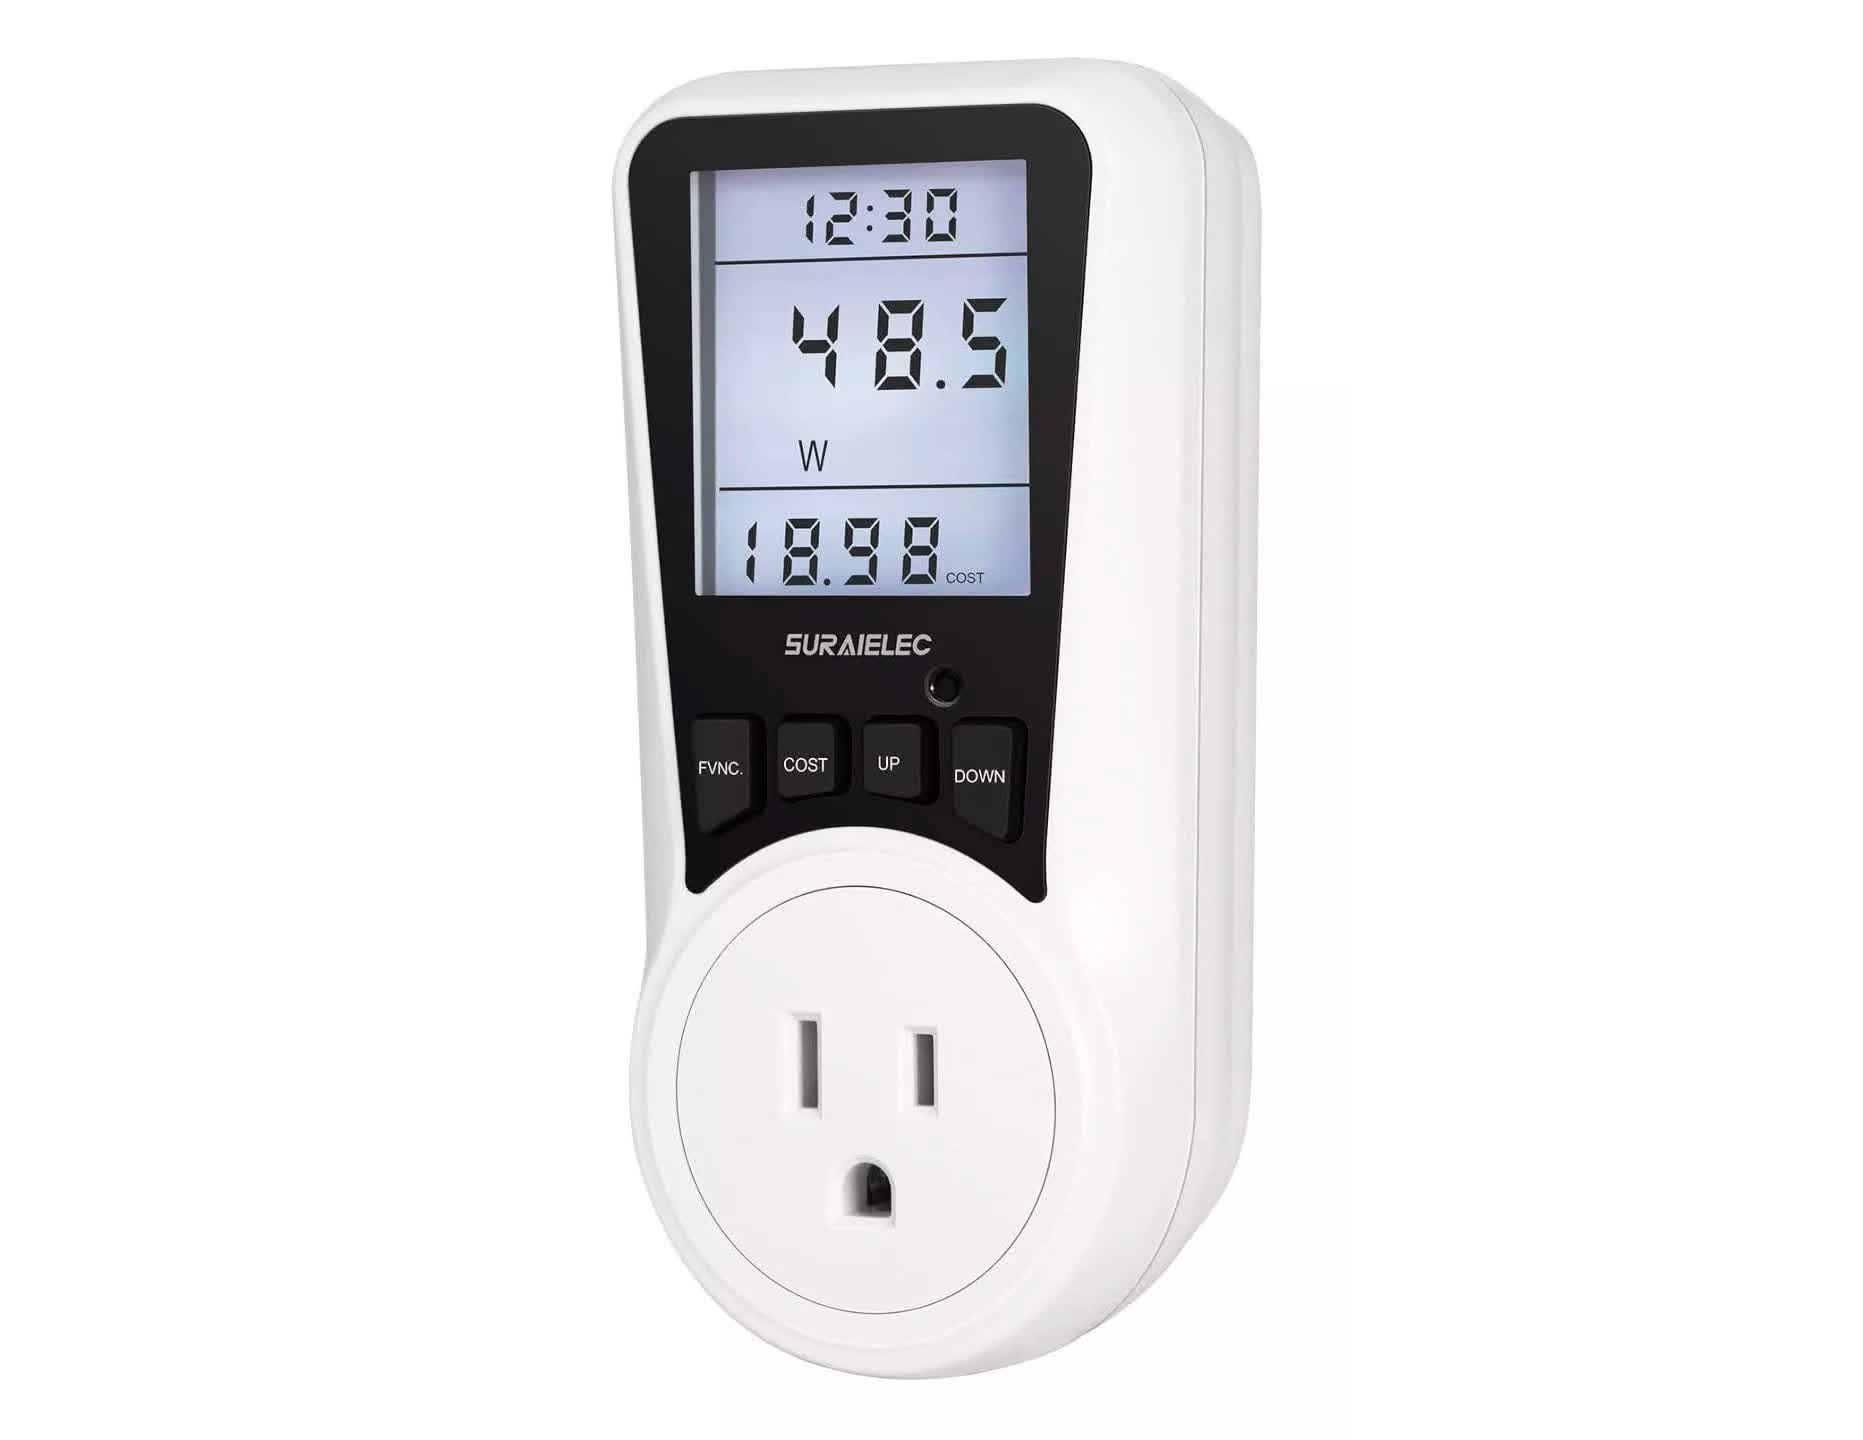
You'll find a wealth of power meters in online stores but the majority of them are relatively cheap and offer similar functions. Choose one that has a higher current limit than what your PSU may possibly draw – for example, if it's rated to 650W, then you'll need a meter that can cope with around 8A of current.
The majority of these meters can also record the total energy used, measured in kWh, and with that value, you can calculate the total cost of running the computer. For example, if your electricity charges are $0.20 per kWh, and the meter shows a reading of 3.4 kWh, then the minimum cost will be $0.68 (not including taxes or standing charges).
On a side note, if you want to get really technical and measure the exact power consumption of a CPU or GPU, then you'll need professional equipment to do this. Such equipment typically fits between the device you want to measure and the socket or power cables it normally uses.
For example, this ElmorLabs PMD-USB has two 8-pin EPS sockets for measuring CPU power and three 8-pin PCIe sockets for recording how much power a graphics card demands. These are really only of use to hardware testers and system builders, and a combination of software and wall socket meters are more than enough for the vast majority of PC users looking to measure power consumption.
How to check if the power figures are correct
Once you've collected some data, you may want to check that everything is as it should be. If your PC is consuming more or less power than you're expecting, it could be indicative of various settings in the PC not being set properly.
Fortunately, it's unlikely that your computer isn't working properly if the power figures aren't at the right level unless it's consuming vastly more than it should be.
There are a number of online calculators, created by PSU manufacturers, that can give you an estimate of what kind of power supply unit your PC requires (e.g. Cooler Master and BeQuiet!), which can then be used as an estimate to the maximum power of your PC.
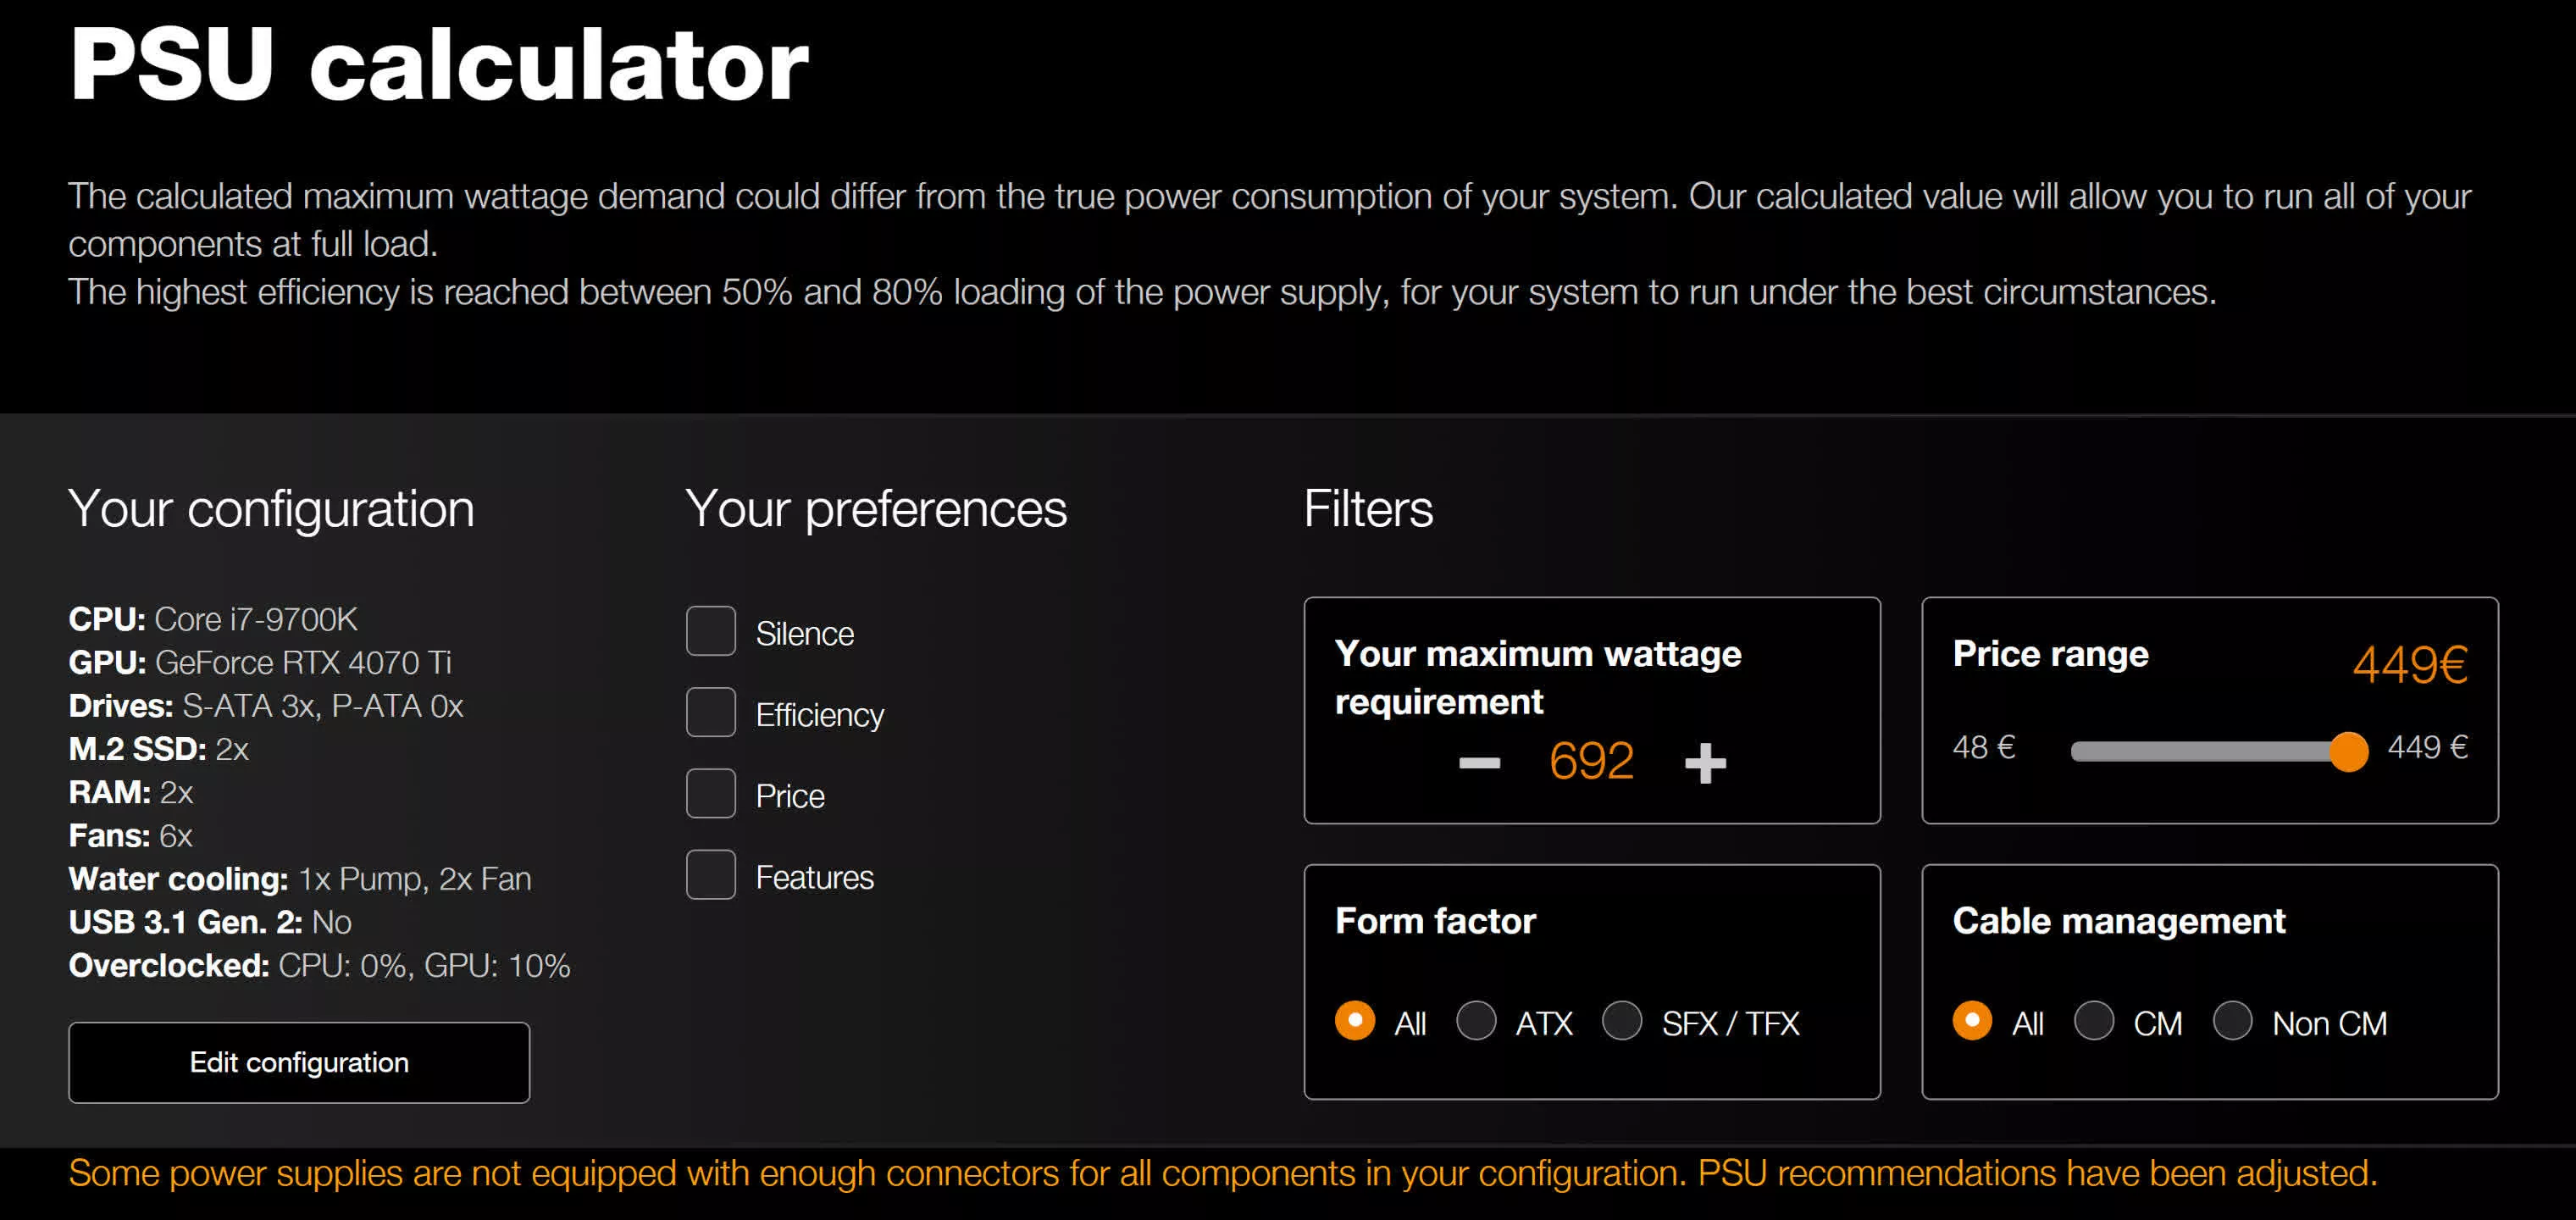
However, these use default power values provided by component vendors, and the calculators themselves offer wildly varying answers. For example, for the same configuration, Cooler Master recommended 561 W, whereas BeQuiet! suggested a maximum power of 692 W – that's a substantial 131 W difference.
You're going to be far better off hunting down the specifications for the various parts inside your PC and using them to judge how accurate the power measurements are. AMD, Intel, and Nvidia all provide such information, though it's not always that easy to find the exact detail you want.
However, RAM and motherboard vendors rarely state any power figures for their products, as they generally use relatively little energy (just like storage drives). So to help you on your way, we've compiled a small table of approximate power values for the main components in a desktop PC.
| Component | Type | Typical power range (watts, W) |
| CPU | High end desktop (10+ cores) | 30 (idle) | 120 to 250 (max) |
| Mid-range desktop (6 to 8) | 15 (idle) | 60 to 150 (max) | |
| Low-end desktop (4 to 6 cores) | 15 (idle) | 60 to 120 (max) | |
| GPU | High end graphics card | 30 (idle) | 250 to 400 (max) |
| Mid-range graphics card | 20 (idle) | 175 to 220 (max) | |
| Low-end graphics card | 20 (idle) | 75 to 150 (max) | |
| Motherboard | ATX size | 4 (idle) | 15 to 30 (max) |
| Micro-ATX | Mini-ITX size | 2 (idle) | 5 to 20 (max) | |
| DRAM | 8GB DDR4/5 | 1 (idle) | 5 (max) |
| SSD | M.2 NVMe drive | 0.5 (idle) | 6 (max) |
| HDD | SATA 3.5" 7200rpm drive | 3 (idle) | 8 (max) |
| Cooling | Case/heatsink fan | 2 to 5 (max) |
The above is a simple guide to roughly show what you can expect – you can take a CPU and put it into three different motherboard models, and they might all show different power figures. Enthusiast-level models that are designed to allow overclocking will typically have higher maximums than those targeted for business or low-cost sectors.
But a combination of the right software and a bit of internet research, and you'll be able to record and check out the power consumption of your PC in no time at all.
Masthead credit: Onur Binay