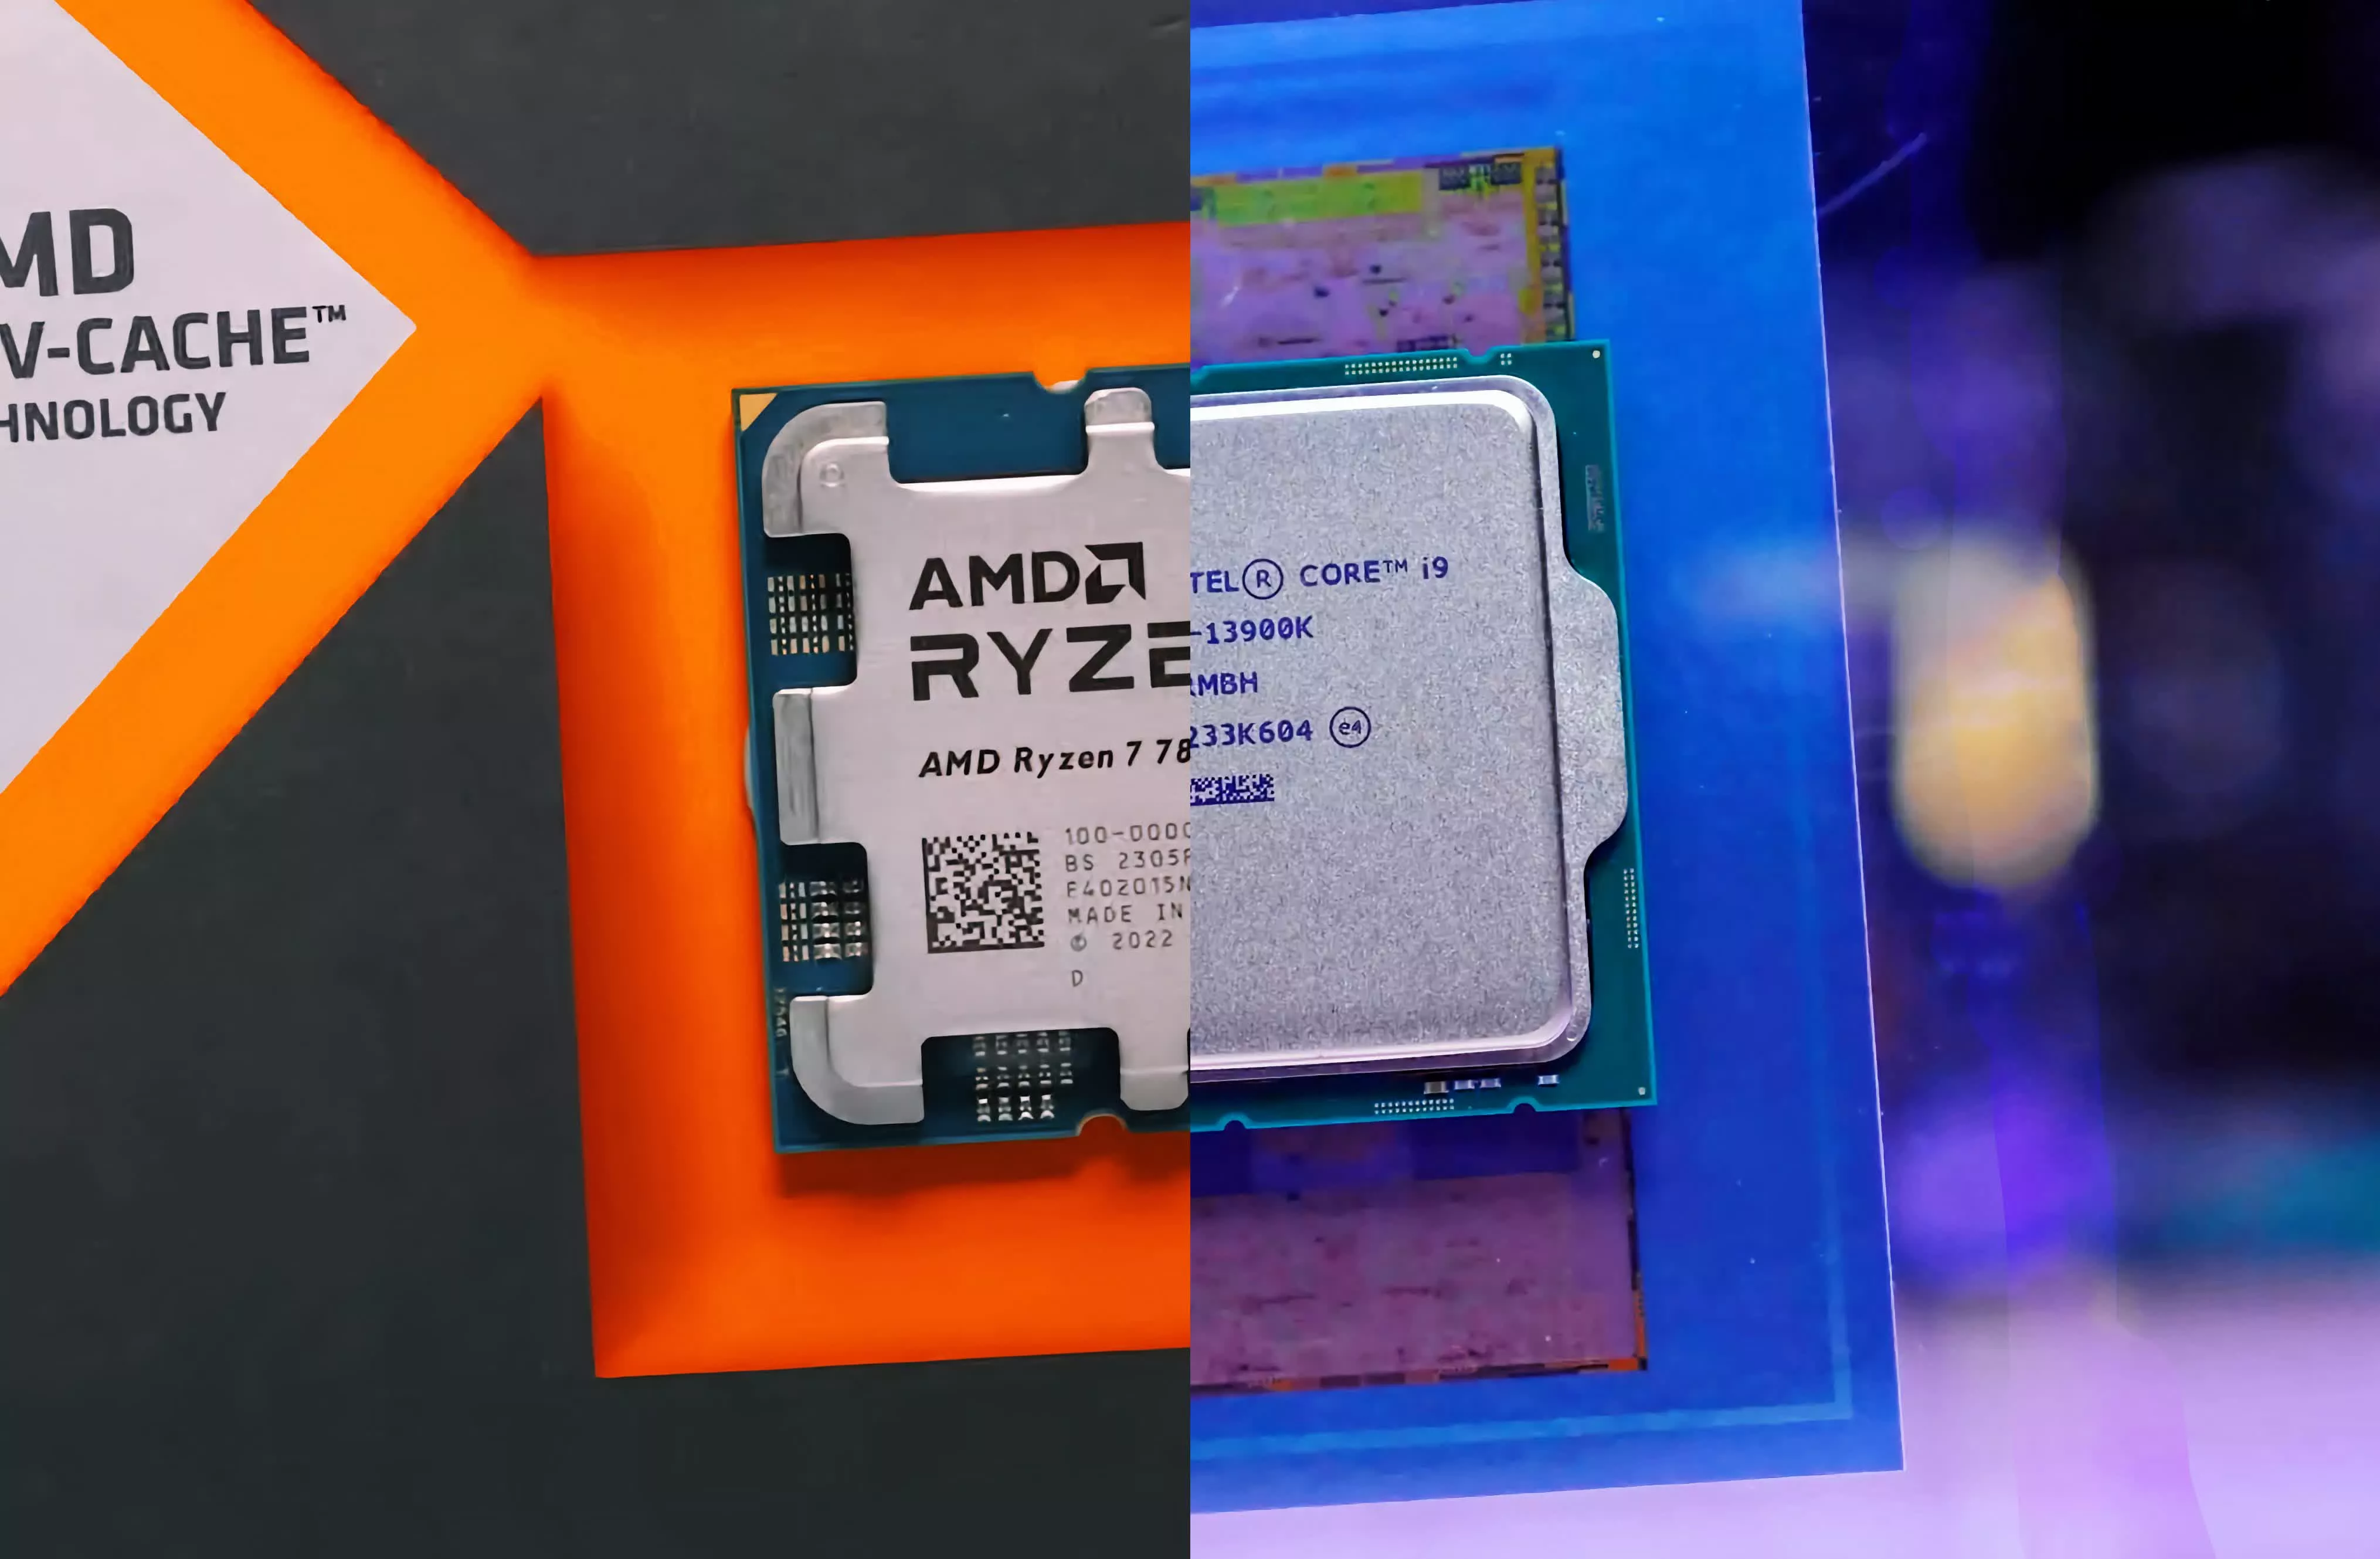
Today, we're taking an updated look at the gaming performance of AMD's Ryzen 7 7800X3D, comparing it with Intel's best offering, the Core i9-13900K. While the absolute best would be the 13900KS, we're going to assume you're not keen on wasting money on superfluous products, so we'll stick with the much more sensible 13900K.
Not too long ago, we examined the gaming performance of the Core i7-13700K and compared it to the 7800X3D. The Ryzen 7 processor was faster overall, offering 11% more performance on average at 1080p. Then, once factoring in the price of the DDR5-7200 memory required to extract that level of performance from the i7, pricing between both options was much of a muchness. It made recommending the Intel processor solely for gaming very challenging.

Of course, there's an even faster option from Intel that we'll be examining today. The key advantage the Core i9 has over the more affordable i7 for gaming is a 20% increase in L3 cache to 36MB, and a small core frequency bump of around 2-5%. There are other advantages, such as a doubling of E-cores from 8 to 16, but that's not particularly beneficial for those of you focused on gaming.
All said and done, the 13900K does cost a little over 40% more than the 13700K. This cost difference is going to affect its value proposition versus the 7800X3D. But enough preamble, let's dive in.

For testing, the 7800X3D was installed on the Gigabyte X670E Aorus Master using the latest F11c BIOS revision and DDR5-6000 CL30 memory. Meanwhile, the 13700K was benchmarked using the MSI MPG Z790 Carbon Wi-Fi with DDR5-7200 memory.

As the Intel CPU supports higher clocked memory, we're giving it every chance possible. Then, for the graphics card, we naturally selected the Asus ROG Strix RTX 4090 OC Edition. The graphics card has been benchmarked at 1080p, 1440p, and 4K. So without further ado, let's delve into the results…
Benchmarks
First up, we have Hogwarts Legacy using the ultra quality settings. Previously, we found the 7800X3D to be just 8% faster than the 13700K at 1080p. The 13900K does a commendable job of closing the gap, as now the Ryzen processor is only 3% faster, a negligible performance difference. Similar margins are seen at 1440p before the results become entirely GPU limited at 4K.


Now, with ray tracing enabled, we find much of the same – very similar performance among all three CPUs. However, the 1% lows of the 7800X3D do improve dramatically here. At 1080p, the average frame rate for the Ryzen 7 part is just 5% higher than that of the 13900K, but the 1% lows are 13% greater, marking a noticeable improvement.

Moving on to Spider-Man Remastered, we find that the 7800X3D and 13900K are neck and neck. The 13900K is slightly faster when comparing the average frame rate, while the 1% lows are better for the 7800X3D.

With ray tracing enabled, the 13900K and 7800X3D again find themselves neck and neck. There's just a few percentage points between them, so there's no clear winner here. In our opinion, the performance is close enough to call it a tie.

As we've found in the past, any modern high-end CPU will get the job done for pushing 300+ fps in Fortnite. When using Epic quality settings, you'll be able to max out an RTX 4090 with any one of these three CPUs.

The story is much the same with ray tracing enabled, though we did manage to extract a few extra frames with the 13900K. However, we're talking about a mere 3% boost over the 7800X3D at 1080p. Then, of course, we're entirely GPU limited at 1440p and 4K.

Moving on to The Last of Us Part I, we find nearly identical performance between the 7800X3D and 13900K. The 7800X3D was up to 10% faster than the 13700K at 1080p, but the 13900K was able to close that gap completely.

The 7800X3D performs very fast in Star Wars Jedi: Survivor, and the 13900K was unable to catch up. The Ryzen 7 processor is 15% faster at 1080p, improving performance over the 13700K by only 5%. That said, we do end up entirely GPU limited at 1440p with 160 fps.

Next, we have Halo Infinite. Like Fortnite, this is another game that's largely GPU limited. Though at 1080p, we seem to be hitting a game limit as performance isn't greatly reduced when increasing the resolution to 1440p. Whatever the case, both the 13900K and 7800X3D can get the most out of the RTX 4090.

Another game where these latest generation CPUs are able to maximize the performance of the RTX 4090 is Warhammer III. As a result, even the 1080p data is GPU limited. So, there's not much more to report here, and we'll move on…

The 13900K isn't really offering much in the way of a performance boost over the 13700K in F1 22, just a few extra frames at 1080p. This means that the 7800X3D is 7% faster, which isn't a substantial margin. By the time we hit 1440p, the game becomes entirely GPU limited.

Moving on to Cyberpunk 2077, which is quite a CPU demanding game, we find that the 13900K can nudge ahead of the 7800X3D at 1080p, though only by a 4% margin. The 1% lows were much the same. However, the 13900K did offer a noticeable boost over the 13700K, allowing it to match or beat the Ryzen 7 processor.

Although Cyberpunk 2077 is a CPU-demanding game, with ray tracing enabled, any of these CPUs are more than powerful enough to extract maximum performance from the RTX 4090, even at 1080p. The 13900K and 7800X3D allowed for an average of 123 fps.

The 13900K pulled out an 8% win over the 7800X3D in The Callisto Protocol at 1080p, pushing 283 fps, whereas the Ryzen part could only match the Core i7. That said, at 1440p, they were neck and neck, and of course, the same was also true at the heavily GPU-limited 4K resolution.

Hitman 3 provides us with a similar set of results to The Callisto Protocol. The 13900K was again the faster CPU, delivering 6% more frames at 1080p before becoming GPU limited at 1440p.
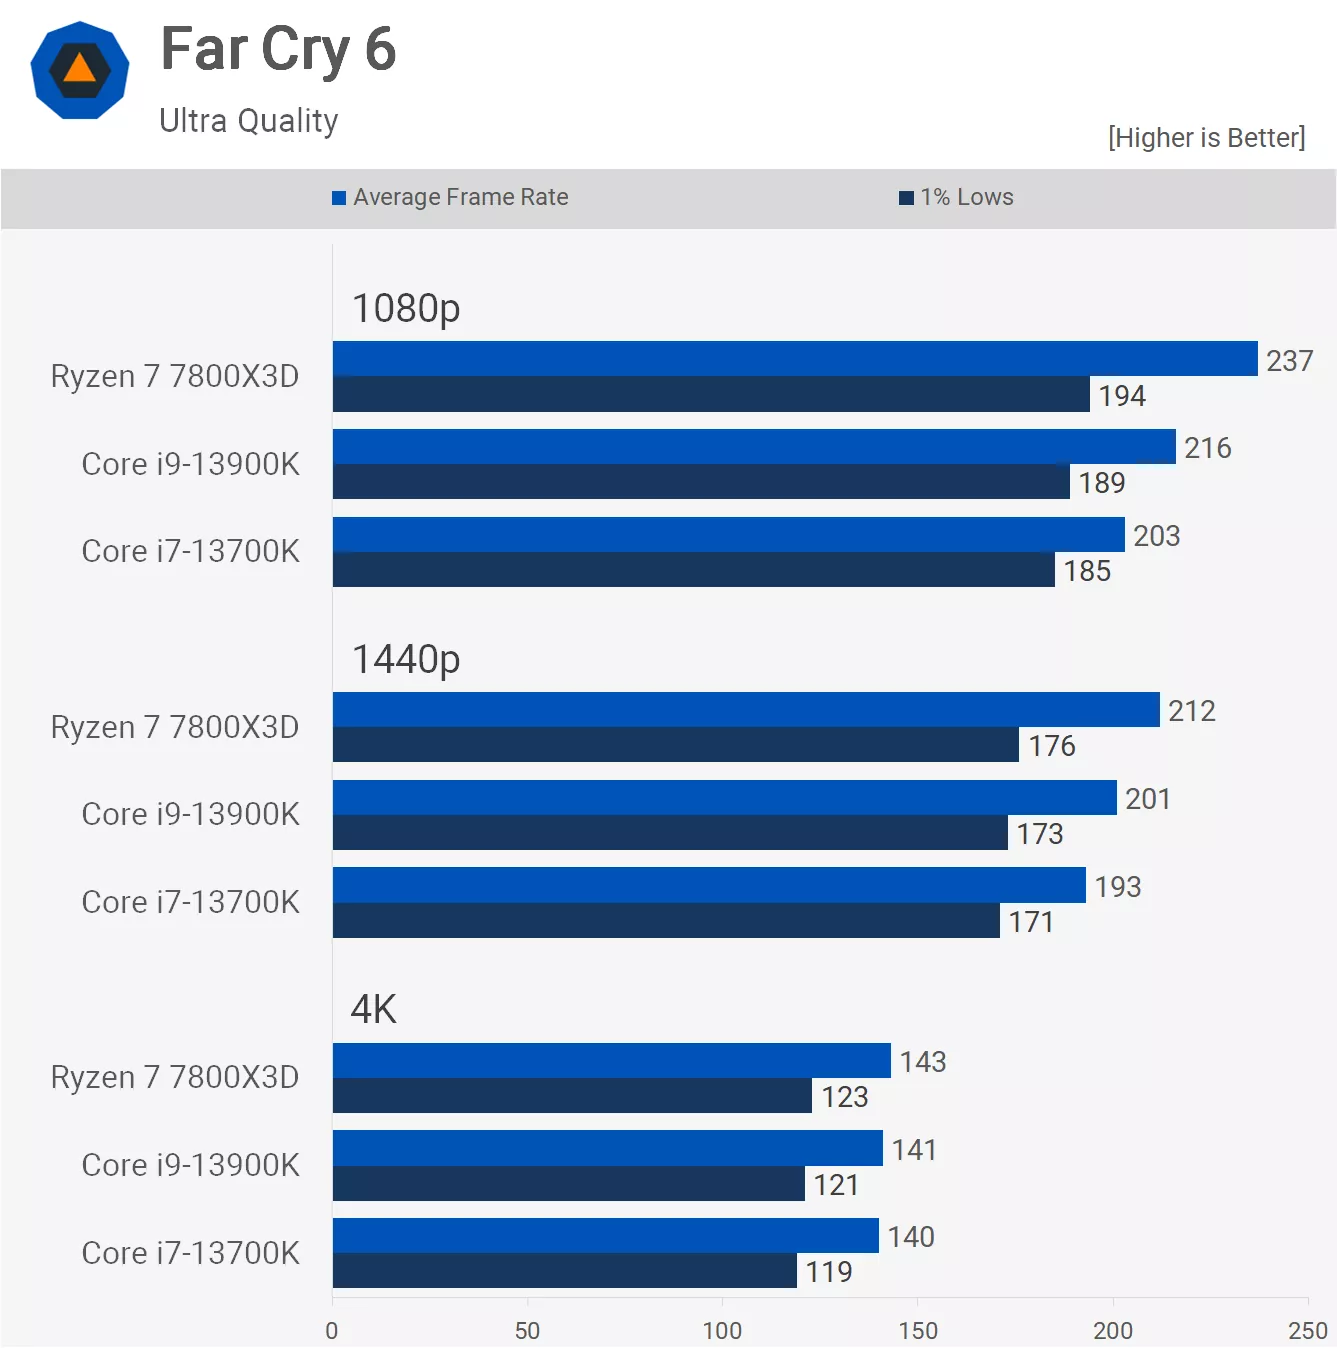
The 7800X3D still appears to have the edge in Far Cry 6, hitting 237 fps on average, making it 10% faster than the 19300K. Scaling in this one is a bit odd though, as we seem to run into some kind of system or game limitation at just over 200 fps. Clearly, Far Cry 6 isn't a game that needs hundreds of frames per second, and we can't imagine it was designed with that kind of throughput in mind.

Shadow of the Tomb Raider is another CPU-heavy game, especially in the village section that we use for testing. That said, as we've found a number of times now, both the 13900K and 7800X3D are powerful enough to get the most out of the RTX 4090 in this title, even at 1080p, so overall performance is again much the same.

Next, we have Tom Clancy's Rainbow Six Siege and a few notes on testing here. We've noticed that the 3D V-Cache CPUs produce really high scores for the first few benchmark passes, and it takes around six back-to-back loops of the benchmark before the numbers level off. We assume this has something to do with filling the L3 cache, as it's not something we saw as much with the Intel CPUs, for example, the second run generally levelled off with the 13900K.
We've also moved from Vulkan to DirectX 11 as both the 7800X3D and 13900K were faster using DX11 with the RTX 4090. So, whereas previously the 7800X3D had a reasonable performance advantage over the 13900K in this test, they're now much the same, although the 1% lows were still higher for the Ryzen processor at 1080p.

Horizon Zero Dawn does favor the 7800X3D, and the results here are very consistent, handing AMD a 10% win at 1080p and 9% at 1440p. Interestingly, the 13900K isn't much faster than the 13700K, so it's difficult to say what exactly the limitation is here for the Raptor Lake CPUs.

Moving on, we know that ACC loves AMD's 3D V-Cache CPUs, but again, we find it interesting that the extra L3 of the Core i9 isn't really helping it relative to the i7, with just a 4% boost at 1080p, for example. Meanwhile, the 7800X3D is 27% faster than the 7800X3D, averaging an impressive 218 fps, so a big win here for the Ryzen 7 processor.

Resident Evil 4 is a relatively new addition to our CPU benchmarks, and it has some interesting results for us. The 13900K is a good bit faster than the 13700K here, boosting performance at 1080p by 11%. Still, that wasn't enough to catch the 7800X3D, which still ended up 14% faster than the i9, with 177 fps on average. Similar margins were again produced at 1440p, and this is when using the highest quality preset which enables ray tracing.

The results from A Plague Tale: Requiem are also a bit unexpected. Again, we find a situation where the 13900K isn't able to improve upon the performance seen with the 13700K, yet the 7800X3D still manages to be 16% faster at 1080p. Even at 1440p, the 7800X3D was still 11% faster as the data appears quite heavily CPU limited, though by the time we hit the 4K resolution, the data is 100% GPU limited, as expected.

The 7800X3D is also dominant in Watch Dogs: Legion, delivering 24% more performance than the 13900K at 1080p. This is also yet another example where the Core i9 can't really improve upon the i7, despite comfortably losing to the 7800X3D.

The Riftbreaker has always been a strong title for Intel, and the 13900K vs. 7800X3D battle is no exception. The i9 was able to match the 7800X3D at 1080p and in fact actually delivered better 1% lows, boosting performance here by 10%.

Last up, we have Modern Warfare II, and this is a fairly even battle between the 13900K and the 7800X3D, with basically identical performance seen at all three tested resolutions. So let's wrap this up…
Performance Summary
We've taken a look at how the Ryzen 7 7800X3D and Core i9-13900K compare across a wide range of games. Now, it's time to break down all the data to get a clear picture of how these CPUs compare…

At 1080p, the results are pretty much as expected. The 7800X3D is just 5% faster on average, meaning that overall gaming performance is very similar between these two flagship processors. There are games where the 3D V-Cache part was far superior, with no examples where it lost by a significant margin. So, AMD does have that going in their favor, but truth be told, both are exceptionally fast overall.

The margin is reduced to just 4% in favor of the 7800X3D when testing at 1440p, and now there are no titles where the Ryzen 7 processor was slower by more than a 2% margin. However, there were four games where it was faster by 10% or more, with significant wins still coming from Watch Dogs Legion and ACC.

Lastly, at 4K, the performance is basically identical as we're, for the most part, looking at RTX 4090 performance, and not really CPU performance, ACC being the only real exception in this list. These results aren't useful at all. You certainly can't work out which CPU actually offers the best value or best gaming performance based on this data, but some readers demand 4K CPU testing, so we try to include it when possible.
Power Consumption
Let's now talk power consumption and the methodology behind this measurement. We use an expensive power meter that measures power draw from the wall and supports data logging, enabling us to measure and log real-time total system usage throughout our tests. For testing, we allow the system to warm up for 20 minutes and then run the benchmark pass three times, taking the average power use for each run. This gives us three data points, the average of which is reported as the final result, as shown on the graph here.
This reflects total system usage. While it's not peak power usage, it's almost always very close - within 10-20 watts, as power usage doesn't tend to fluctuate much in this testing. As with all of our testing, it's stock, so just XMP or EXPO loaded. We're not undervolting, as that would be very misleading given results will vary wildly depending on silicon quality.

We should also note that both the AMD and Intel test systems use the same power supply, with the only difference being the CPU, motherboard, and memory. The only other variable is the frame rate; the higher the frame rate, the harder and therefore more power the RTX 4090 is using. However, in almost all these examples, frame rates were much the same, so for the most part, this factor is a non-issue.
The end result is typically much higher power usage for the 13900K when compared to the 7800X3D. In fact, the Intel system used an alarming 106 watts more on average when compared to the AMD system.
We did see examples such as Star Wars Jedi Survivor, Resident Evil 4, and A Plague Tale: Requiem where the 13900K used up to 72 watts more power. However, these results were well under the average, and in these instances, the 7800X3D was 14% faster or more at 1080p.
Then we see some remarkably high power figures for the 13900K in The Last of Us Part 1. Initially, these figures almost didn't seem possible, but after further investigation, they started to make sense. For some reason, the game utilizes over 60% of the 13900K in our test, and more than half of the E-Core are heavily loaded, causing power levels to skyrocket.
We're still seeing 70% utilization on the 7800X3D, but with significantly fewer cores, that's to be expected. Nevertheless, even if we disregard The Last of Us result, the 13900K still consumed, on average, 92 watts more than the 7800X3D, and that's a substantial difference for the CPU to make. So, if you care about power efficiency, the 13900K may not be the CPU for you, or at the very least, you'll need to invest some time in tweaking its operating parameters, though you could also do the same for the 7800X3D.
Top Gaming CPU: AMD vs. Intel
So, there we have it. That's how the Ryzen 7 7800X3D and Core i9-13900K compare head-to-head in terms of gaming performance and power consumption. To tell the truth, they're both very similar, as we noted in our day one 7800X3D review. They do tend to trade blows, resulting in very similar performance overall, though we did find more instances where the Ryzen processor won by a considerable margin.
It seems that the 7800X3D is generally faster when paired with DDR5-6000 CL30 memory versus the 13900K using DDR5-7200. This means that the Ryzen processor presents itself as the best value high-end gaming option right now, priced at $450 versus $580 for the 13900K, making the i9 nearly 30% more expensive.
For those of you purely interested in high-end gaming performance, the 7800X3D is undoubtedly a much better value option, and it also consumes significantly less power.

Beyond gaming, the 13900K packs considerably more punch with its 16 E-cores, so it does a better job of offering the best of both worlds. That being said, the 7950X3D can be purchased for $680, and those 16 big cores ensure robust performance in all productivity workloads, whereas the E-core can be a bit more hit or miss. You'll really want to research how the two compare for your workloads.

Gaming is much more clear-cut, and here it's an 8-core vs. 8-core battle between the 7800X3D and 13900K, and it appears that AMD has won this round. That said, Intel is set to strike back soon with their Raptor Lake refresh, though the upcoming 14th gen series is likely only going to be a minor improvement over the 13th gen, with the biggest gains likely to come in Cinebench and other applications that utilize E-cores well.
Of course, we've yet to test parts like the upcoming Core i9-14900K, so we can predict if Intel can catch and even beat AMD for gaming. However, we should have an answer for you in around three months. Until then, we hope you found this review useful.
Shopping Shortcuts:
- AMD Ryzen 7 7800X3D on Amazon
- Intel Core i9-13900K on Amazon
- AMD Ryzen 9 7950X3D on Amazon
- Intel Core i7-13700K on Amazon
- AMD Ryzen 7 7700 on Amazon
- Intel Core i5-13600K on Amazon
- AMD Ryzen 9 7950X on Amazon
- Nvidia GeForce RTX 4090 on Amazon
Further Testing
We have run additional benchmarks and related CPU reviews you may be interested in: