
In a report released by Ookla using data collected from speedtest.net, both mobile and fixed broadband connections have shown significant growth in speed over the past year. Thanks to improving technologies such as DOCSIS 3.1, wider availability of faster plans at lower pricing and new mobile devices with advanced LTE capabilities, speeds have risen greatly across the US.
Throughout the last 12 months, mobile Internet speeds have increased by 19.2 percent on average (in last year's report, a growth of 33 percent was noted). For mobile download speeds, the US is nowhere near the top of the list. In fact, the United States ranks 44th globally for mobile download speeds (between Germany and Oman). While country size and population density is certainly a factor, it shows there is plenty of room for improvement with existing technologies.
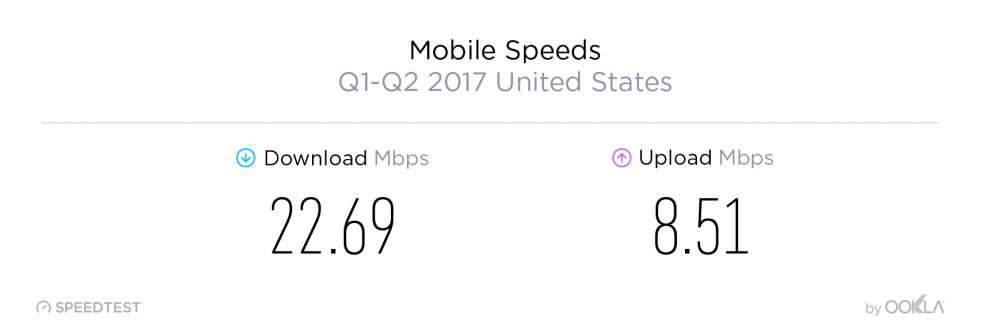
Upload speeds saw very little increase over the previous year. Only a four percent increase (up to 8.51 Mbps) was observed. In the prior year, a 28 percent improvement in upload speed was found. The US falls in line at number 65 for mobile upload speeds in between Mongolia and Germany.
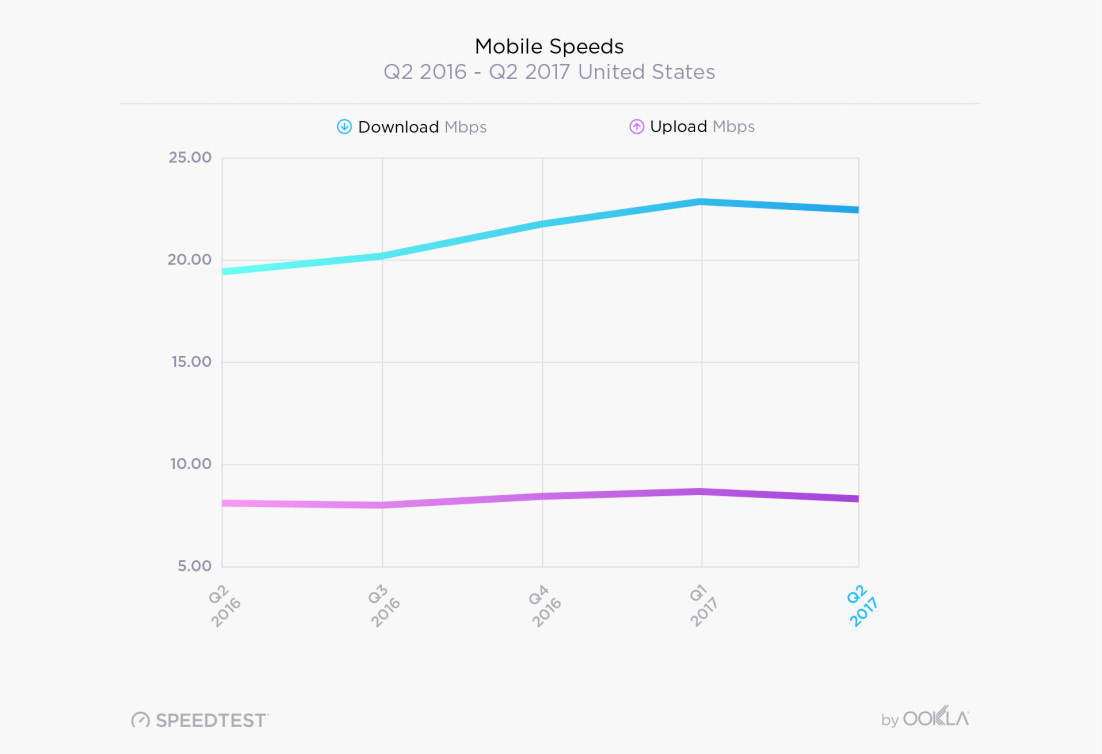
Interestingly, both upload and download speeds slightly decreased during Q2 2017. Ookla points to the fact that deprioritization for customers on unlimited data plans could be the cause of the decline. For customers in rural areas, download speeds were 20.9 percent lower, resulting in an average of 17.93 Mbps.
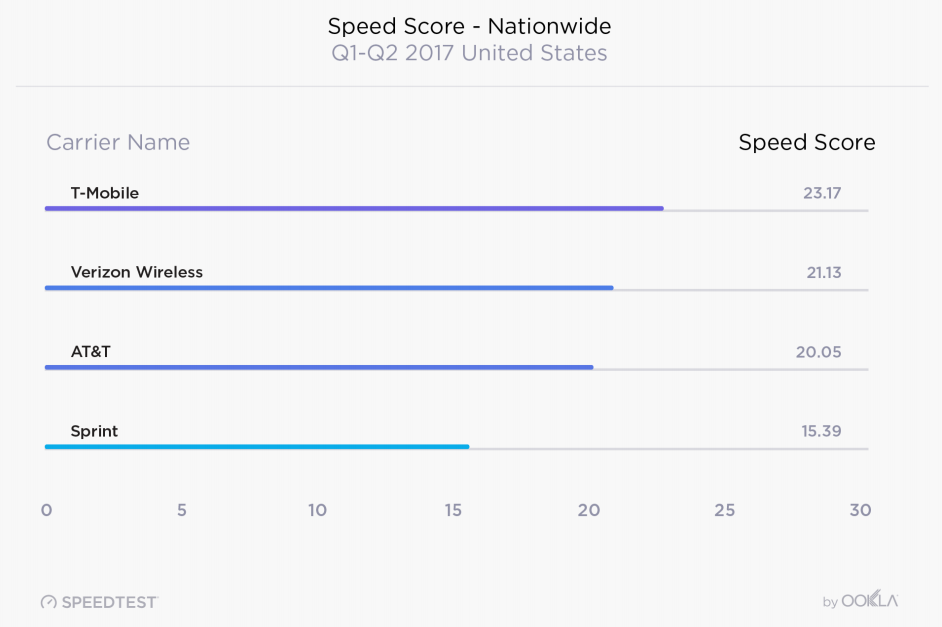
Out of the four major cellular carriers in the US, T-Mobile reigns supreme in average network speed. In the mobile broadband report, Ookla has created a scoring system that uses the 10th, 50th, and 90th percentiles of speeds collected and then generates a weighted average with a 1:2:1 ratio. Download speeds account for 90 percent and upload speeds account for 10 percent of the final score.
The Speed Scores below are meant to best represent the true speeds users can expect on any given network.
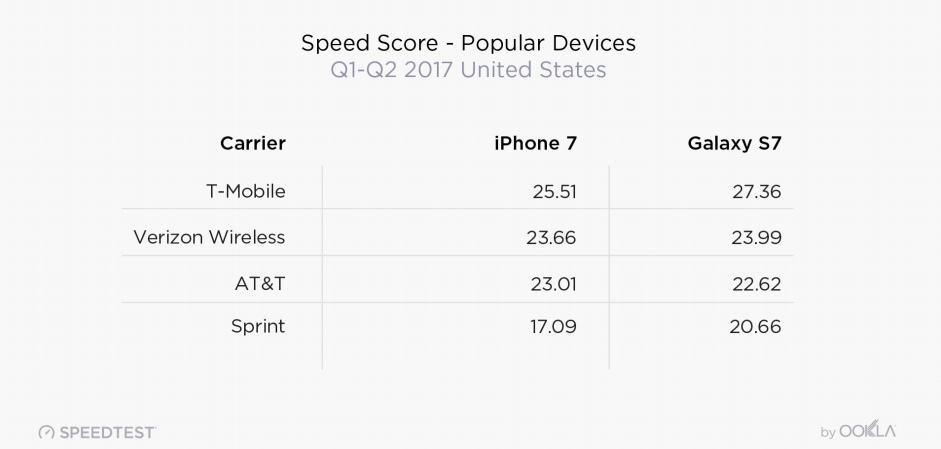
In determining mobile network speeds, end-user devices are becoming more important than ever. Test results show that newer devices capable of higher order modulation, 4-Layer MIMO and aggregating three component carrier signals score significantly better than older devices without these capabilities.
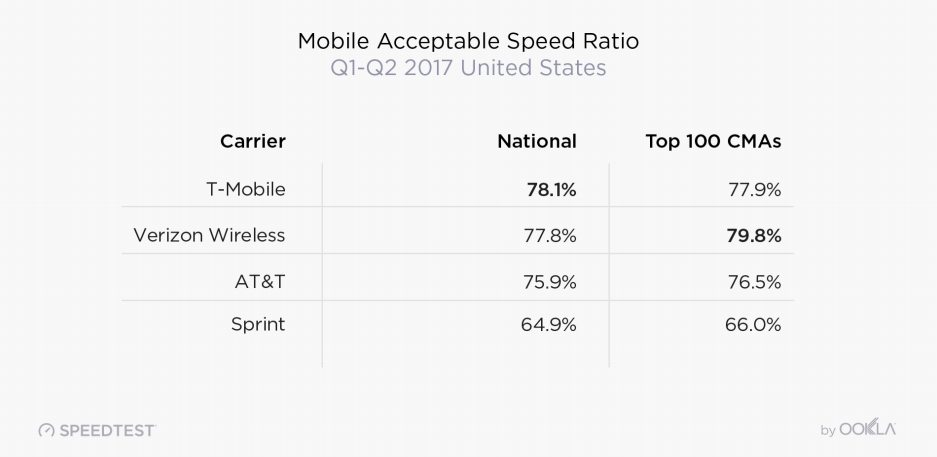
Although it may appear as if there is a relatively large gap between the ranks of carriers, the results become a little bit closer when only the top 100 cellular market areas are considered. T-Mobile only edges ahead of Verizon by 0.3 Mbps, which is not likely noticeable for real-world use. AT&T is still approximately 2 Mbps slower on average and Sprint is very clearly in 4th place, behind at 7.3 Mbps less than T-Mobile.
For this year's study, mobile download speeds at or exceeding 5 Mbps were considered to be acceptable. Carriers like to brag about their coverage, but how many areas receive acceptable speeds for common tasks performed on mobile devices? Landing in the same order as the statistics for average speeds, the acceptable speed regions account for less than 80 percent of coverage areas.
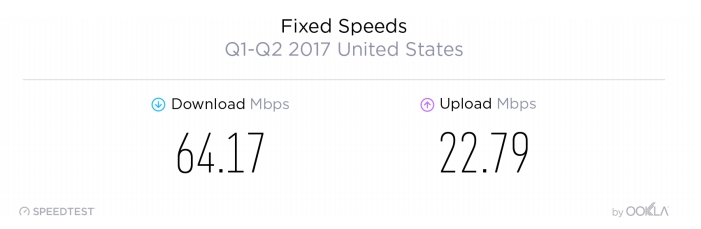
Moving on to fixed broadband connections, the United States ranks 15th for download speed between the Netherlands and Spain with an average of 64.17 Mbps. The US ranks 24th globally for upload speed with an average of 22.79 Mbps.
Compared to one year ago, speeds have drastically improved. Back in Q2 2016, average download speeds were below 50 Mbps and upload speeds were around 15 Mbps. Ookla attributes the increase in speeds to the introduction of 300 Mbps, 400 Mbps and Gigabit service options for a larger number of customers.
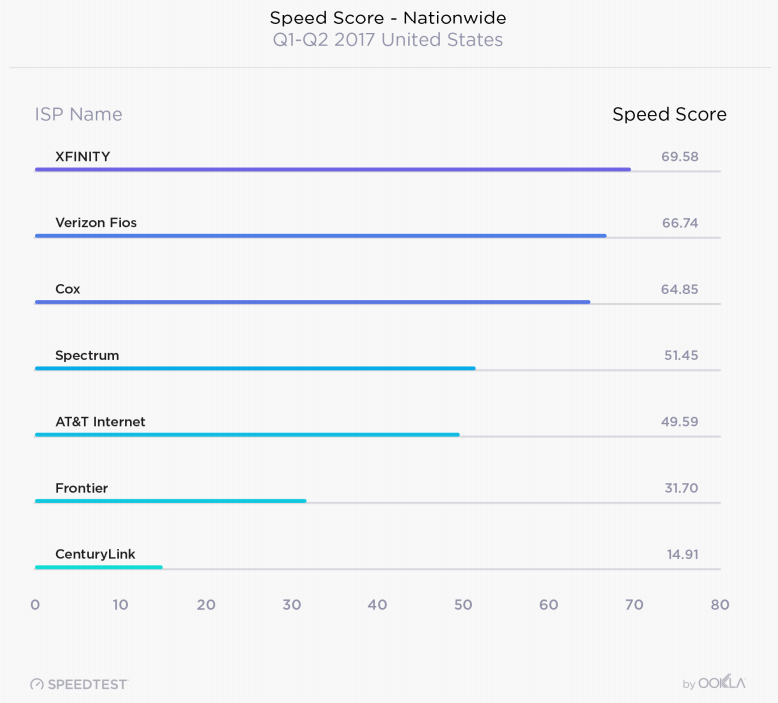
While home users generally have a very select few options over who their service provider is, across the board increases in network speeds were observed. Comcast's XFINITY Internet service utilizing greater numbers of DOCSIS 3.1 channels ranks as number one for network speeds with a Speed Score of 69.58 Mbps. Verizon falls second in line for speed with its fiber optic Fios service.
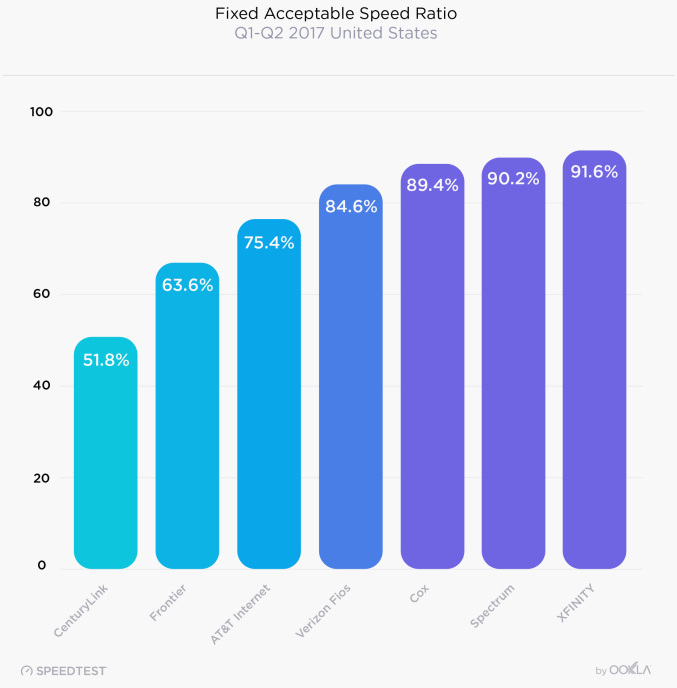
The acceptable speed ratio for fixed broadband has been set at 10 Mbps. Thankfully, fixed service providers score slightly better in this metric than mobile providers do although rural areas are still plagued by lack of options and slower average network speeds.
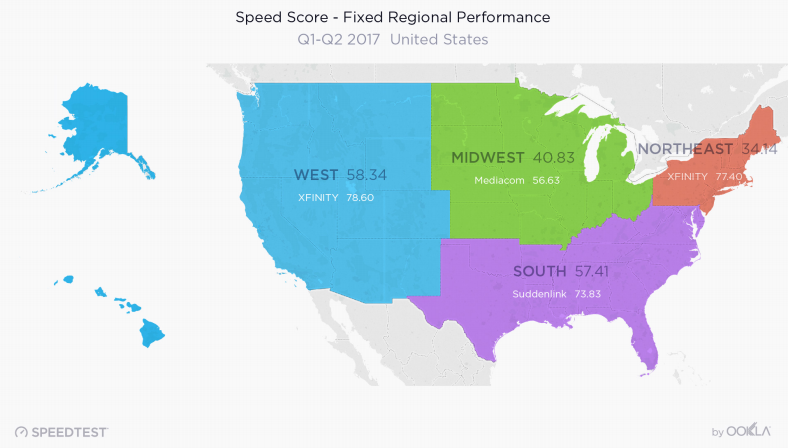
Looking at different regions of the US, the West holds the crown for internet speeds followed closely by the South. The Midwest falls third in line and the Northeast finishes last. However, the Midwest is the lowest overall if you exclude Comcast from the Northeast test results.
It should be noted that small service providers offering high-speed connections have not been properly sampled and accounted for in determining which regions receive the fastest speeds due to lack of availability.
After sifting through all of the data for US internet services, the upward trend in speed is clear. How long it will take for all customers to receive faster service is unknown although development is indeed taking place and more users are gaining access to faster connections.
It will likely be a long time before gigabit or even multi-gigabit internet becomes the norm but there is plenty of improvement to look forward to.