TechSpot Features
Original features exploring tech culture, computing history, how-to guides, explainers, and tech trends.
Latest Features
-
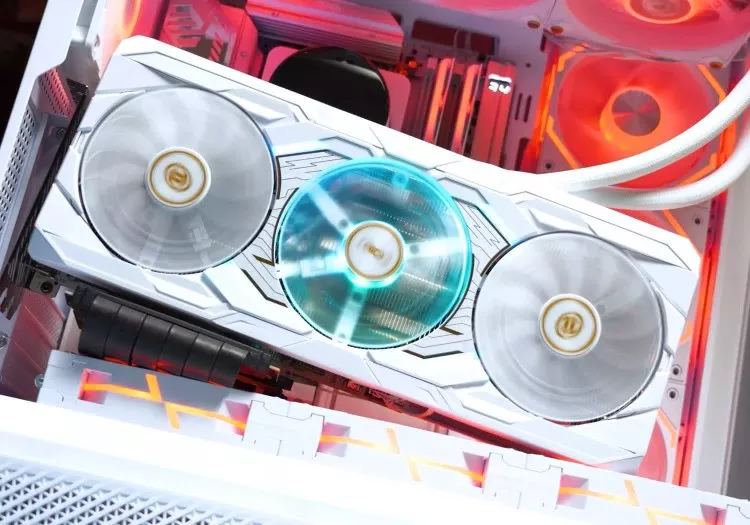
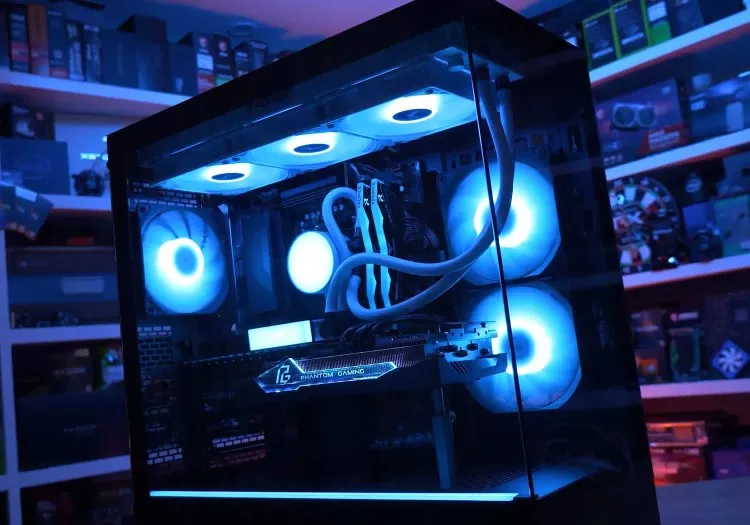
![Absurd GPU Pricing Update: Mid-2026 Edition]()
Absurd GPU Pricing Update: Mid-2026 Edition
Eight months into the memory crisis, GPU prices remain inflated but surprisingly stable. We compare Nvidia, AMD, and Intel graphics card pricing across 10 countries to find the best and worst deals. -
![The AMD Radeon Settings You Should Actually Be Using]()
The AMD Radeon Settings You Should Actually Be Using
AMD Software is packed with gaming features, but not all are worth using. Here are the Radeon settings we recommend for better image quality, smoother gameplay, and cleaner recordings. -
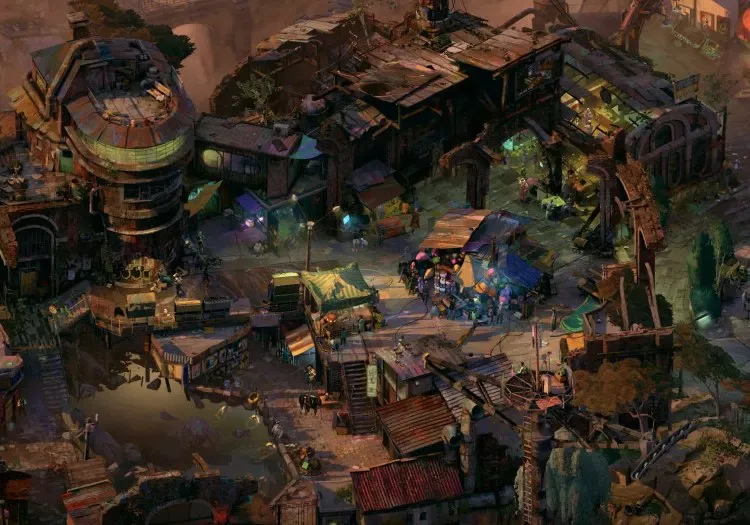
![Indie Gaming's Next Big Wave Is Coming From Outside the West]()
Indie Gaming's Next Big Wave Is Coming From Outside the West
The next great game could come from anywhere. Developers across Asia, Eastern Europe, and Oceania are turning local stories and fresh ideas into global hits that are reshaping the industry. -
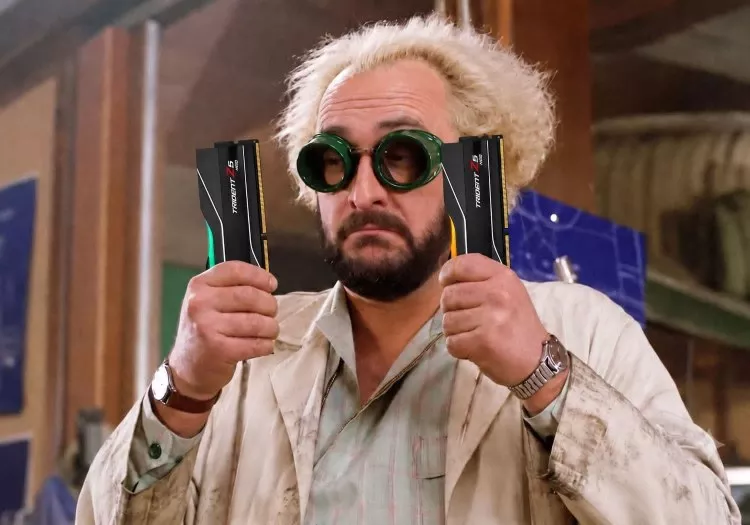
![Testing AMD's EXPO Ultra Low Latency Memory]()
Testing AMD's EXPO Ultra Low Latency Memory
AMD's new EXPO Ultra Low Latency memory promises tighter timings without manual tuning. We tested G.Skill's latest DDR5 kits to see how much faster they make Ryzen gaming. -
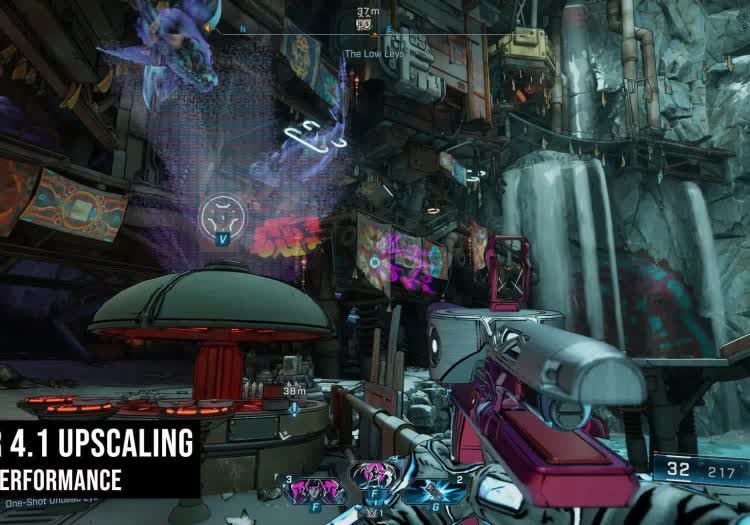
![Testing AMD Radeon's Biggest-Ever Software Upgrade: FSR 4.1 on RDNA 3]()
Testing AMD Radeon's Biggest-Ever Software Upgrade: FSR 4.1 on RDNA 3
AMD's new FSR 4.1 INT8 upscaler gives RDNA 3 GPUs a massive image quality upgrade. We examine visual quality, performance, and how closely it matches the RDNA 4 version. -
![TechSpot PC Buying Guide]()
TechSpot PC Buying Guide
Building a PC in 2026 means navigating inflated RAM, storage, and GPU prices. We assembled four balanced systems that prioritize performance, value, and sensible upgrade paths. -
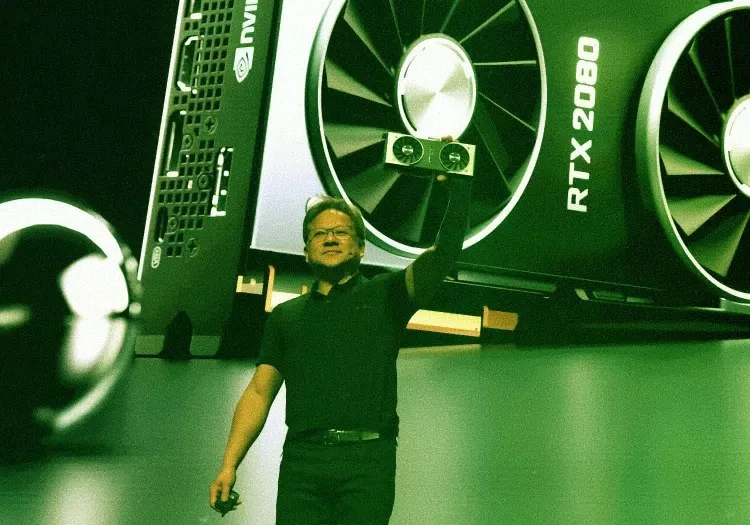
![The Real Reason Nvidia Has Abandoned PC Gamers]()
The Real Reason Nvidia Has Abandoned PC Gamers
Nvidia's shift away from PC gaming wasn't driven by AI alone. Slowing GPU gains, rising manufacturing costs, and longer upgrade cycles made gamers a far less attractive business. -
![Replace These 11 Default Apps in Windows 11]()
Replace These 11 Default Apps in Windows 11
Windows comes with a set of default apps that cover the basics – but for most of them, that's exactly their ceiling. Here are 11 better alternatives worth switching to. -
![In Hindsight: Tech Quotes That Got the Future Right and Wrong]()
In Hindsight: Tech Quotes That Got the Future Right and Wrong
Tech leaders love predicting the future. Sometimes they nail it, sometimes they miss spectacularly, and sometimes they leave behind quotes that only get better with age. -
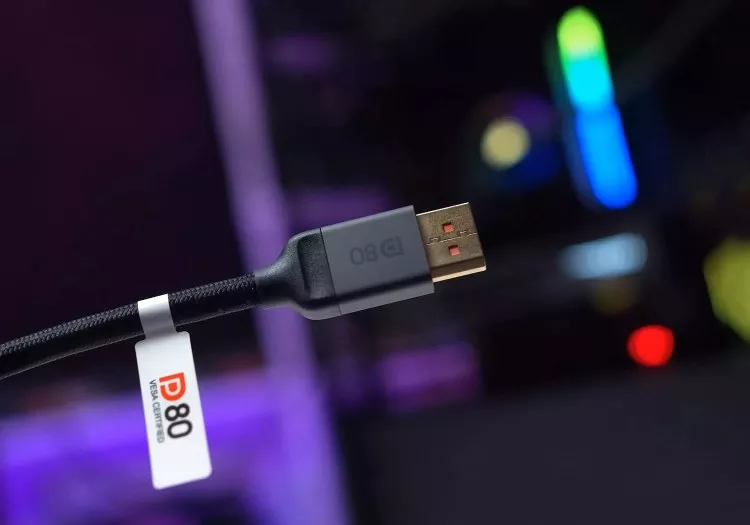
![DisplayPort 2.1 Has a Cable Problem]()
DisplayPort 2.1 Has a Cable Problem
Your DisplayPort 2.1 monitor and graphics card may support UHBR20, but that doesn't mean you're getting it. Here's how a seemingly harmless cable choice can change everything. -
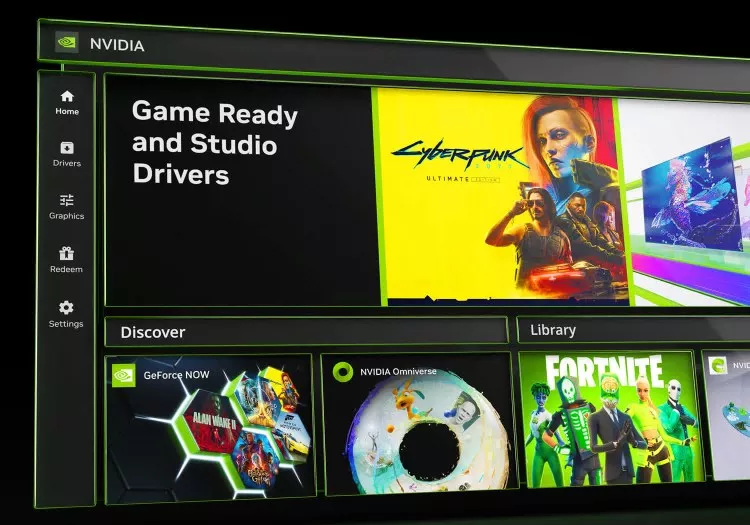
![The Nvidia App Settings You Should Actually Be Using]()
The Nvidia App Settings You Should Actually Be Using
The Nvidia App has evolved far beyond basic driver updates. From monitor tweaks, to DLSS overrides and recording tools, these are the settings PC gamers should actually be using. -
![Was Ray Tracing a Scam?]()
Was Ray Tracing a Scam?
Eight years after Nvidia promised ray tracing would revolutionize gaming, most gamers still disable it. So what happened, and did RTX buyers get sold a fantasy instead of the future? -
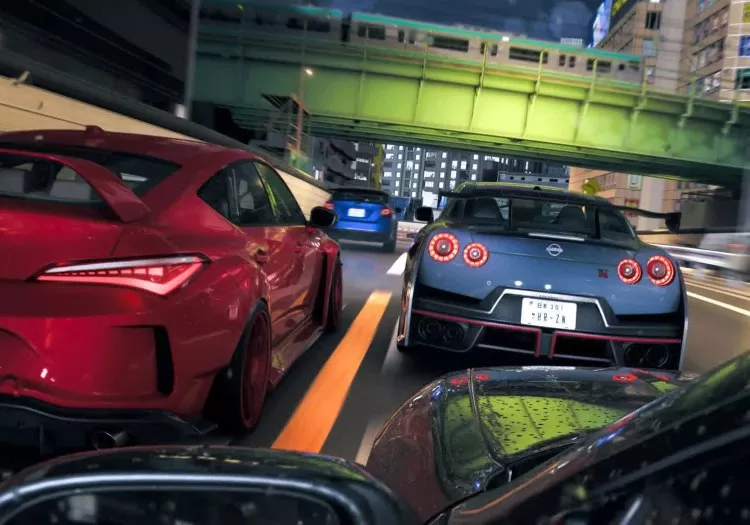
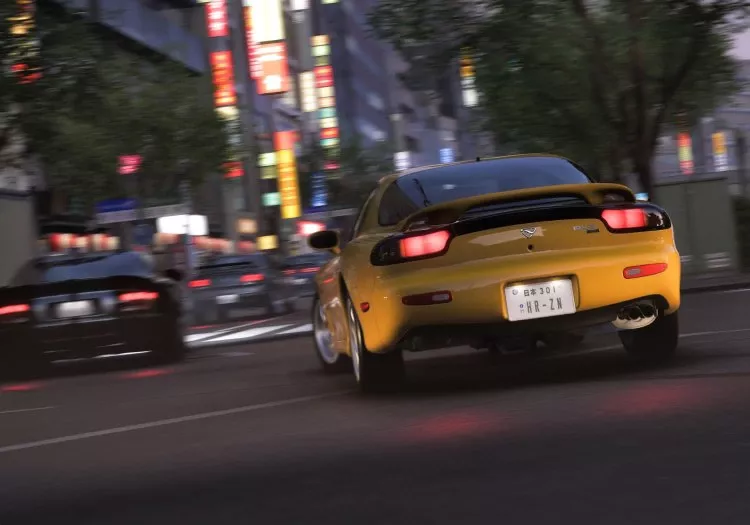
![Forza Horizon 6 Optimization Guide]()
Forza Horizon 6 Optimization Guide
Forza Horizon 6 looks stunning on PC, but some settings deliver huge FPS gains with little visual loss. We benchmark every major option to find the best optimized settings for every GPU tier. -
![Forza Horizon 6 Benchmark: 47 GPUs Tested]()
Forza Horizon 6 Benchmark: 47 GPUs Tested
Forza Horizon 6 is one of the best-looking racing games yet, but max settings and RT can crush modern GPUs. We tested 47 graphics cards to see what it really takes to run well. -
![Forza Horizon 6 GPU Benchmark: 8GB vs. 16GB VRAM]()
Forza Horizon 6 GPU Benchmark: 8GB vs. 16GB VRAM
Forza Horizon 6 looks stunning, but our testing shows modern visuals come at a steep VRAM cost. Here's how 8GB and 16GB GPUs compare across a range of settings and resolutions. -
![Gamers Are Wrong About 1440p vs 1080p CPU Benchmarking]()
Gamers Are Wrong About 1440p vs 1080p CPU Benchmarking
Gamers keep demanding 1440p CPU benchmarks, but higher resolutions often hide the very performance differences CPU testing is supposed to reveal. Here's why 1080p still matters most. -
![How Apple Pay Works]()
How Apple Pay Works
Apple Pay makes contactless payments feel effortless, but behind that two-second tap is a surprisingly sophisticated chain of cryptography, tokenization, and real-time authorization. -
![Frame Generation Doesn't Fix Bad Performance!]()
Frame Generation Doesn't Fix Bad Performance!
Frame generation is supposed to make good performance better, not hide the fact that a game is running at 15 FPS. Lego Batman's spec sheet just crossed that line. -
![This is Why You Won't Buy a Steam Machine in 2026]()
This is Why You Won't Buy a Steam Machine in 2026
Valve's Steam Machine was supposed to be an affordable gaming PC for the living room. Rising memory and storage prices have turned that dream into a pricing nightmare. -
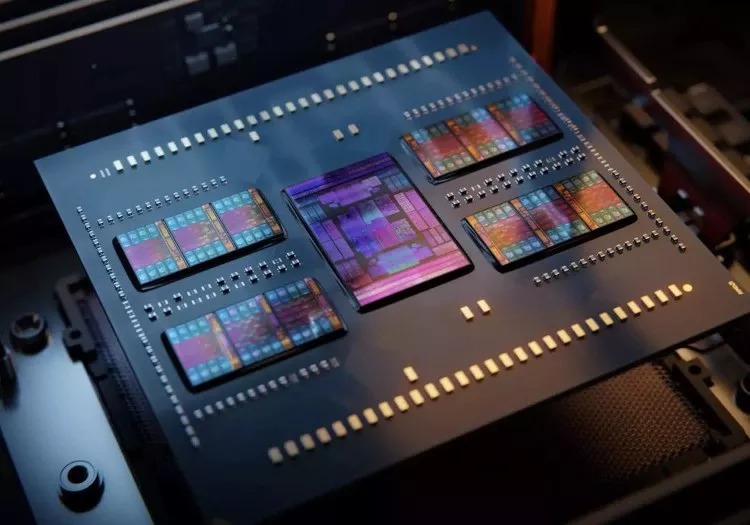
![A Decade of AMD Ryzen: 10 Years of CPUs Tested]()
A Decade of AMD Ryzen: 10 Years of CPUs Tested
From near collapse to CPU dominance, we revisit 10 years of AMD Ryzen, benchmarking every flagship generation to see how performance, value, and architecture evolved. -
![GPU Pricing Remains Broken, Even if It Has Stopped Getting Worse]()
GPU Pricing Remains Broken, Even if It Has Stopped Getting Worse
GPU prices have stopped getting worse, but they have not gotten much better either. Demand has fallen, prices remain elevated, and most graphics cards still sell well above MSRP worldwide. -
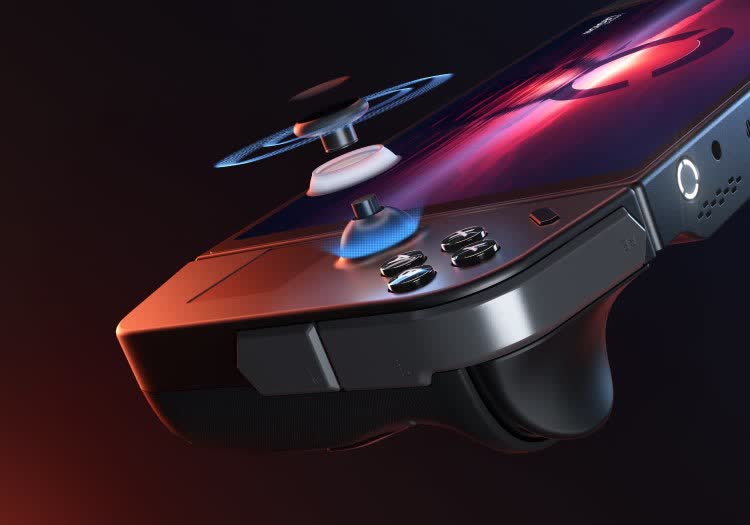
![The Handheld Gaming "Holy Grail": FSR 4 INT8, XeFG, and XeLL]()
The Handheld Gaming "Holy Grail": FSR 4 INT8, XeFG, and XeLL
Windows handhelds may have found a breakthrough. FSR 4 INT8, XeFG, and XeLL can turn compromised 30 FPS gaming into smooth 60 FPS play, making devices like the Legion Go far more capable than expected. -
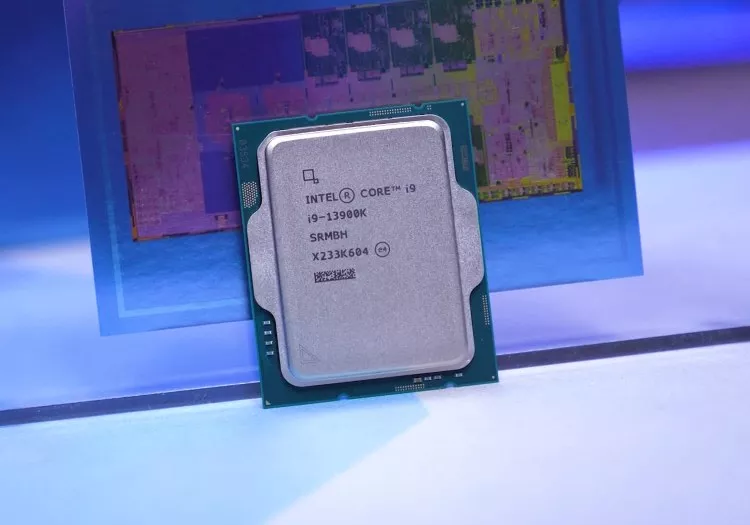
![How Intel Got Into Trouble: We Test the Last Decade of Intel Flagship CPUs]()
How Intel Got Into Trouble: We Test the Last Decade of Intel Flagship CPUs
From Kaby Lake to Core Ultra, we revisit Intel's flagship CPUs to see how a decade of design choices shaped performance, power, and ultimately, how the company lost its lead. -
![After Wi-Fi 7's Speed Push, Wi-Fi 8 Is Turning to Reliability]()
After Wi-Fi 7's Speed Push, Wi-Fi 8 Is Turning to Reliability
Wi-Fi 8 is already taking shape, and while it won't raise peak speeds beyond Wi-Fi 7, it promises something just as important: more reliable, lower-latency wireless performance where it actually matters. -
![What Ever Happened to Napster?]()
What Ever Happened to Napster?
Napster made digital music feel limitless for the first time, then vanished in lawsuits, rebrands, and sales. Its name faded, but its ideas still shape how the world listens. -
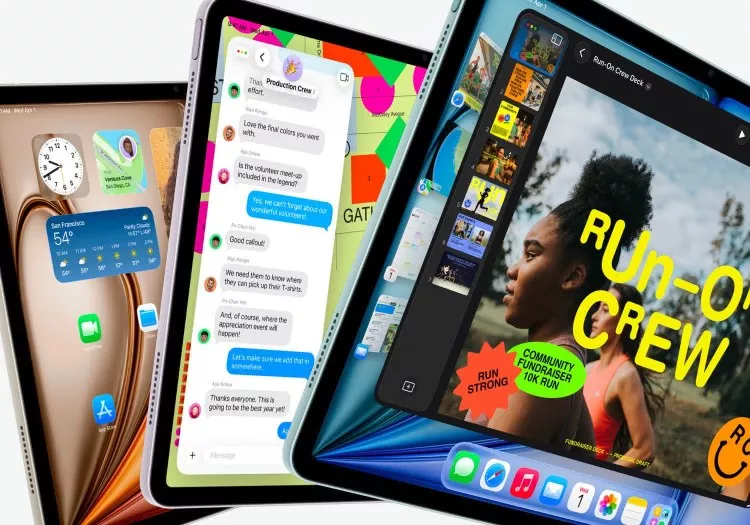
![Which iPad Model Should You Get?]()
Which iPad Model Should You Get?
Thanks to its class-leading hardware and software, the Apple iPad lineup has long been the go-to tablet recommendation for most people, but now let us guide you on which model is the best for you. -
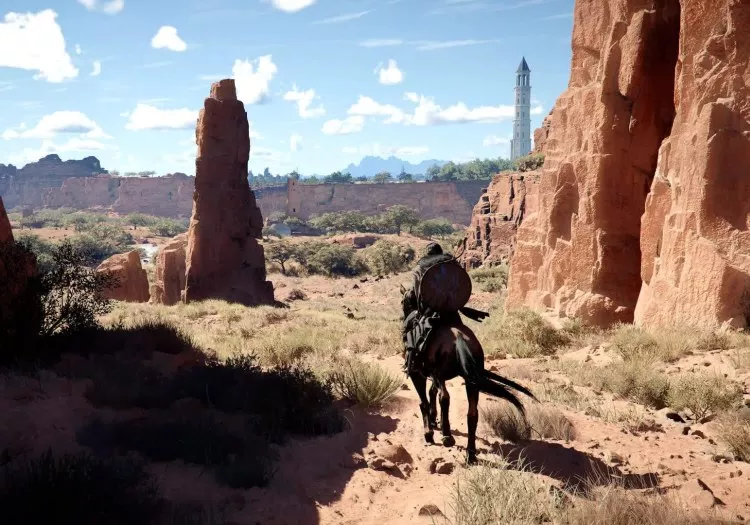
![Crimson Desert Optimization: Best Settings for Performance and Visual Quality]()
Crimson Desert Optimization: Best Settings for Performance and Visual Quality
Crimson Desert looks great and runs well on most PCs, but some settings introduce visual noise and inefficiencies. We break down every option to find the best balance of image quality and performance. -
![Crimson Desert Benchmark: 40 GPUs Tested]()
Crimson Desert Benchmark: 40 GPUs Tested
We benchmarked Crimson Desert across 40 GPUs to see how it performs at 1080p, 1440p, and 4K. Here's what to expect from your system - and how well it's optimized for modern hardware. -
![Testing AMD FSR 4.1: Sharper Images, But DLSS Still Leads]()
Testing AMD FSR 4.1: Sharper Images, But DLSS Still Leads
AMD's upcoming FSR 4.1 update promises clearer detail and less motion blur. We tested the new upscaler against FSR 4 and Nvidia's DLSS 4.5 to see how much image quality has improved. -
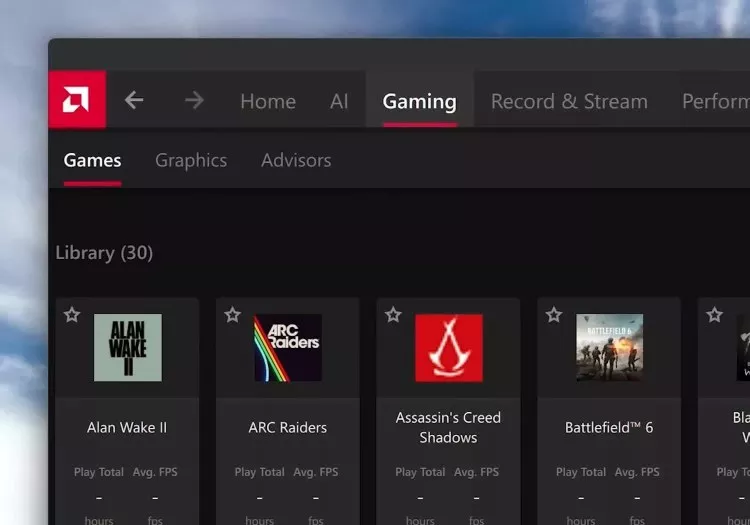
![DLSS vs FSR vs XeSS Support Across 650+ Games]()
DLSS vs FSR vs XeSS Support Across 650+ Games
We analyze over 650 PC games to compare DLSS, FSR, and XeSS support to reveal how far Nvidia, AMD, and Intel really are from each other in upscaling and frame generation adoption.


No products matched your criteria.
Try refining your search or go back to the popular listing.