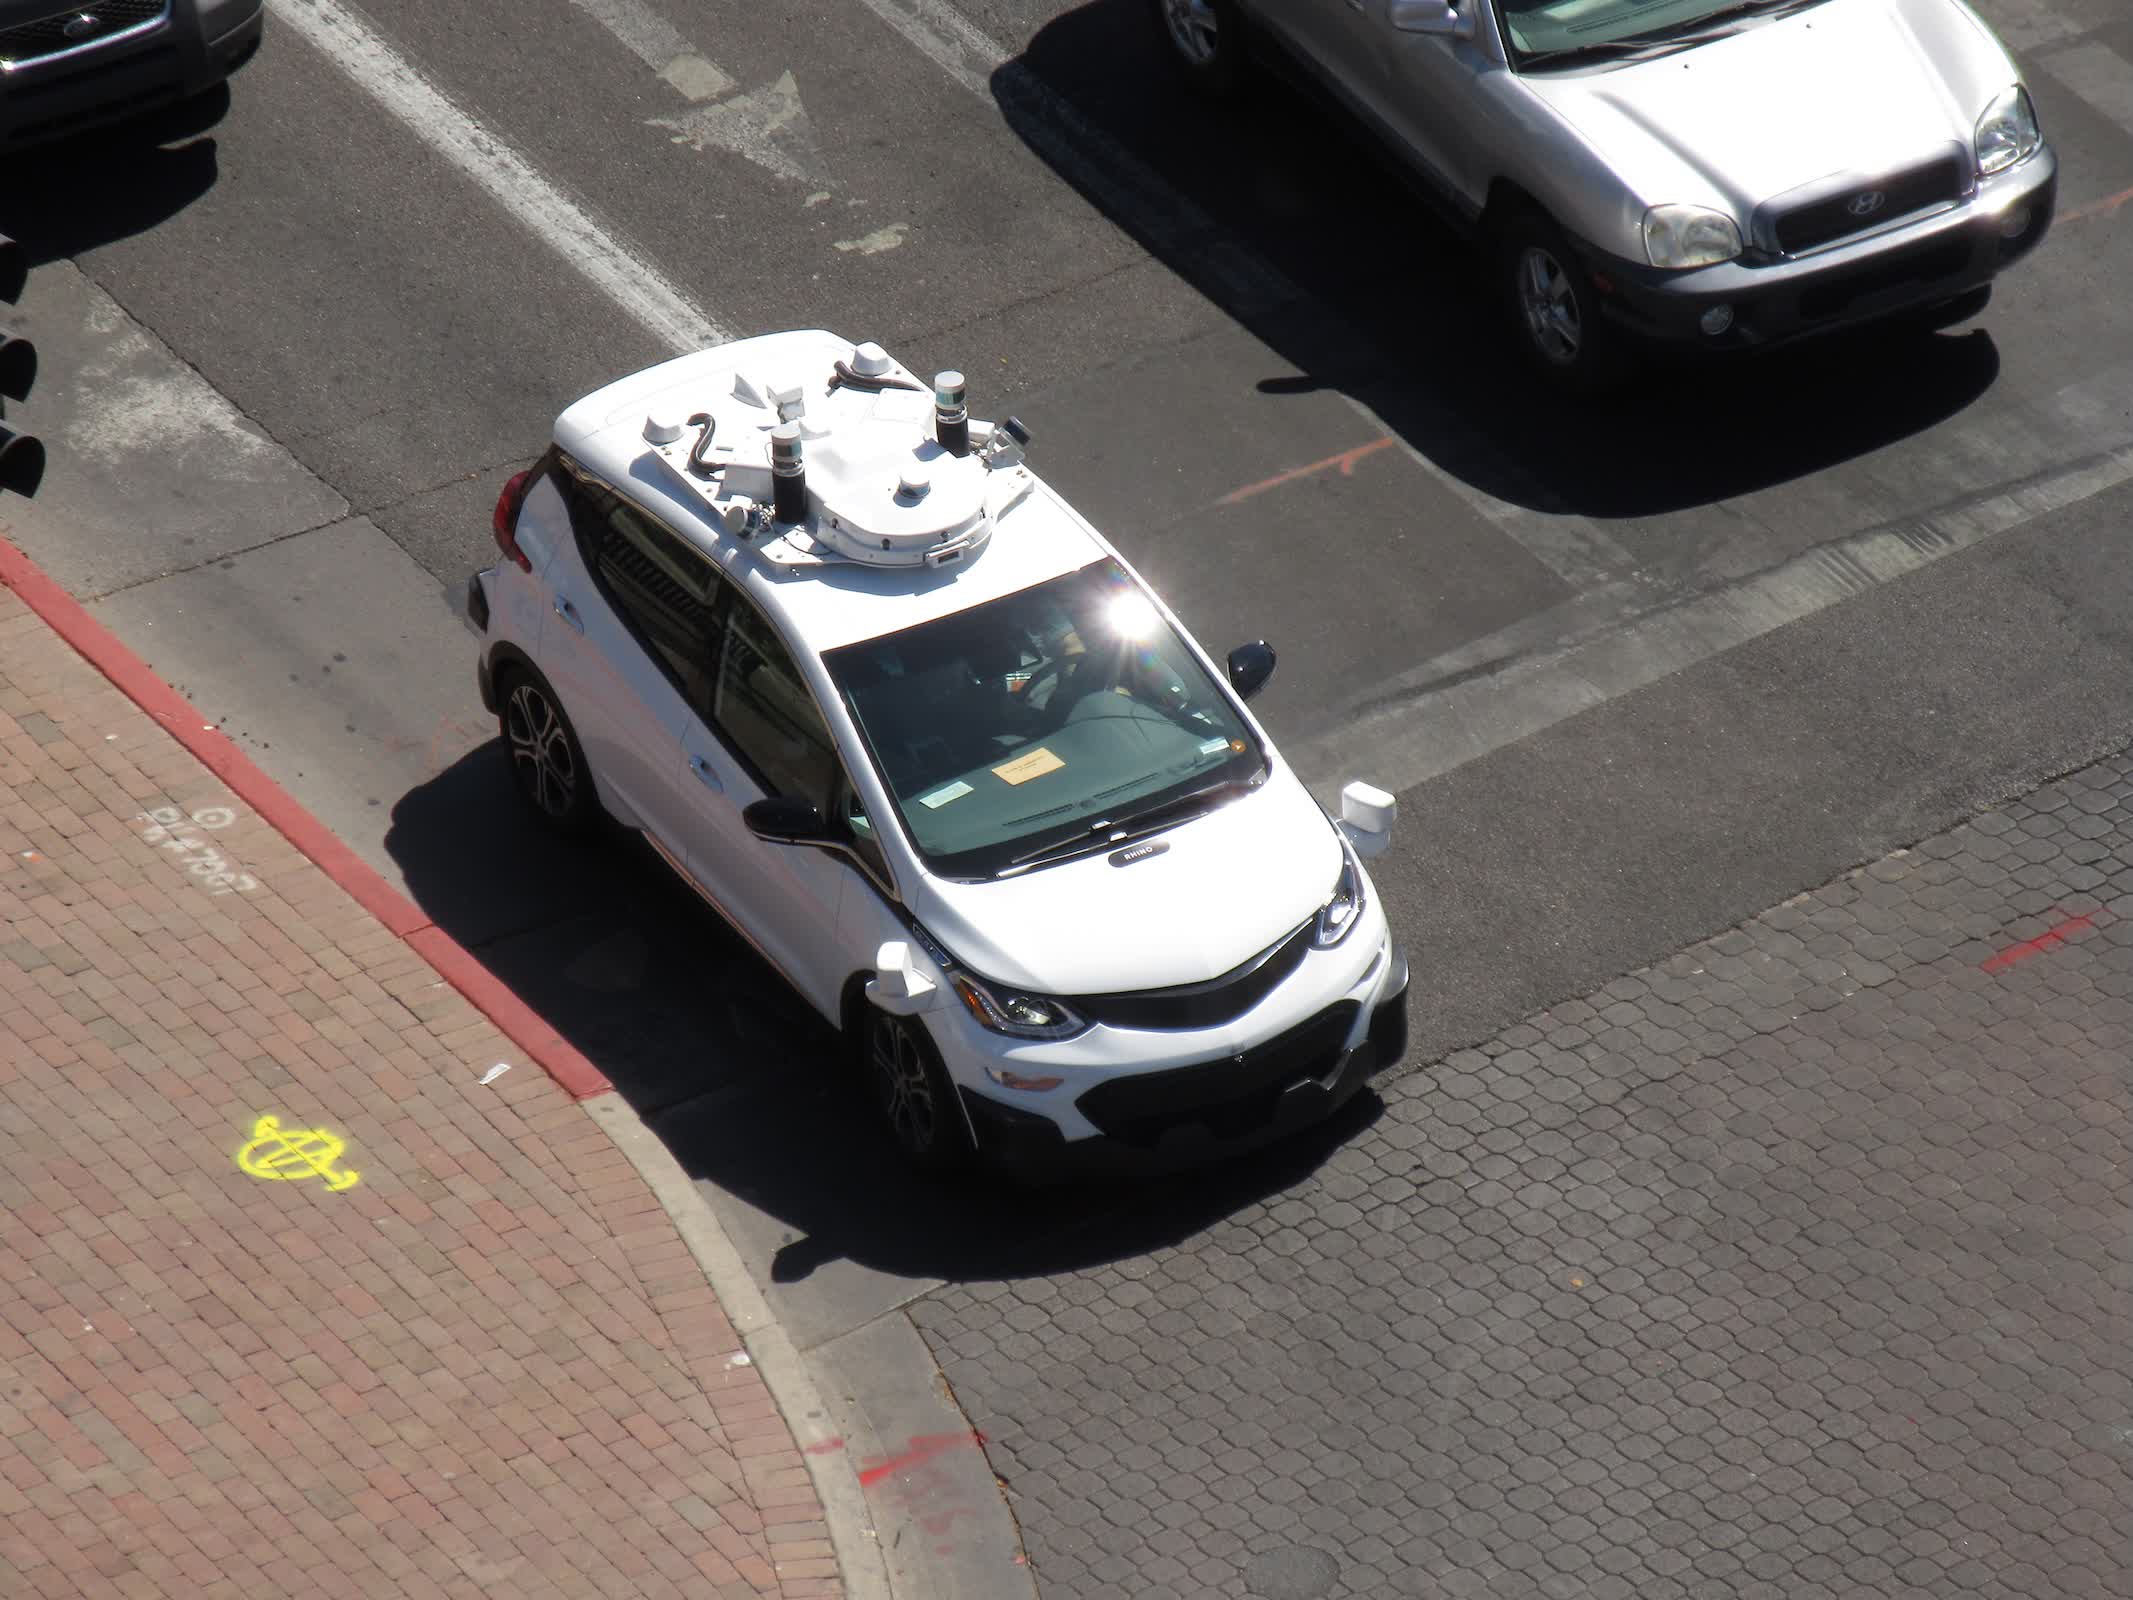
Bottom line: Waymo's self-driving taxis are now logging enough miles to produce meaningful safety data, and an independent review suggests they crash less often than human drivers, though the comparison comes with important qualifications. The Insurance Institute for Highway Safety analyzed federal crash data from 2021 through 2024 and found that Waymo vehicles were involved in fewer police-reportable crashes per mile driven.
Over roughly 50 million autonomous miles, Waymo recorded 1.28 crashes per million miles traveled, compared with 4.06 for human drivers. That works out to a 68% lower crash rate for incidents serious enough to typically be reported.
The analysis centers on Level 4 autonomous systems, which can operate without a driver in specific, mapped areas. Waymo is currently the most established operator in that category. Its robotaxi service operates in 11 US cities and has completed tens of millions of trips, giving researchers a relatively large dataset to work with.
To make the comparison meaningful, the IIHS had to account for differences in reporting. Autonomous vehicle operators are required to report minor incidents, while human drivers often do not report small fender benders. The study excluded those lower-level crashes to focus on more comparable events. After those adjustments, Waymo still showed both fewer crashes and generally less severe ones.
The company's technology likely plays a role in that outcome. Waymo vehicles rely on a combination of LiDAR, radar, and cameras to track their surroundings in real time. The system does not get tired or distracted, and it responds consistently.
Still, the data turned up some unexpected results. Despite using sensors that do not depend on visible light, Waymo vehicles had a higher share of crashes in dark conditions than human drivers.
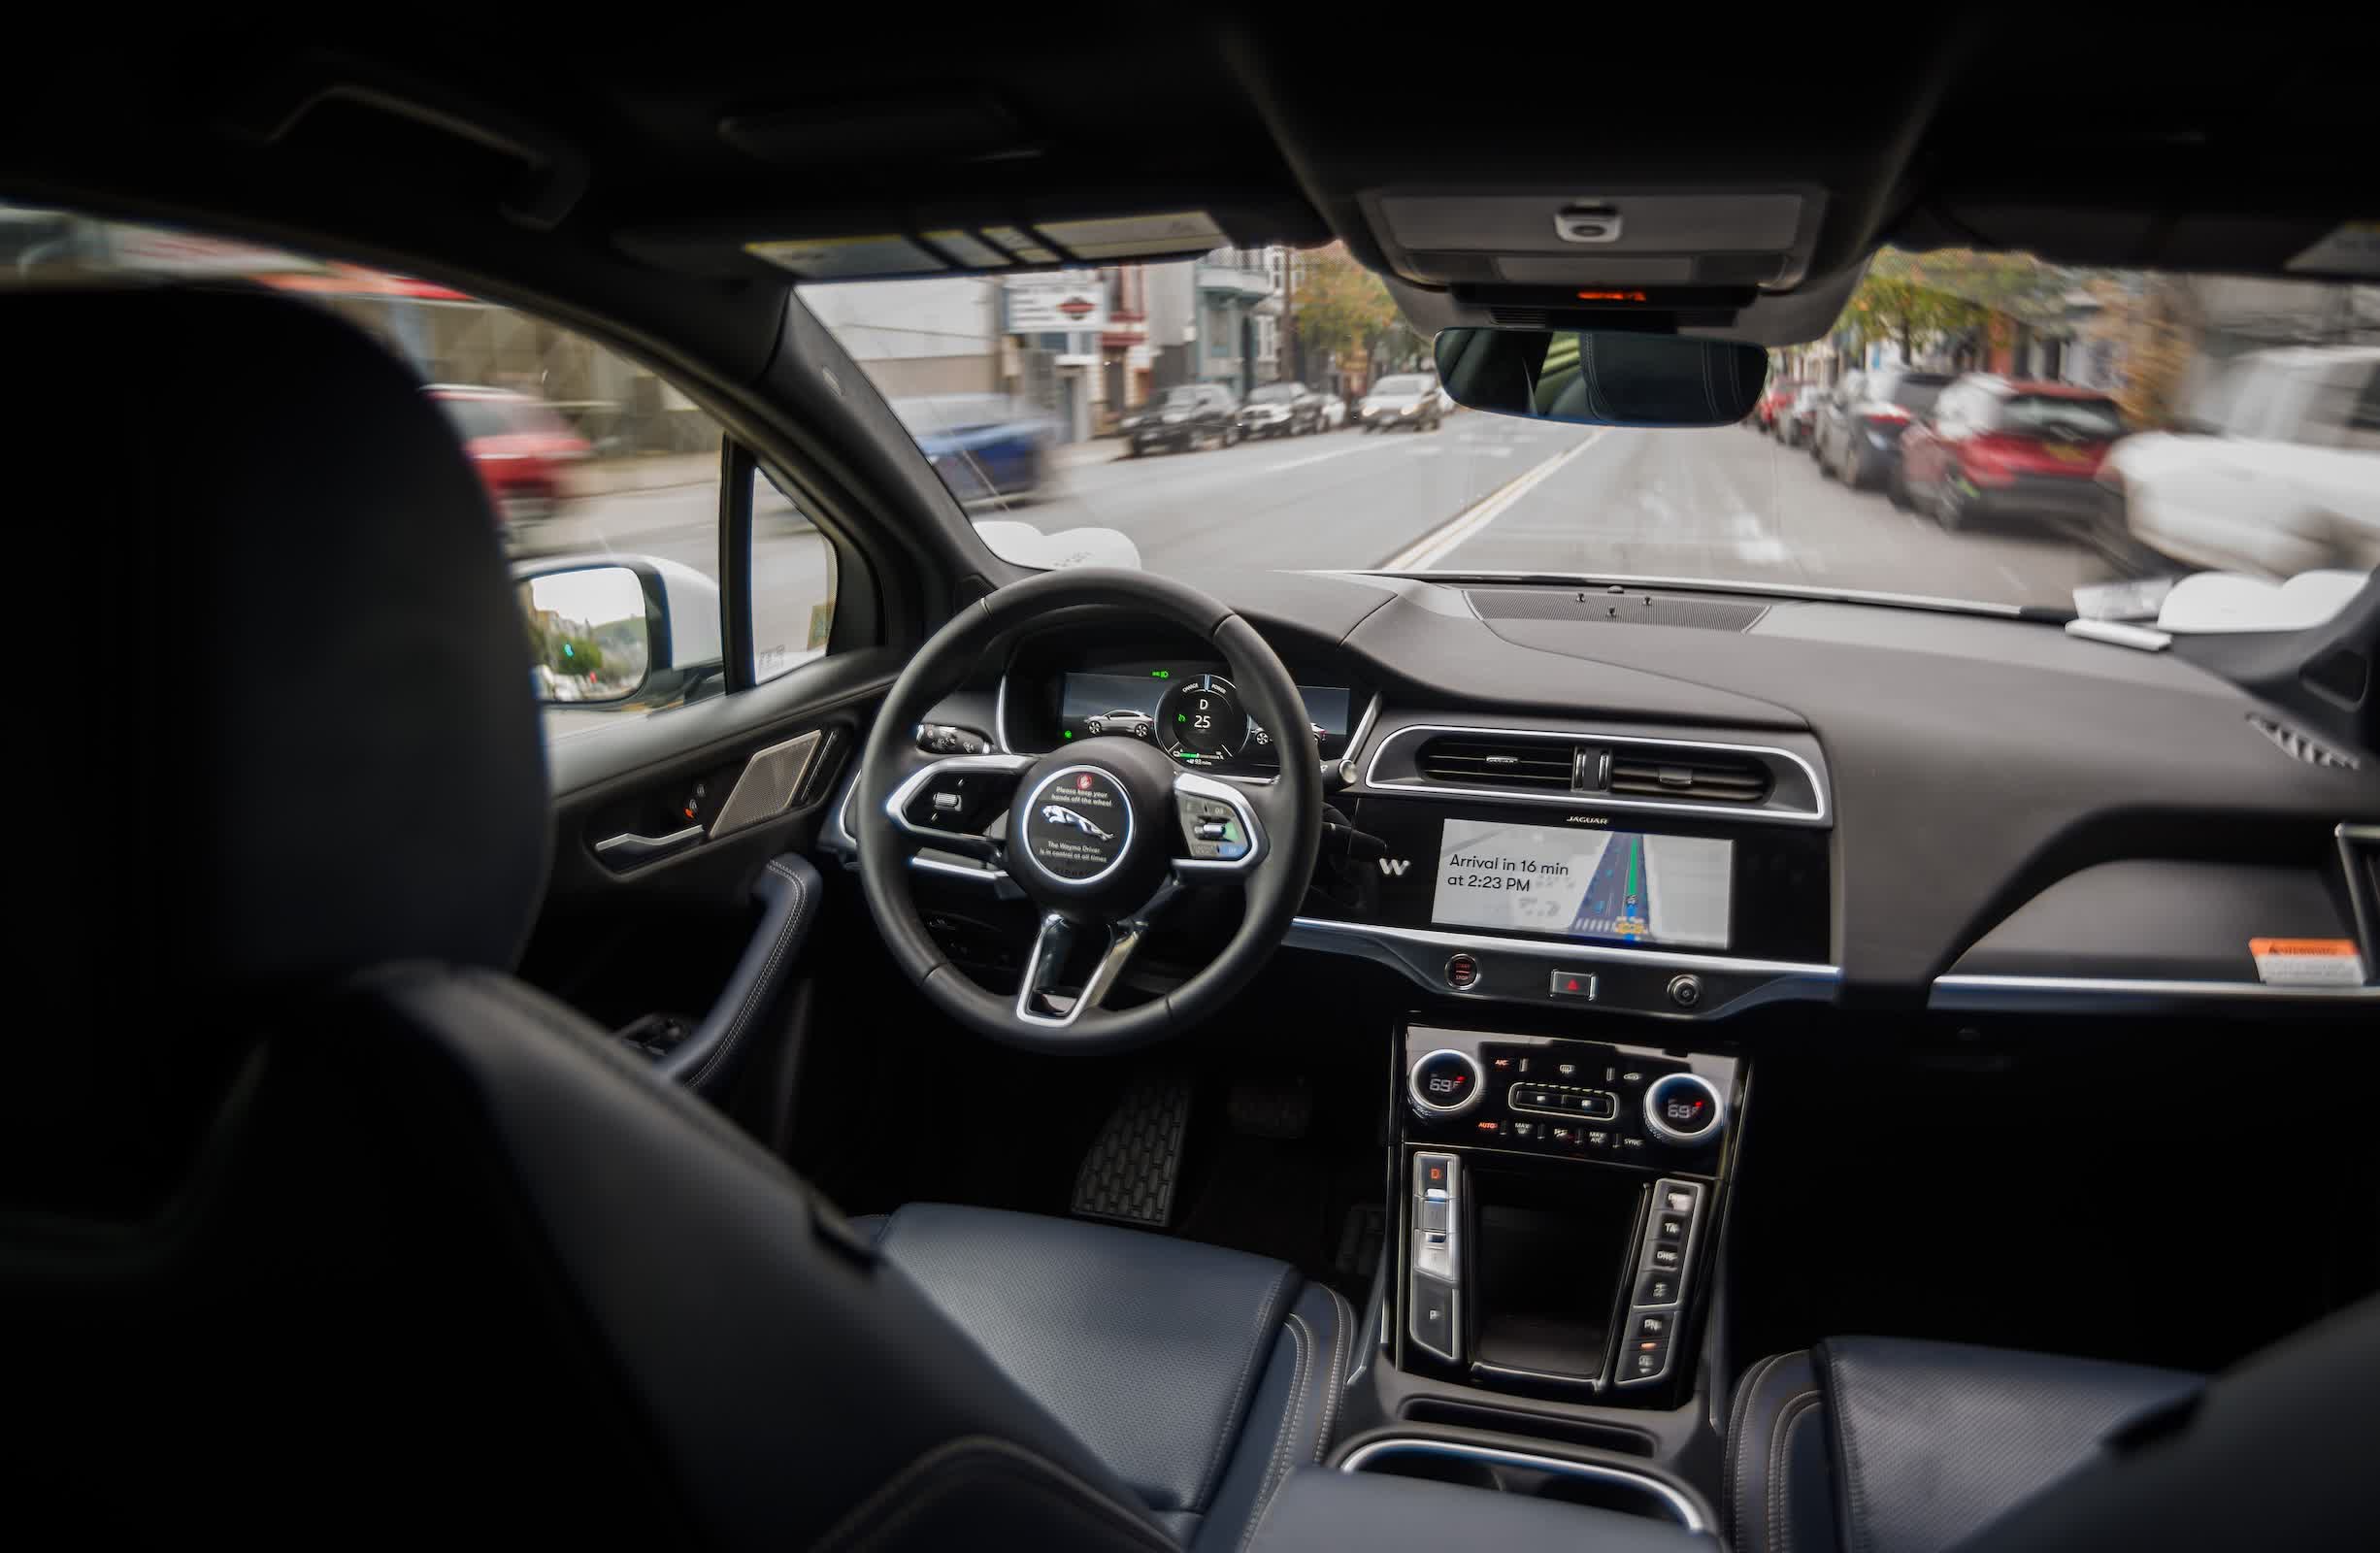
Performance also varied by market. The lower crash rate held in Phoenix, San Francisco, and Los Angeles, where Waymo has its most established operations. Austin was the exception, with a slightly higher crash rate than human drivers during the study period. That appears to be tied to limited mileage, as the company was still testing there and had not yet rolled out full public service.
The findings align with earlier safety claims from Waymo, including company-backed studies that pointed to reductions in injury-related crashes and improved safety for pedestrians and cyclists. Those reports were peer-reviewed but still originated from Waymo itself, making independent analysis like the IIHS study more significant.
At the same time, the report highlights gaps in how autonomous vehicle data is collected and compared. Companies must report crashes, but they are not required to disclose how many miles their vehicles drive. Waymo does share that information, which makes this type of analysis possible, but the lack of consistent reporting across the industry limits broader comparisons.
There is also the question of what counts as a fair benchmark. The study compares autonomous vehicles with the "average" human driver, which includes people who are distracted, fatigued, or impaired. Autonomous systems are designed to operate at a consistent level of performance, so the comparison may not reflect how they stack up against an attentive, unimpaired driver.
Where and how the vehicles operate also affects the numbers. Waymo does not operate on highways, where crash rates are typically lower. Instead, its vehicles operate mostly on city streets. Even within that category, they tend to drive on lower-speed roads. Half of Waymo's crashes occurred on streets with speed limits under 25 miles per hour, compared with just 8% for human drivers. Lower speeds generally result in less severe crashes, which likely influences the results.
Another factor is occupancy. Nearly half of Waymo's miles were driven without passengers in the vehicle. That reduces the chance of injuries inside the car, though it also raises questions about efficiency and the impact of empty vehicles on traffic levels.
The data show that Waymo's system is performing well in the environments where it currently operates, particularly in dense urban settings. But they also make clear that the safety gap depends on how the comparison is structured and where the vehicles are deployed. As more miles are logged and reporting becomes more standardized, those distinctions will matter just as much as the headline numbers.