The big picture: Researchers estimate that today's worldwide data creation rate sits at more than 325 million terabytes per day. So how much time do we spend actually consuming it? A recent study answers that question by analyzing the average amount of daily screen usage by country. Spoiler alert: it's a lot more than most of us realize, and it's definitely more than we'd like to admit.
Electronics Hub created the report on average screen time and usage using DataReportal's 2023 global overview and sleep data gathered from Sleep Cycle, a popular sleep analysis application. The sleep data allowed researchers to compare the average number of hours users were awake against the amount of screen time reported in DataReportal's overview. So, what were the results?
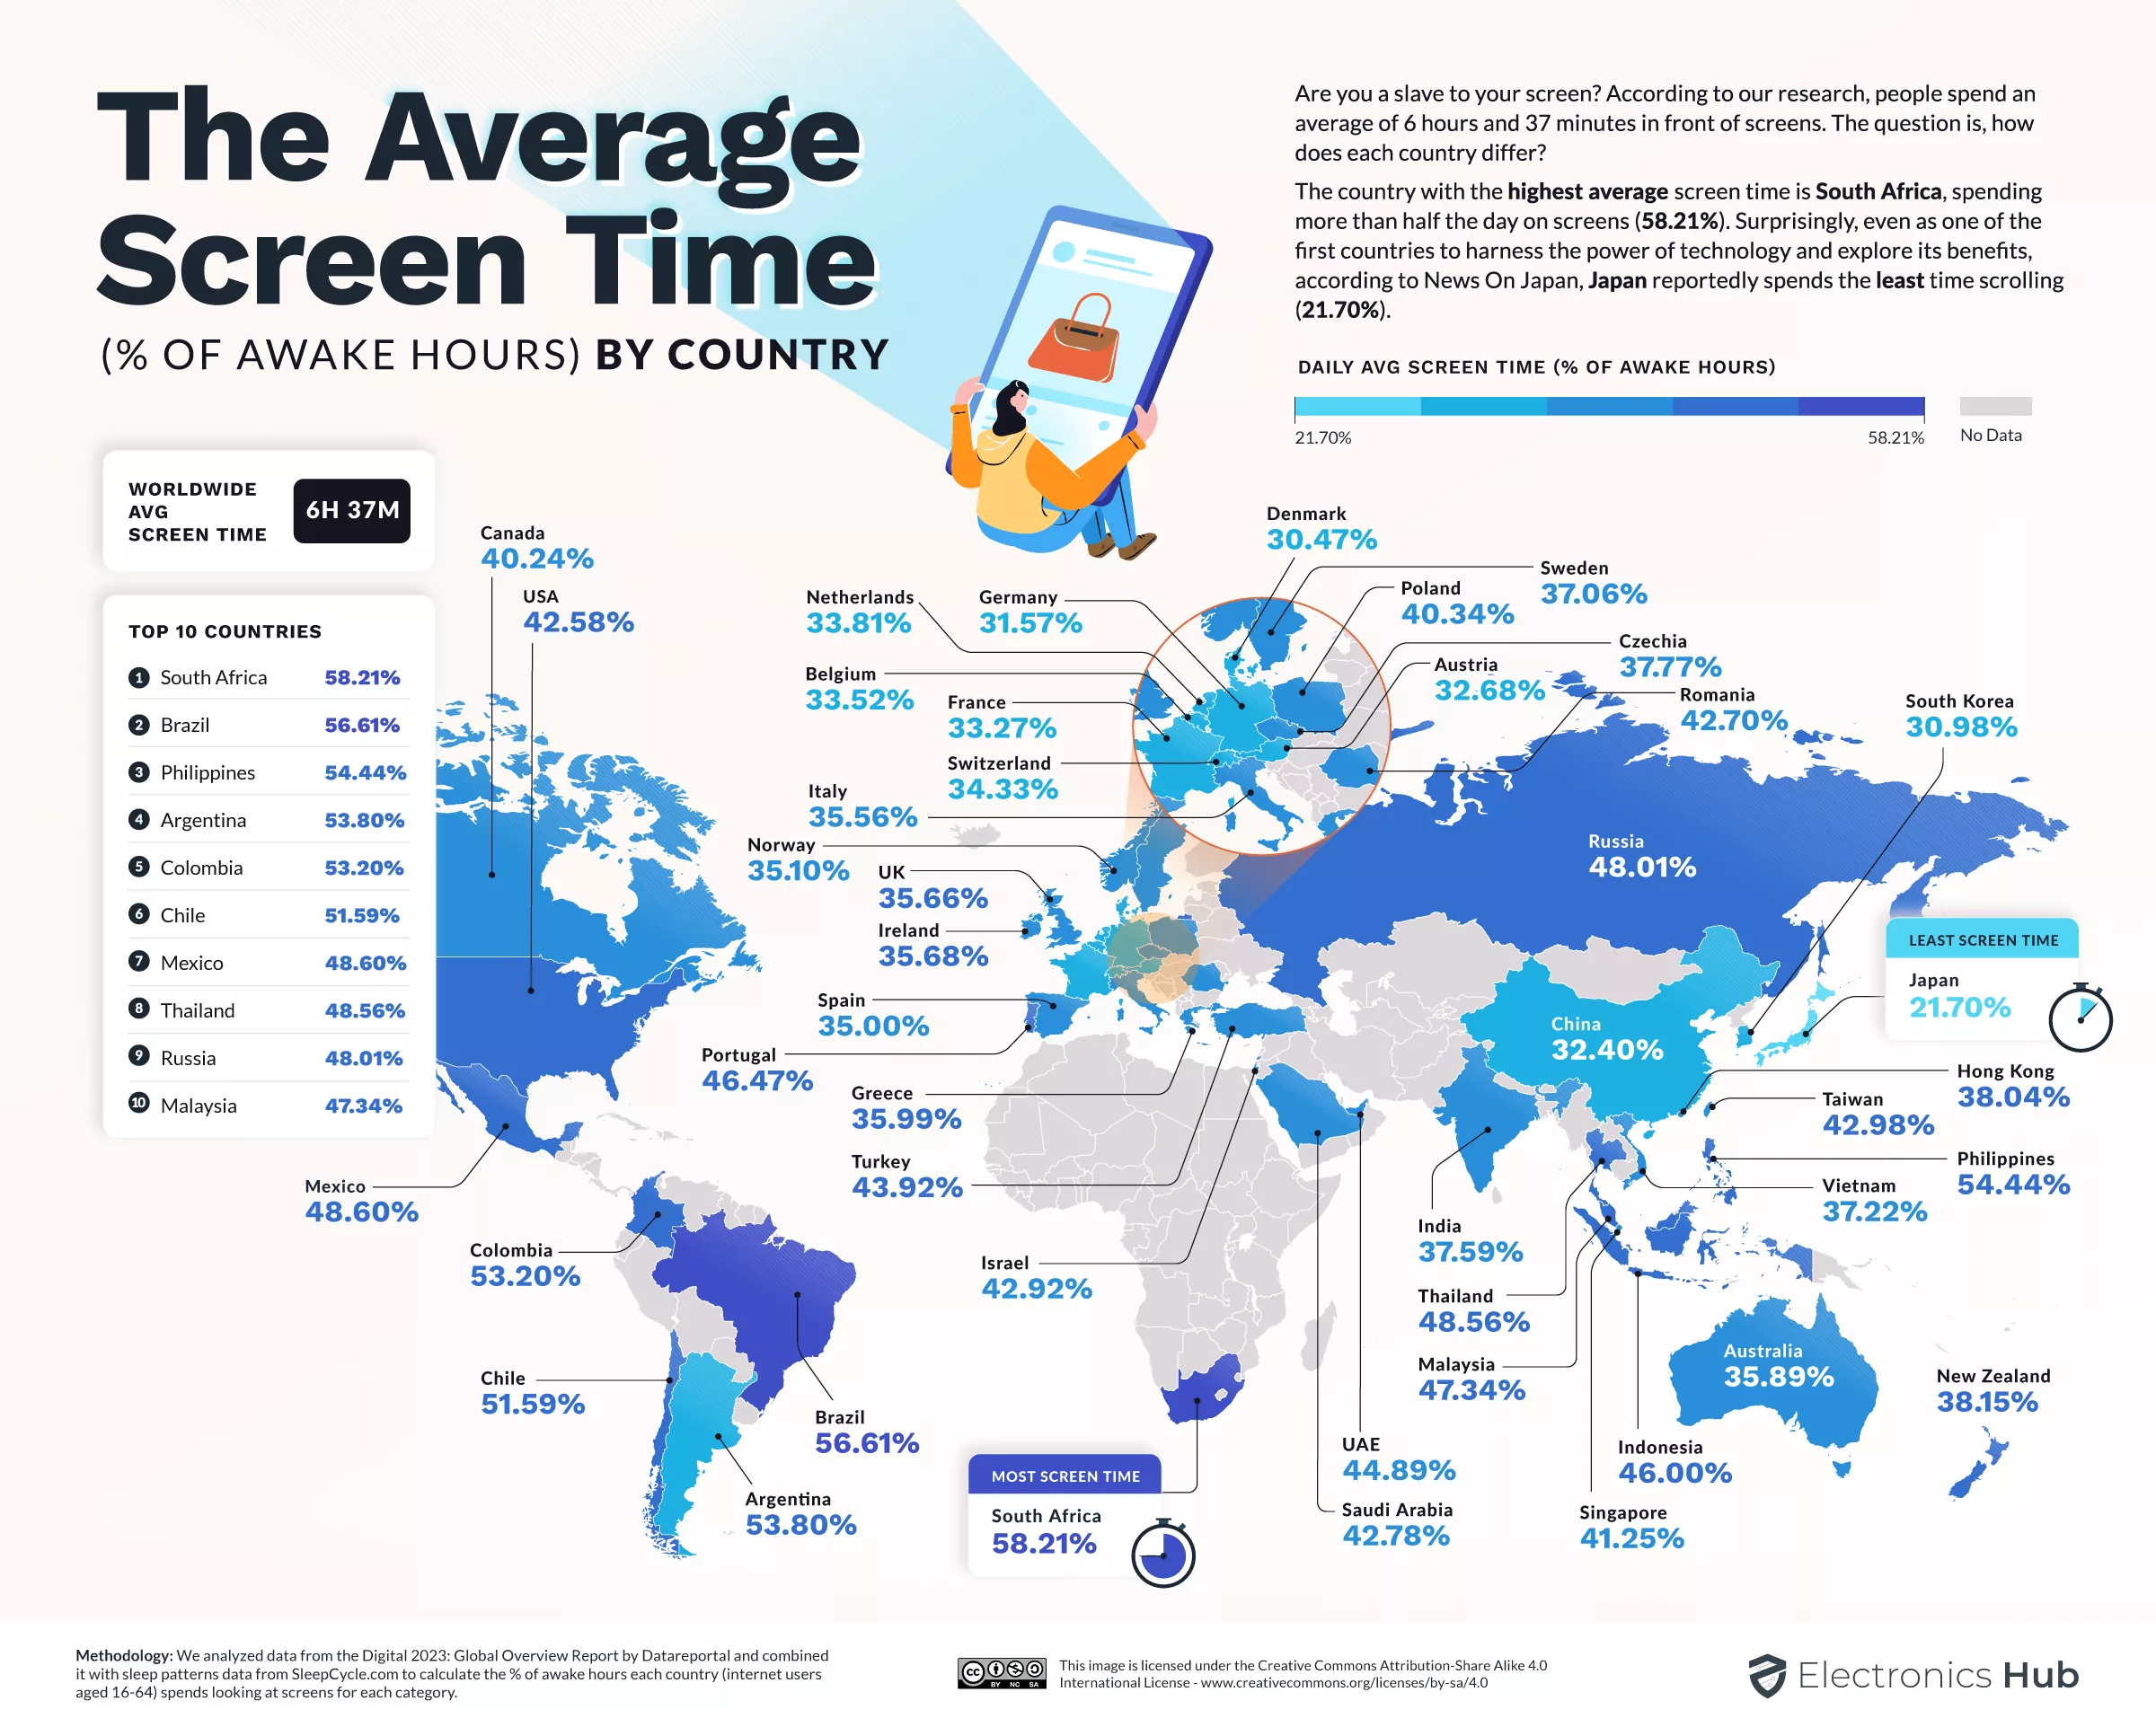
We spend a lot of time taking in everything that the internet has to give. According to the findings, users worldwide average 6 hours and 37 minutes of screen time per day. If that same user is awake for 16 to 18 hours per day, then they are spending more than 35 to 40 percent of their day engrossed by some form of electronic content.
Breaking down the data by country gives a better view of how users are diving nose-first into the internet's ocean of information. South African countries topped the charts, clocking in with an astounding 58.2% of their day dedicated to overall screen time. By comparison, the country with the lowest utilization, Japan, averages 21.7% of their waking hours looking at some type of screen.

The report goes on to identify which countries are the largest consumers by type of device and activity.
The Philippines, Brazil, South Africa, and Thailand rounded out the top four for highest percentage of time spent on their phones, all coming in above 30%.
South African and Russian users were found to spend more than 25% their waking days at computer screens. And when it comes to gaming, Saudi Arabia is the clear winner, with users logging almost 11.5% of their waking time in-game.

With so much screen time and so much data created, the question becomes "what types of data are we actually consuming?" According to Exploding Topics, the top three contributors to the world's daily footprint consist of video (53.72%), social and social media (12.69%), and gaming (9.86%).
Based on these numbers, more than 75% of the data consumed is – you guessed it – attributable to services and activities such as TikTok, YouTube, Facebook, and video gaming.
While it may feel entertaining, these high amounts of screentime have a lot of downsides. Multiple studies have shown that increased screen time leads to conditions such as obesity, insomnia, changes in cognition, and development of other addictive behaviors.
There's also an environmental impact that often goes unconsidered. Internet content means data, data means data centers and equipment, and that equipment means greenhouse gases. While some companies are taking steps to reduce or offset those footprints, the real answer may be as simple as putting the devices down and taking a few steps outside once in a while.