TechSpot Reviews
Comprehensive tech reviews: From CPUs and graphics cards, to laptops and smartphones.
-
Graphics Cards
Nvidia RTX 5070 Ti vs AMD Radeon 9070 XT: Massive 52 Game Benchmark
-
Hardware
How Much RAM Do Gamers Need? 8GB vs. 16GB vs. 32GB vs. 64GB
-
CPU
We Tested Every Ryzen 5 and 7 X3D CPU: From 5800X3D to 9800X3D
-
Hardware
DDR5 Prices Are Broken, So We Tested Cheaper Chinese RAM
-
Graphics Cards
Nvidia's RTX 70 Series, Ranked: From the 2070 to the 5070
Latest Reviews
-
![Intel Arc Pro B70 Tested: The Gaming GPU Intel Never Released]()
Intel Arc Pro B70 Tested: The Gaming GPU Intel Never Released
Intel never released the Arc B770, but the Arc Pro B70 may show us exactly what it would have looked like. We test Intel's workstation Battlemage GPU in 12 modern games. -
![Does the Nvidia App Hurt Performance? We Benchmarked It.]()
Does the Nvidia App Hurt Performance? We Benchmarked It.
Does the Nvidia App really hurt gaming performance? We benchmarked its background app, overlay, recording, and filters to see what affects frame rates and whether it is worth keeping installed. -
![AMD Radeon RX 9070 GRE Review: An Awkward Addition to the Lineup]()
AMD Radeon RX 9070 GRE Review: An Awkward Addition to the Lineup
The Radeon RX 9070 GRE arrives outside China, but a year-old GPU with 12GB of VRAM and a $550 price tag struggles to justify its place in AMD's increasingly crowded lineup. -
![Dell Alienware AW2726DM Review]()
Dell Alienware AW2726DM Review
The Dell Alienware AW2726DM makes OLED gaming more accessible than ever with its aggressive $350 price point, while still delivering excellent motion clarity, deep contrast, and 240Hz refresh rates. -
![Nvidia RTX 5070 Ti vs AMD Radeon 9070 XT: Massive 52 Game Benchmark]()
Nvidia RTX 5070 Ti vs AMD Radeon 9070 XT: Massive 52 Game Benchmark
We benchmark the Radeon RX 9070 XT and GeForce RTX 5070 Ti across 52 games, testing rasterization and ray tracing performance at 1440p and 4K. -
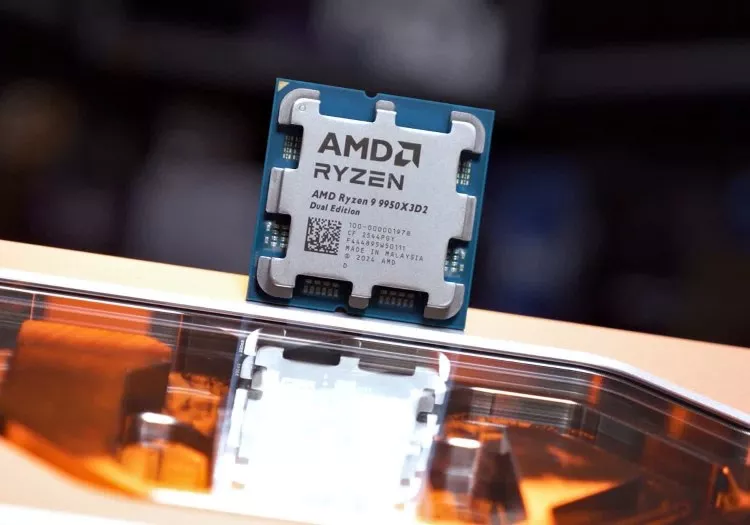
![AMD Ryzen 9 9950X3D2 Review: Twice the 3D V-Cache]()
AMD Ryzen 9 9950X3D2 Review: Twice the 3D V-Cache
AMD finally delivers dual 3D V-Cache on Zen 5 with the 9950X3D2, but does twice the cache translate into real gains? We test performance, power, and value to see if this flagship makes sense. -
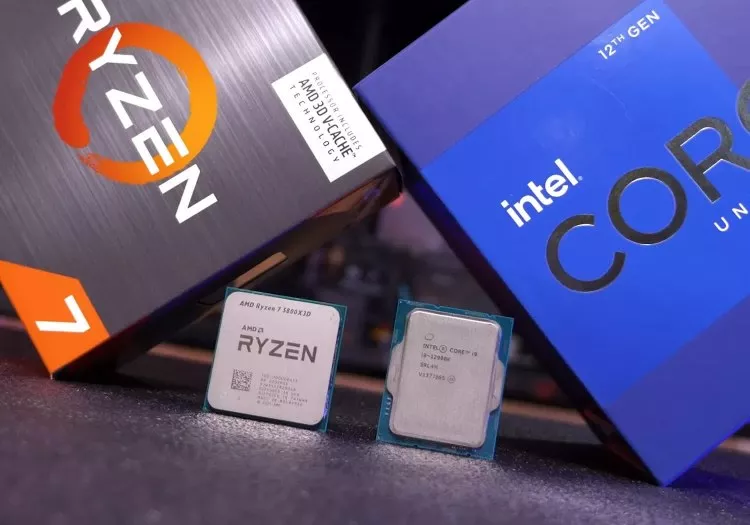
![Flagship Rematch: Ryzen 7 5800X3D vs. Core i9-12900K]()
Flagship Rematch: Ryzen 7 5800X3D vs. Core i9-12900K
Four years on, we revisit the Ryzen 7 5800X3D vs Core i9-12900K with modern games and DDR4 vs DDR5 configs. The result: still neck and neck, but memory choice now makes a real difference. -
![We Tested Every Ryzen 5 and 7 X3D CPU: From 5800X3D to 9800X3D]()
We Tested Every Ryzen 5 and 7 X3D CPU: From 5800X3D to 9800X3D
Nine X3D CPUs, two platforms, and 14 games tested. We compare every Ryzen 5 and 7 X3D processor to find out how much performance has improved since the 5800X3D and where it actually matters. -
![AMD Ryzen 5 5500X3D Review: AM4 Keeps on Giving]()
AMD Ryzen 5 5500X3D Review: AM4 Keeps on Giving
AMD's Ryzen 5 5500X3D extends AM4's life once again, but is it worth it? We tested 14 games to see how this cut-down 3D V-Cache chip stacks up against Zen 3, older Ryzen parts, and newer CPUs. -
![Nvidia RTX 5070 Ti Roundup: 9 Graphics Cards Tested]()
Nvidia RTX 5070 Ti Roundup: 9 Graphics Cards Tested
We tested nine RTX 5070 Ti cards and found consistent performance throughout. The problem isn't which model to buy - it's whether any of them make sense at today's prices. -
![Intel Core Ultra 7 270K Plus Review: AMD Needs to Respond]()
Intel Core Ultra 7 270K Plus Review: AMD Needs to Respond
Intel's Core Ultra 7 270K Plus pushes beyond the 250K Plus with more cores and cache for $300. It costs more, but could be a strong value for high-end productivity workloads. -
![Intel Core Ultra 5 250K Plus Review: They Did It]()
Intel Core Ultra 5 250K Plus Review: They Did It
Intel's Core Ultra 5 250K Plus fixes what the 200 series got wrong, delivering blistering productivity performance and competitive gaming at $200, making it one of Intel's most compelling budget CPUs yet. -
![Just for Fun: We Tested MSI's "RTX 5090 Ti" You Probably Can't Buy]()
Just for Fun: We Tested MSI's "RTX 5090 Ti" You Probably Can't Buy
MSI's RTX 5090 Lightning Z is a limited-run halo product built without practical constraints. We test its thermals, power draw, and performance to see what's possible at the extreme end of GPU design. -
![DDR5 Prices Are Broken, So We Tested Cheaper Chinese RAM]()
DDR5 Prices Are Broken, So We Tested Cheaper Chinese RAM
With DDR5 prices quadrupling as AI demand drains supply, we tested CXMT Chinese memory to see how it stacks up against premium and budget kits in gaming. -
![Cherry Xtrfy MX 8.2 Pro TMR Keyboard Review]()
Cherry Xtrfy MX 8.2 Pro TMR Keyboard Review
Cherry's MX 8.2 Pro TMR is its first magnetic keyboard using tunnel magnetoresistance tech instead of Hall Effect, promising ultra-fast wireless performance and rare hot-swap support for mechanical switches. -
![AMD Ryzen 7 9850X3D Review]()
AMD Ryzen 7 9850X3D Review
AMD's Ryzen 7 9850X3D promises the fastest gaming performance yet, with higher clocks and a small price bump. But does it deliver real gains, or is it just more hype? -
![The Ryzen 7 5800X3D Revisited, Four Years Later]()
The Ryzen 7 5800X3D Revisited, Four Years Later
We revisit the Ryzen 7 5800X3D and 5700X3D to see how they hold up in modern games, updating our benchmarks and comparing them against today's CPUs across multiple generations. -
![AMD Zen 3's Second Act: Revisiting the Ryzen 5600X, 5700X, and 5800XT]()
AMD Zen 3's Second Act: Revisiting the Ryzen 5600X, 5700X, and 5800XT
DDR5 pricing has pushed gamers back to AMD's AM4 platform. With Zen 3D chips gone, CPUs like the 5600X, 5700X, and 5800XT are resurging, so we retested them across 14 games. -
![How Much RAM Do Gamers Need? 8GB vs. 16GB vs. 32GB vs. 64GB]()
How Much RAM Do Gamers Need? 8GB vs. 16GB vs. 32GB vs. 64GB
As modern games push memory harder, choosing the right amount of RAM matters more than ever. With DRAM pricing in flux, we revisit the big question: is 16GB still enough for gaming? -
![Best Value X3D: AMD Ryzen 5 7500X3D Review]()
Best Value X3D: AMD Ryzen 5 7500X3D Review
AMD's CPU binning spree continues with the Ryzen 5 7500X3D, a cut-down, cache-heavy offshoot of the 7800X3D lineage. An OEM chip that somehow landed at retail, it raises plenty of questions. -
![Upgrading During the DRAM Apocalypse with AMD's $75 CPU]()
Upgrading During the DRAM Apocalypse with AMD's $75 CPU
We once told people to avoid the Ryzen 5 5500. Years later, it's a top-selling CPU. With DDR5 prices spiraling, has this budget Zen 3 chip become the right choice after all? -
![No Ryzen Killer: Intel Core Ultra 5 225F Review]()
No Ryzen Killer: Intel Core Ultra 5 225F Review
Almost no one asked for it, but curiosity won out. We're taking a close look at Intel's Core Ultra 5 225F–a locked, budget-focused CPU that's been quietly sitting on shelves for nearly a year. -
![Nvidia RTX 5050 vs Intel Arc B580: Budget GPU Battle]()
Nvidia RTX 5050 vs Intel Arc B580: Budget GPU Battle
Which $250 GPU is the better buy: Nvidia's RTX 5050 or Intel's Arc B580? We compare performance, upscaling quality, and VRAM limits to find out. -
![6 Years of Mid-Range Radeon GPUs Tested: The 9070 Comes Out on Top]()
6 Years of Mid-Range Radeon GPUs Tested: The 9070 Comes Out on Top
We look back at six years of $500-tier Radeon cards to see where the new RX 9070 lands - and whether it finally delivers the leap AMD's midrange has needed. -
![DDR5 vs. DDR4 Gaming Performance Revisited]()
DDR5 vs. DDR4 Gaming Performance Revisited
With DDR5 prices still rising, DDR4 vs. DDR5 is back in focus as we test whether pairing DDR4 with a budget Intel Core i5 CPU can offset the cost of DDR5 and challenge the Ryzen competition. -
![AMD Ryzen 5 7500F vs. Intel Core i5-12400F: What's the Best Budget CPU?]()
AMD Ryzen 5 7500F vs. Intel Core i5-12400F: What's the Best Budget CPU?
We compare the budget friendly Core i5 12400F and Ryzen 5 7500F to see which CPU still delivers the best value in modern games using updated hardware and consistent test conditions. -
![AMD Radeon RX 9060 Review: The Non-XT GPU]()
AMD Radeon RX 9060 Review: The Non-XT GPU
AMD's RX 9060 lineup is confusing. Two cards share one name, performance varies widely, and the non XT model hides in OEM systems. We bought a full PC to see how it really performs. -
![Nvidia's RTX 70 Series, Ranked: From the 2070 to the 5070]()
Nvidia's RTX 70 Series, Ranked: From the 2070 to the 5070
We compare six years of Nvidia's RTX 70 series, from the 2070 to the new 5070, to see whether the latest card truly moves forward or simply holds the line in performance and value. -
![AMD Ryzen 5 9500F Review]()
AMD Ryzen 5 9500F Review
AMD's Ryzen 5 9500F is generating plenty of buzz. We tested this cut-down 9600X - same cores, no iGPU, and slightly lower clocks - to see if it's a smart, affordable upgrade for your next build. -
![Asus ROG Swift PG27AQWP Review: 720Hz OLED]()
Asus ROG Swift PG27AQWP Review: 720Hz OLED
720Hz OLED is finally here. Asus' ROG Swift PG27AQWP pushes 540Hz at 1440p or a wild 720Hz at 720p, making it the fastest desktop OLED we've tested.
No products matched your criteria.
Try refining your search or go back to the popular listing.