
It has been almost a year since we first examined Intel's latest Arrow Lake architecture in the form of the Core Ultra desktop series. Since then, the outlook for the blue team has been rocky. We would not say the Core Ultra series was bad – in fact, quite the opposite – but it never managed to be especially compelling. Performance generally trailed competing Ryzen parts, sometimes only by a small margin, while carrying equal or higher price tags. On top of that, the platform issues left no future upgrade prospects for those investing in Intel's latest hardware.
The Core Ultra 7 265K launched at $395 and, for its first few months, floated between $390 and $430, though sales were extremely slow. Earlier this year, prices began to drop as demand remained weak, and today it is easy to purchase a 265K for $310, with prices occasionally dipping as low as $290.

At this discounted price, is the Core Ultra 265K an attractive option for gamers? To find out, we prepared CPU and GPU scaling tests, comparing Intel's chip against the Ryzen 9700X, along with the 7600X and 9800X3D.
| Core Ultra 7 265K | Core i7-14700K | Core i5-14600K | Ryzen 5 7600X | Ryzen 7 9700X | |
|---|---|---|---|---|---|
| Release date | Oct 2024 | Oct 2023 | Sep 2022 | Jul 2024 | |
| Release price | $395 | $420 | $330 | $299 | $359 |
| P-core Cores (threads) | 8 (8) | 8 (16) | 6 (12) | 6 (12) | 8 (16) |
| P-core Freq. | 3.9 GHz | 3.4 GHz | 3.5 GHz | 4.7 GHz | 3.8 GHz |
| P-core Turbo | 5.5 GHz | 5.6 GHz | 5.3 GHz | 5.3 GHz | 5.5 GHz |
| P-core L2 cache | 24 MB | 16 MB | 12 MB | 6 MB | 8 MB |
| E-core Cores (threads) | 12 (12) | 12 (12) | 8 (8) | - | - |
| E-core Freq. | 3.3 GHz | 2.5 GHz | 2.6 GHz | - | - |
| E-core Turbo | 4.6 GHz | 4.3 GHz | 4.0 GHz | - | - |
| E-core L2 cache | 12 MB | 12 MB | 8 MB | - | - |
| L3 cache | 30 MB | 33 MB | 24 MB | 32 MB | 32 MB |
| Power Base | 125 W | 105 W | 65 W | ||
| Power Max Turbo | 250 W | 253 W | 181 W | 142 W | 142 W |
For this testing, we selected four games. Yes, only four, but as always, we will give you the usual disclaimer for readers new to this CPU and GPU scaling content. Each game was tested using two quality presets, medium and ultra, across three resolutions, with four different GPUs. That means a single game provides 48 data points, each based on the average of three runs.
This level of testing requires an enormous effort, even for one game, and generates half a dozen graphs to analyze. That being the case, it takes considerable time to test four games thoroughly, and just as long to go over all the data.

Beyond the medium and ultra presets and the three resolutions – 1080p, 1440p, and 4K – we included four GPU tiers: the GeForce RTX 5090, RTX 5080, RX 9070, and 9060 XT 16GB.
Normally, we would stick with Nvidia GPUs, but with the Radeon RX 9070 being quite popular and the 9060 XT 16GB appearing to offer top value right now, it made sense to include them. With that, let's get into the data.
Gaming Performance
Rainbow Six Siege X
1080p - Medium

Starting with the Rainbow Six Siege 1080p medium results, we see rather underwhelming performance from the 265K. For example, using the RTX 5090, the Ryzen 7 9700X was 23% faster, a massive margin. Even the older 7600X proved to be 10% faster, and the 9800X3D was over 40% faster, with almost 50% greater 1% lows.
Dropping down to the RTX 5080 still saw the 9700X delivering 13% stronger performance. It was a similar story with the 7600X, while the 265K managed just over 400 fps on average.
Even when paired with the RX 9070, the Core Ultra 7 struggled. While the Ryzen processors maxed out the GPU at 498 fps, the 265K averaged 463 fps. In fact, it was not until we moved to the 9060 XT that the Intel CPU was able to match the Ryzen processors, due to a strong GPU bottleneck.
1440p - Medium

At 1440p, the story remained the same: the 265K struggled to keep up with Ryzen. The 7600X was faster, holding a 6% lead with the GeForce GPUs, while the 9700X was nearly 20% faster with the RTX 5090.
4K - Medium

At 4K, the results were entirely GPU limited, even with the medium quality preset. As a result, no differences in performance were observed between these CPUs.
1080p - Ultra

Jumping back to the 1080p resolution, but this time with the Ultra preset, the Core Ultra 7 performed much more competitively. It was able to match the 1% low performance of the 9700X, even though the Ryzen processor still delivered 14% higher average frame rates. With the RTX 5080, results became heavily GPU limited, with the 265K coming close to fully utilizing the GPU. Performance with the RX 9070 and 9060 XT was also heavily GPU constrained.
1440p - Ultra

As expected, the 1440p Ultra results were largely GPU limited, with only minor variations observed when using the RTX 5090.
4K - Ultra

At 4K with Ultra settings, performance was fully GPU bound, leaving no meaningful differences between the CPUs.
Kingdom Come: Deliverance II
1080p, Medium

Next up is Kingdom Come: Deliverance II, starting again with the medium preset at 1080p. Here the 265K performed much better, matching the 7600X. The 9700X was only 5% to 8% faster on average, depending on the GPU used. However, once we switched to the Radeon GPUs, the results became heavily GPU limited, capping performance across all CPUs.
1440p, Medium

At 1440p, the 265K was still able to match the 7600X, but both trailed the 9700X more significantly than at 1080p, with Ryzen now 12% faster. With the RTX 5080, the results leveled out somewhat, though the 265K and 7600X still fell slightly behind in 1% lows.
4K, Medium

At 4K, performance became entirely GPU limited, with little difference between CPUs, even with the RTX 5090.
1080p, Ultra

Switching to Ultra at 1080p, scaling looked more in line with expectations. The 265K was 5% faster than the 7600X when paired with the RTX 5090, while the 9700X was just 4% faster than the Core Ultra 7. With the RTX 5080, results became mostly GPU limited, and with the Radeon GPUs, performance was fully capped.
1440p, Ultra

At 1440p Ultra, we found some unusual results. The 265K fell well behind with the RTX 5090, showing weaker than expected 1% lows and reduced average frame rates. A similar, though less severe, pattern appeared with the RTX 5080. With the RX 9070 and 9060 XT, results became fully GPU bound.
4K, Ultra

Even at 4K, the 265K showed a small performance drop with the RTX 5090, which was unexpected. It was also a few frames slower with the RTX 5080, though this was less significant. Still, the results were odd compared to expectations.
Marvel Rivals
1080p - Medium

Moving on to the Marvel Rivals data, we begin with the 1080p medium results. Here, the 265K performs reasonably well, though it sits closer to the 7600X than the 9700X. With the RTX 5090, it was just 3% faster than the 7600X but 5% slower than the 9700X, and 26% slower than the much more expensive 9800X3D.
Dropping down to the RTX 5080, results became more GPU limited. In this case, the 265K extended its lead over the 7600X slightly to 5%, matching the 9700X, and was just 2% slower than the heavily GPU-constrained 9800X3D. As expected, the Radeon results were all heavily GPU limited.
1440p - Medium

At 1440p, the GPU bottleneck increased as expected, leaving only the RTX 5090 configuration to show any meaningful difference between CPUs. Here, the 265K was 4% faster than the 7600X and 5% slower than the 9700X, placing it right between the two Ryzen processors.
4K, Medium

At 4K, even with medium settings, the RTX 5090 dropped to around 130 fps, leaving all results heavily GPU limited.
1080p, Ultra

Switching to Ultra at 1080p, the 265K again performed reasonably well, though still closer to the 7600X than the 9700X. With the RTX 5090, it was 4% faster than the 7600X, 6% slower than the 9700X, and 14% slower than the 9800X3D. Beyond that, results became heavily GPU limited.
1440p, Ultra

At 1440p Ultra, differences narrowed further. The 265K matched the 9700X when paired with the RTX 5090, while all four CPUs delivered identical performance with the slower GPUs.
4K, Ultra

As expected, all 4K Ultra data was fully GPU limited.
Warhammer 40,000: Space Marine 2
1080p - Medium

Finally, we have Space Marine 2, starting with the 1080p medium results. Here, the 265K performed well, beating the 7600X by 14% with the RTX 5090. However, the 9700X was still 6% faster, so while this was a decent showing, it was not a clear win for Intel. AMD also had the 9800X3D, which was 17% faster, though that chip costs considerably more, making it less of a fair comparison.
Performance margins were similar with the RTX 5080. Switching to the RX 9070 gave the 7600X, 9700X, and 265K a small bump due to reduced CPU overhead, with the 9700X ending up 10% faster than the 265K.
1440p - Medium

At 1440p, margins stayed consistent. For example, with the RTX 5090, the 9700X was 9% faster than the 265K, while the Intel CPU was 13% faster than the 7600X. Similar margins appeared with the RTX 5080. Even with the RX 9070, the 265K trailed the 9700X but remained noticeably faster than the 7600X.
4K, Medium

At 4K, results with the Radeon GPUs were completely GPU limited. However, with the RTX 5090 and 5080, the data told a different story. Interestingly, the 265K was only able to roughly match the 1% low performance of the 7600X, despite posting average frame rates similar to the 9700X.
1080p, Ultra

Switching to Ultra at 1080p did not change much, at least with the higher-end GPUs. The 265K was 12 – 16% faster than the 7600X when paired with GeForce GPUs, while the 9700X was 6 – 9% faster than the 265K. Similar margins held with the RX 9070.
1440p, Ultra

At 1440p Ultra, the story remained the same. Using the GeForce GPUs, the 9700X led the 265K, while the Intel processor maintained a clear lead over the 7600X.
4K, Ultra

Finally, at 4K Ultra, results were mostly GPU limited. This was certainly the case with the RTX 5080, RX 9070, and 9060 XT. With the RTX 5090, however, the 265K and 9700X were closely matched, though the Ryzen processor maintained an 8% advantage in 1% lows. Overall, performance was fairly similar.
Taking the Average
1080p - Medium
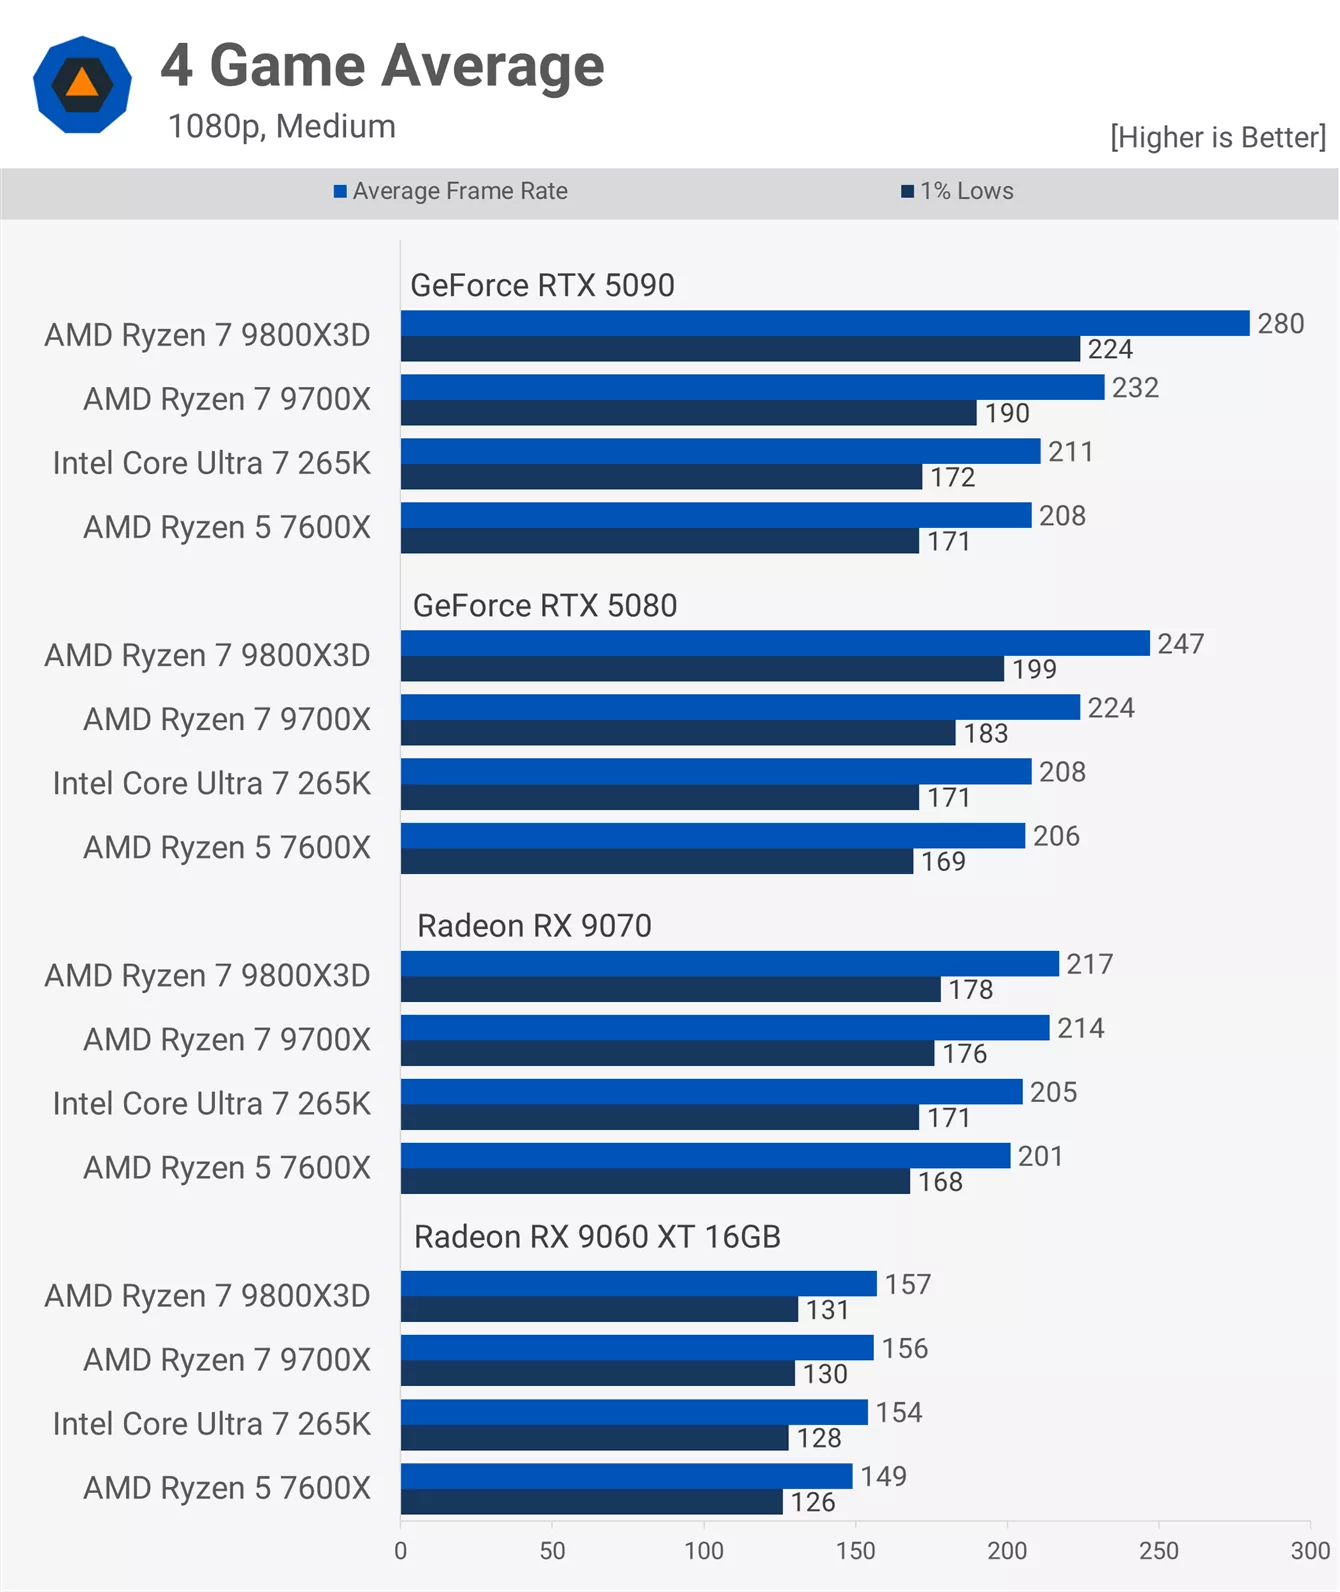
Here is a look at the four-game average data, calculated using the geometric mean. At 1080p with medium settings, the 265K was on average 1% faster than the 7600X, which aligns with earlier review data showing both CPUs delivering similar gaming performance. The 9700X was 10% faster, a fairly commanding lead over the 265K, with the same margin seen for the 1% lows.
The 9800X3D, priced much higher than the 265K, was on average 33% faster, representing a significant performance uplift.
Reducing GPU performance with the RTX 5080 shrinks that margin to 19% in favor of the 9800X3D, while the 9700X is now 8% faster. Once again, the 265K matched the 7600X.
Beyond that, results were mostly GPU limited, with the 9700X just 4% faster than the 265K on average.
1440p - Medium

At 1440p, the Core Ultra 265K remained roughly on par with the Ryzen 5 7600X across all configurations. When paired with the RTX 5090, the 9700X was 11% faster and the 9800X3D 26% faster. With the RTX 5080, those margins were reduced, and with the Radeon GPUs, they were effectively eliminated.
4K - Medium

At 4K with medium settings, the 265K sat between the 7600X and 9700X when paired with the RTX 5090, though all data was heavily GPU limited.
1080p - Ultra

Using the Ultra quality preset, which demands more from the CPU but is still difficult to prevent from being GPU bottlenecked, the 265K performed better. Paired with the RTX 5090, it delivered 5% higher performance than the 7600X. Even so, the 9700X was still 8% faster and the 9800X3D 20% faster.
With the RTX 5080, the 265K remained slightly faster than the 7600X, but also only slightly slower than the 9700X due to heavier GPU constraints.
1440p - Ultra

At 1440p, the 265K leaned closer to the 7600X, though the 9700X was only 5% faster on average and the 9800X3D just 10% faster when paired with the RTX 5090. With the RTX 5080, those margins were nearly eliminated, leaving even the 9800X3D only 6% faster than the 265K.
4K, Ultra
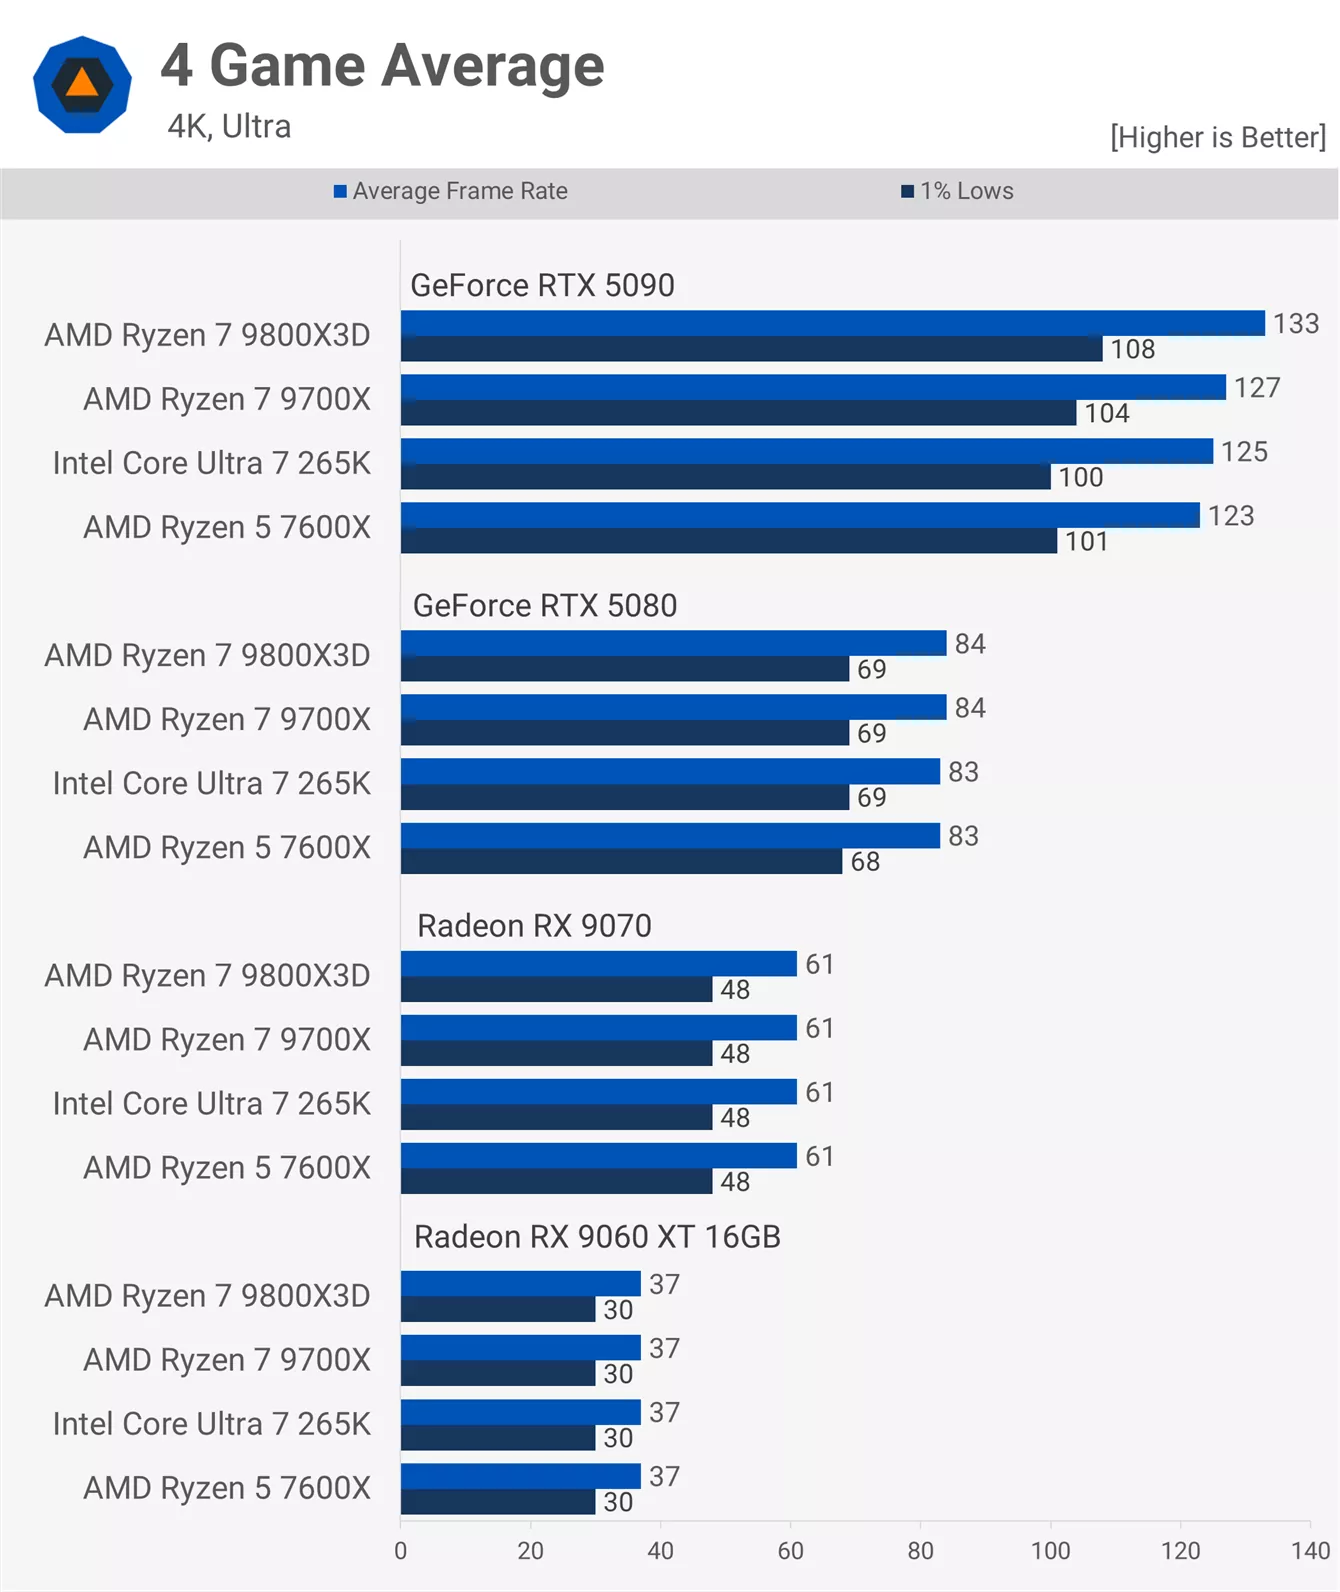
At 4K, as seen in the individual game tests, results were largely GPU limited, with frame rates capped around 120 – 130 fps. The 265K, 7600X, and 9700X performed identically, while the 9800X3D was only a few frames ahead.
Performance in Context
Although we only looked at four games, examined in detail, the results suggest that Intel's Core Ultra 7 265K is roughly equivalent to AMD's Ryzen 5 Zen 4 or Zen 5 processors. In our testing, it essentially mirrored the performance of the 7600X, consistent with our findings from day-one reviews from 10 months ago, when we tested Intel's 265K across 14 games and found it to be on average 1% slower than the Ryzen 7600X.
In the near future, we plan to compare the 265K and the 9700X across more than 30 games, as both currently cost around $300. Based on what we have seen, when CPU limited, the 9700X should average 5 – 10% faster. In fact, 10 months ago, we observed a 7% margin in favor of the 9700X.

As a recent example, when comparing them in Battlefield 6 by playing matches simultaneously, the 9700X was about 5% faster, essentially offering near-identical performance.

So, with the 9700X and 265K closely matched for gaming, we would say the Ryzen 7 part is generally a little faster, though not by enough to make performance alone the deciding factor in a purchase. So what else is there to consider?

In the context of PC gaming, other considerations include power usage, where the 9700X consumes about 20W less, equating to a 20% power saving. While that is a win for AMD, the difference is not particularly large. Pricing and platform costs are also very similar.

The major distinction comes down to platform longevity, where AMD continues to excel. AM4 offered outstanding long-term value, and while AM5 has not yet matched that success, we expect Zen 6 to launch on AM5. Industry contacts consistently confirm this, with no counterclaims.

This means that purchasing a 9700X today provides a strong chance of a significant upgrade path within a year or two, simply by dropping a new CPU into the existing socket while keeping the motherboard and memory.

This has been one of Ryzen's strongest advantages for years, and Intel has yet to counter it. For example, the 265K has no such path. Buying one today means your next upgrade will require reinvesting in platform hardware, at minimum a new motherboard.
Therefore, based on the data, it is extremely difficult to recommend the 265K for gamers. It is slightly slower, consumes more power, and offers no upgrade path, with no clear upside.

The only real case for the Core Ultra 7 265K over the Ryzen 9700X would be productivity. In those workloads, the 265K performs roughly on par with the 9900X, sometimes faster, sometimes slower, but usually close.
The Ryzen 9 costs about $100 more, so the 265K does offer better value in that sense. However, it still consumes slightly more power and suffers from the same lack of an upgrade path, making it a tough recommendation even for productivity – though at least an argument could be made.
So, what do you think about the 265K at around $300? Has Intel tempted you at this price, or would it need to be even cheaper to win you over?