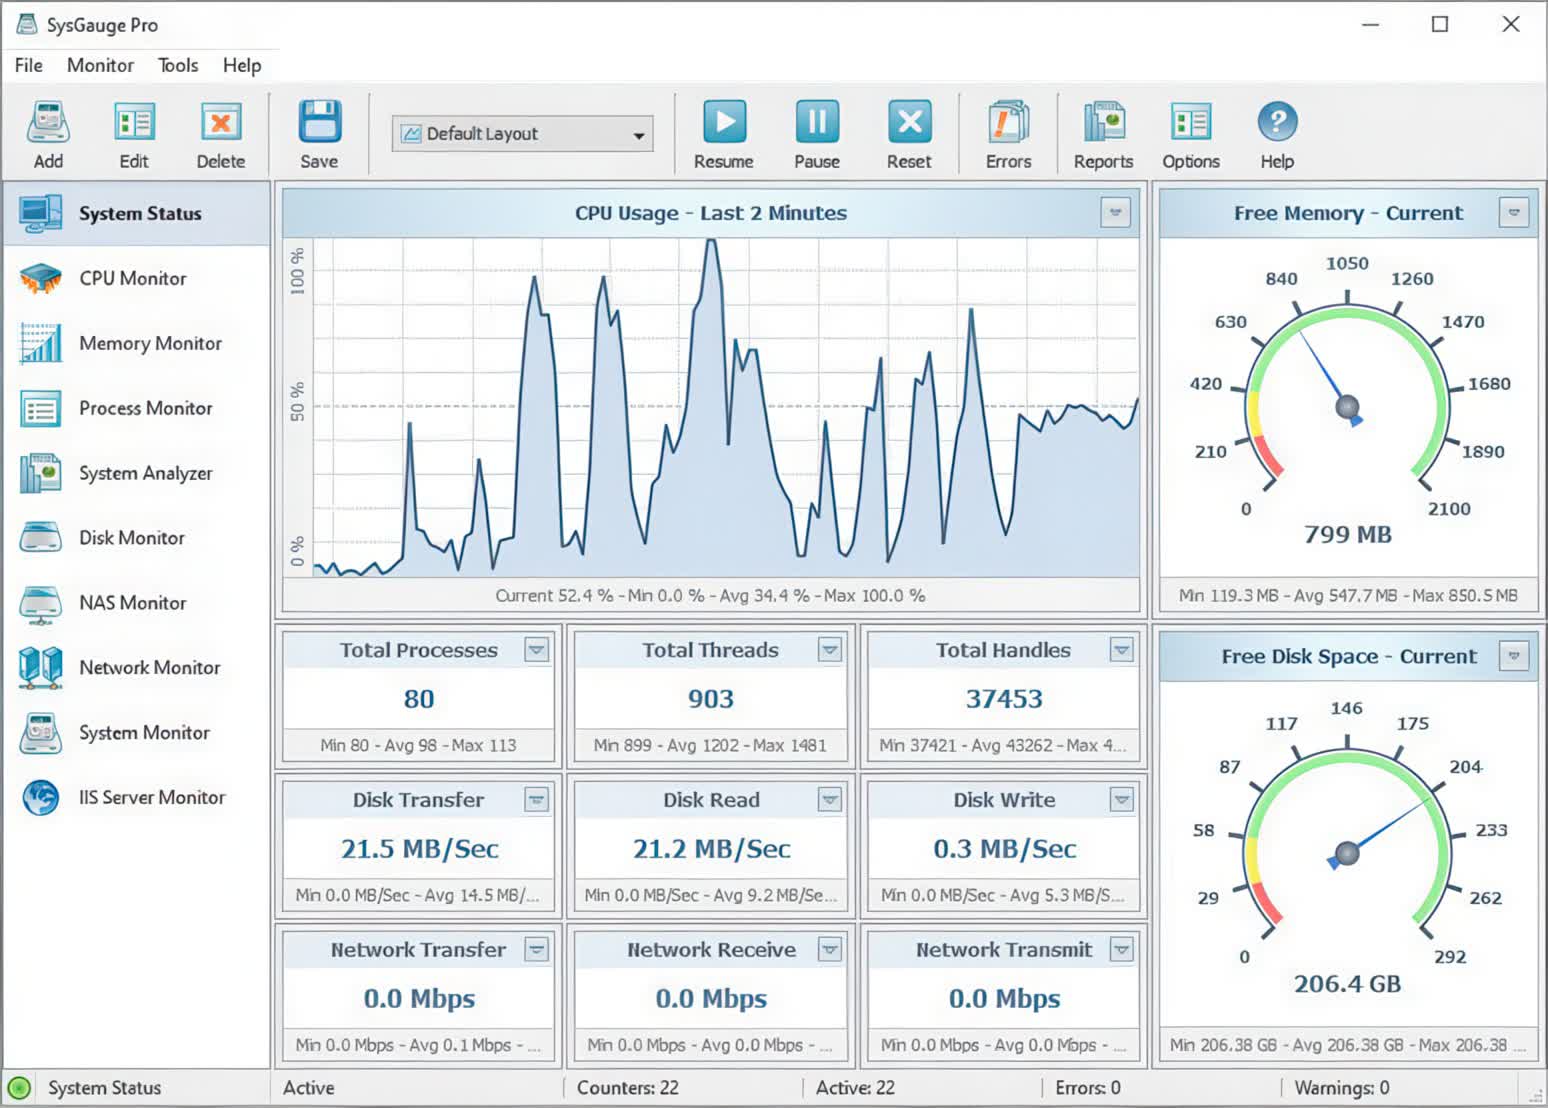
With SysGauge you can check the status and resource usage of running processes, file system performance, USB performance, disk space usage, disk read activity, disk write activity, disk read transfer rate, disk write transfer rate, disk read IOPS and disk write IOPS for individual logical disks or all physical disks installed in the computer.
The user is provided with the ability to display various types of system monitoring charts, save system monitoring reports and export system monitoring results to a number of standard formats including HTML, PDF, Excel, text, CSV and XML. Advanced users and IT administrators are provided with the ability to periodically save system status reports, set user-specified limits for system monitoring counters and then show error or warning messages, play notification sounds or send E-Mail notifications when a system monitoring counter rises above or drops below the user-specified limit.
The SysGauge system monitoring utility provides a large number of different types of performance monitoring, system resource monitoring and operating system status monitoring counters and allows one to select which counters to monitor. In addition, users are provided with the ability to specify how to display the performance monitoring results for how long to keep the results history.
In addition to the ability to monitor the local computer, SysGauge allows one to connect to remote computers and monitor the CPU usage, memory usage, network transfer rate, disk space usage and disk activities via the network. The user is provided with the ability to specify the name or an IP address of the remote computer to connect to, select which types of system counters to monitor and specify how to display the system monitoring results.
One of the most useful capabilities of the SysGauge performance monitoring utility is the ability to save performance monitoring reports into a number of standard formats including HTML, PDF, Excel, text, CSV and XML. In order to save a performance monitoring report, press the 'Save' button located on the main toolbar, select an appropriate report format, enter a report file name and press the 'Save' button.
For example, a SysGauge PDF performance monitoring report starts with a summary table showing the report date and time, the name of the monitored computer and the name of user saved the performance monitoring report. The summary table is followed by a list of performance counters showing the average, minimum and maximum values for all performance monitoring counters. The list of counters is followed by a list of line charts showing performance monitoring data for all counters. Finally, the list of line charts is followed by a list of tables showing the complete history of monitoring results for all counters.
What's New
SysGauge v12.8 adds the data transfer rate per process, read transfer rate per process and write transfer rate per process to the process monitoring pie charts dialog. In addition, the new product version improves the process monitoring charts HTML and PDF reports, improves the SysGauge system status analyzer and fixes a number of bugs.
- Adds the data transfer rate per process pie charts
- Improves the PDF process monitoring pie charts
- Improves the SysGauge system status analyzer
- Fixes a number of bugs