Synthetic Benchmarks

The AMD A10-6800K scored 11957pts in 3DMark, making it 2% faster than the FX-4350 and 9% faster than the A10-5800K. Moreover it was 51% faster than the Pentium G2020 but 17% slower than the Core i5-3450. The A4-4000 on the other hand scored just 4972pts, making it 7% slower than the A4-5300 and 31% slower than the Intel Celeron G1610.

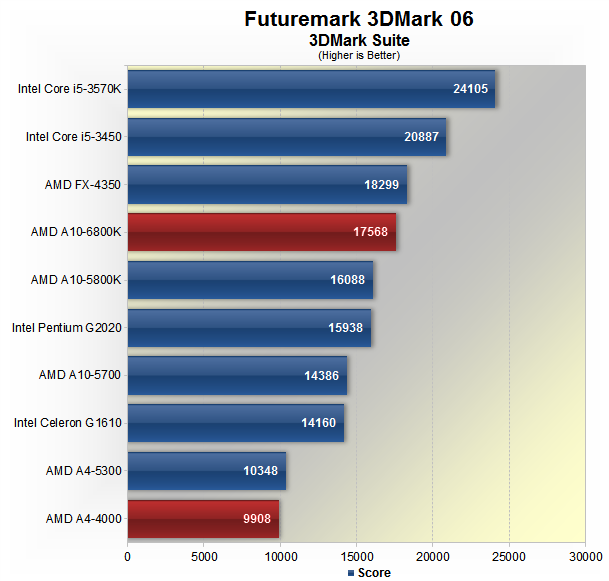
When testing with 3DMark 06, the AMD A10-6800K was 4% slower than the FX-4350, but 9% faster than the A10-5800K and 10% faster than the Pentium G2020. It was, however, 15% slower than the Core i5-3450. The A4-4000 was 4% slower than the A4-5300 and 30% slower than the Celeron G1610.

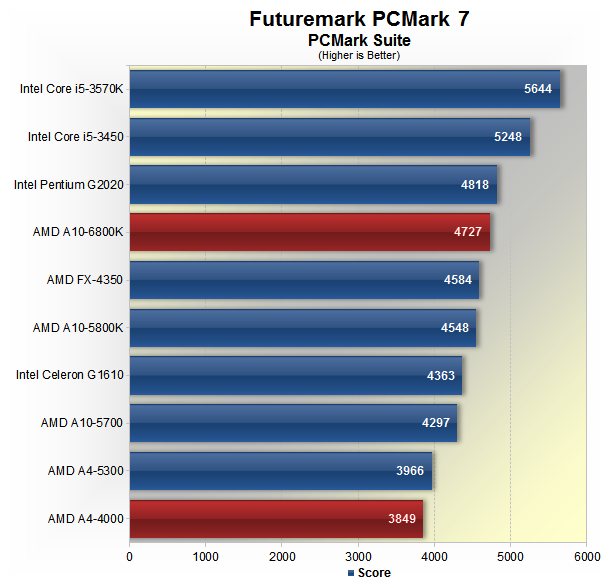
The AMD A10-6800K scored 4727fps in PCMark 7, making it 2% slower than the Pentium G2020 and 10% slower than the Core i5-3450. On the other hand it was 3% faster than the FX-4350 and 4% faster than the A10-5800K. The A4-4000 scored just 3849pts, making it 3% slower than the A4-5300 and 12% slower than the Celeron G1610.
