Serving tech enthusiasts for over 25 years. TechSpot means tech analysis and advice you can trust.
When you buy through our links, we may earn a commission.
We've spent the last two and a half years burning in our 4K QD-OLED monitor, and it's time to take another look at how it's holding up. It's been six months since the last update, and in that time we've continued to burn in our MSI MPG 321URX monitor on purpose by using it exclusively for productivity work.
That means pretty much 100% of its usage has consisted of static desktop content such as web browsers, document editors, and spreadsheets, along with creative apps like Photoshop and Premiere. We don't recommend using an OLED monitor like this. These displays are best suited to content consumption, but someone has to do it for science, so we figured it may as well be us.
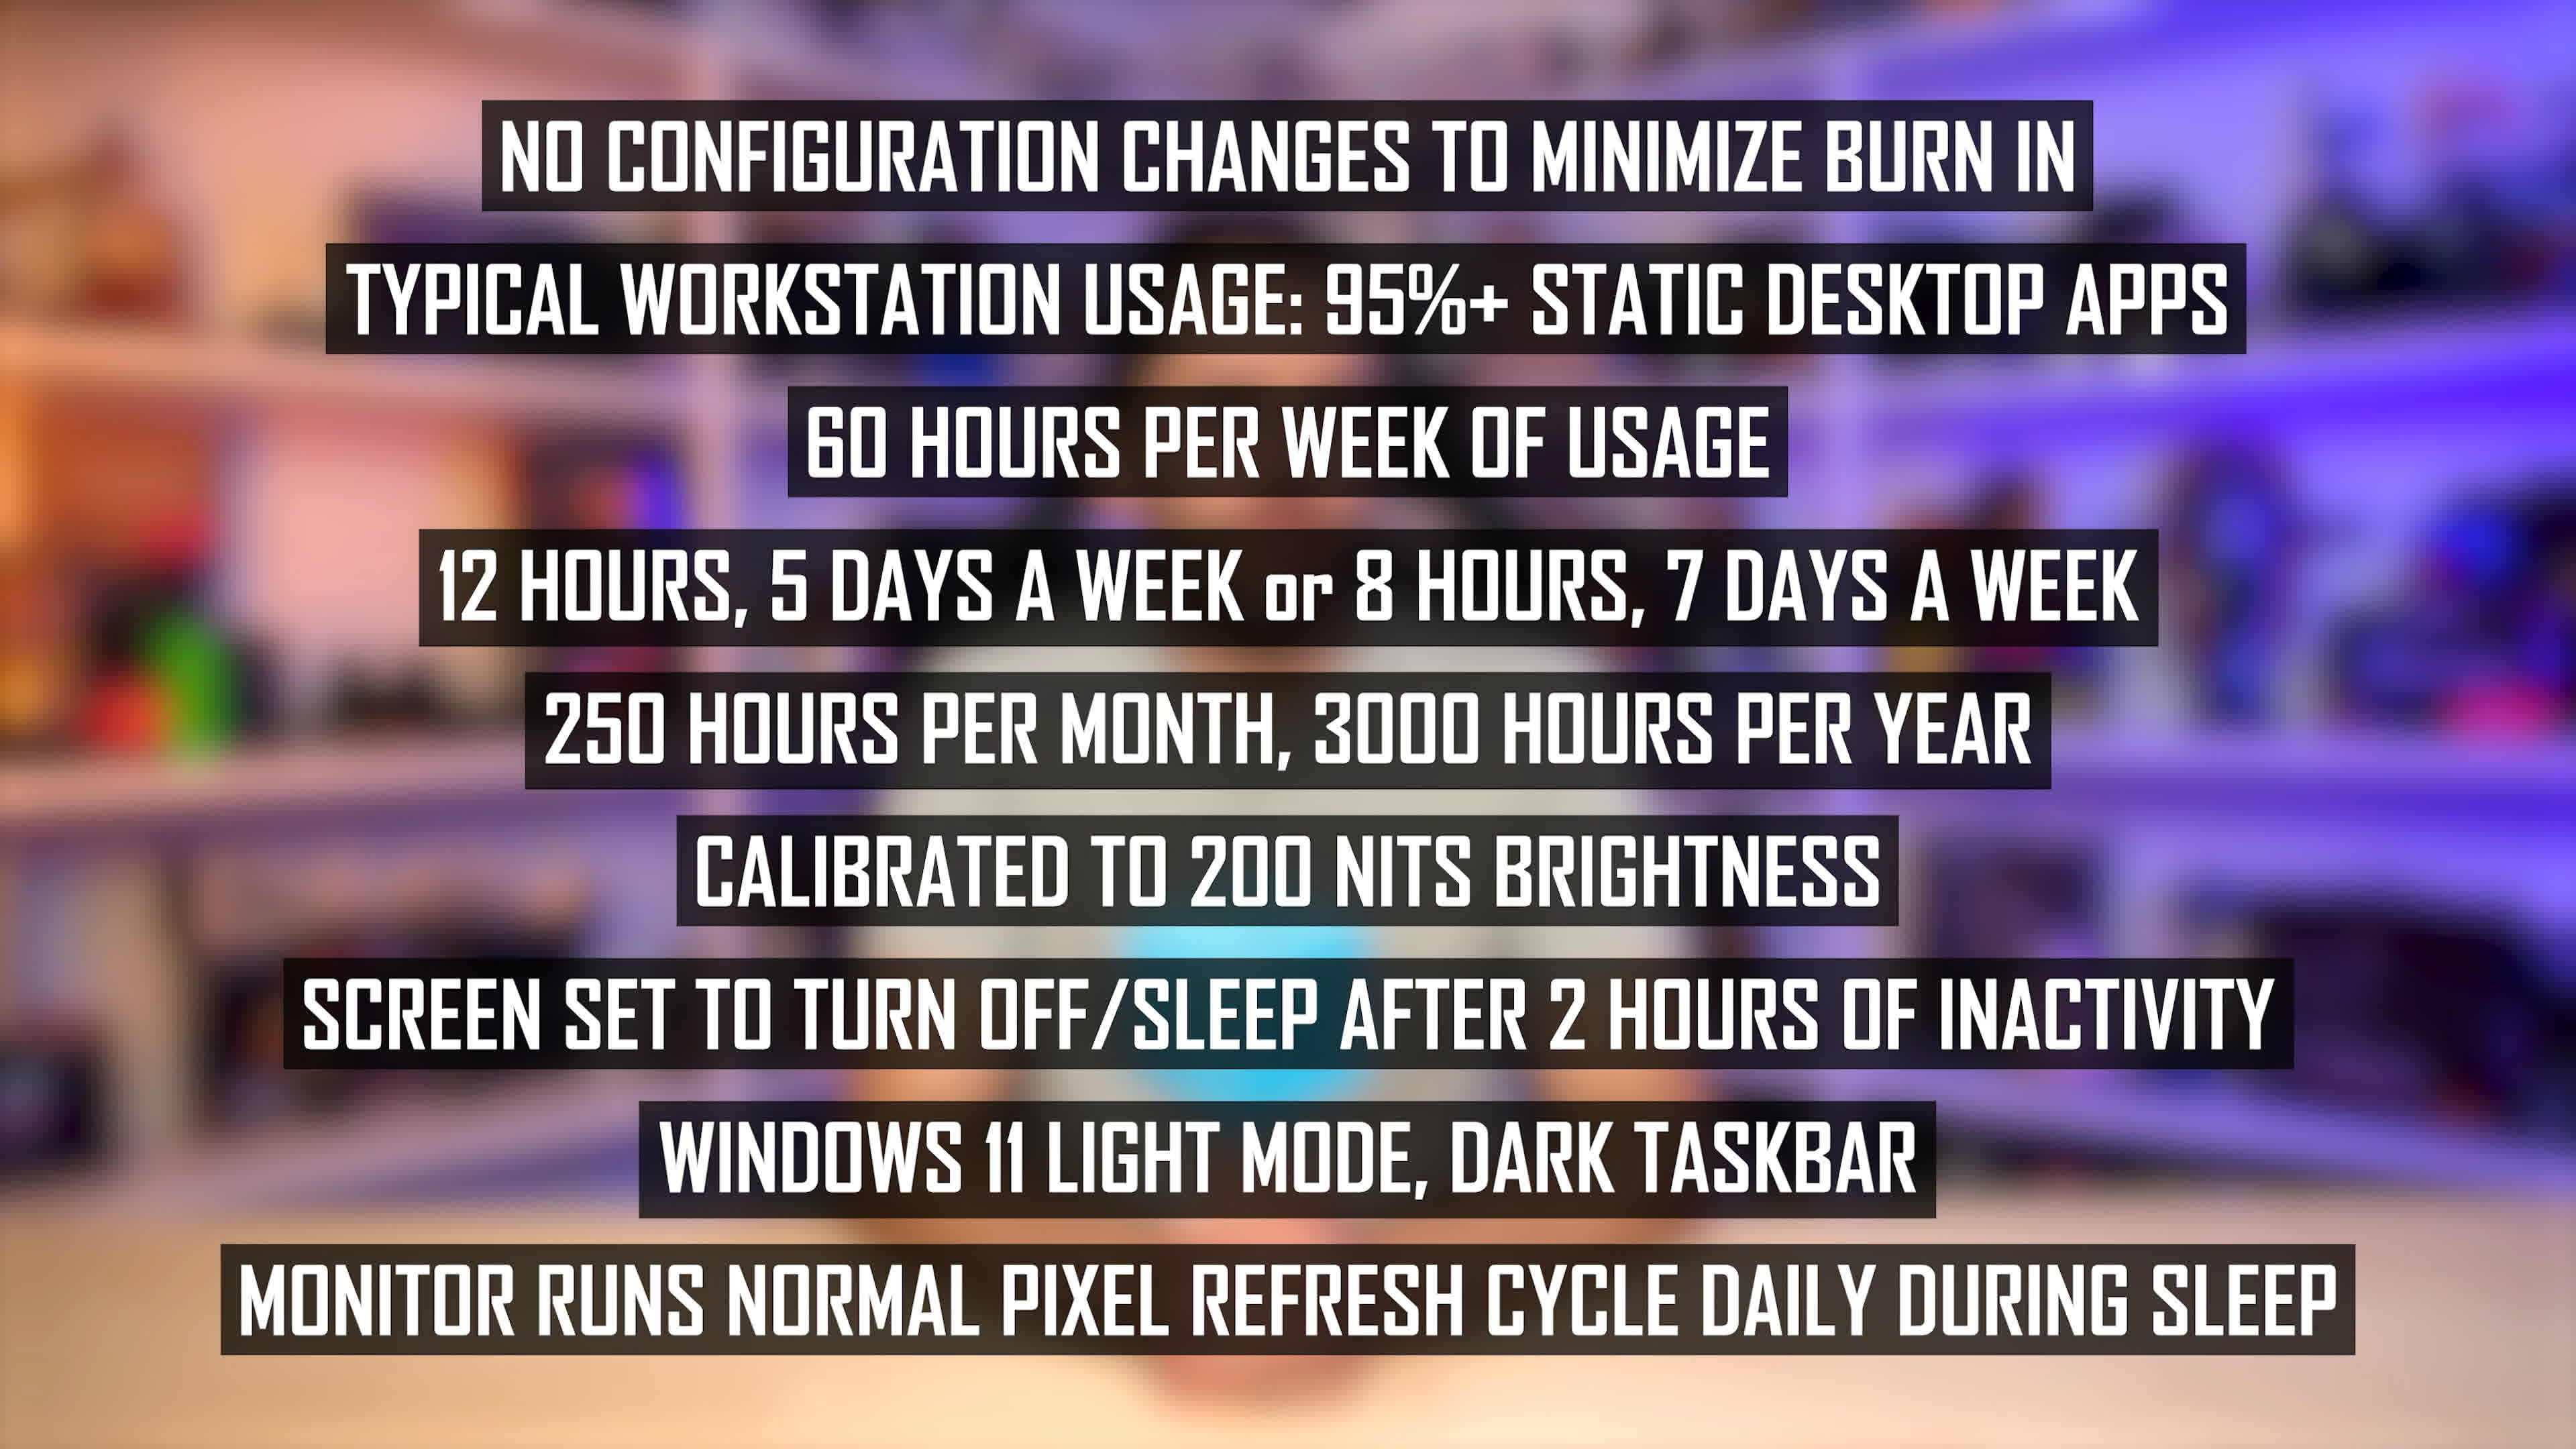
This all stems from my decision two years ago to swap out the 32-inch 4K IPS LCD I was personally using for work, for a brand-new 32-inch 4K QD-OLED. I changed nothing else about the setup to test what it would be like to use an OLED in exactly the same way as an LCD. So, no dark mode, no minimizing the taskbar, and no screensaver kicking in after just a few minutes. This is an extremely demanding use case for an OLED, but it's also a realistic real-world test because it's exactly how we've been using my workstation for years.
We're now 30 months into this test, and we've continued to use the monitor for 8 to 10 hours of static content every single day at around 200 nits of brightness. In the last update, we were up to 6,500 hours of usage. Today, that figure is around 8,000 hours.
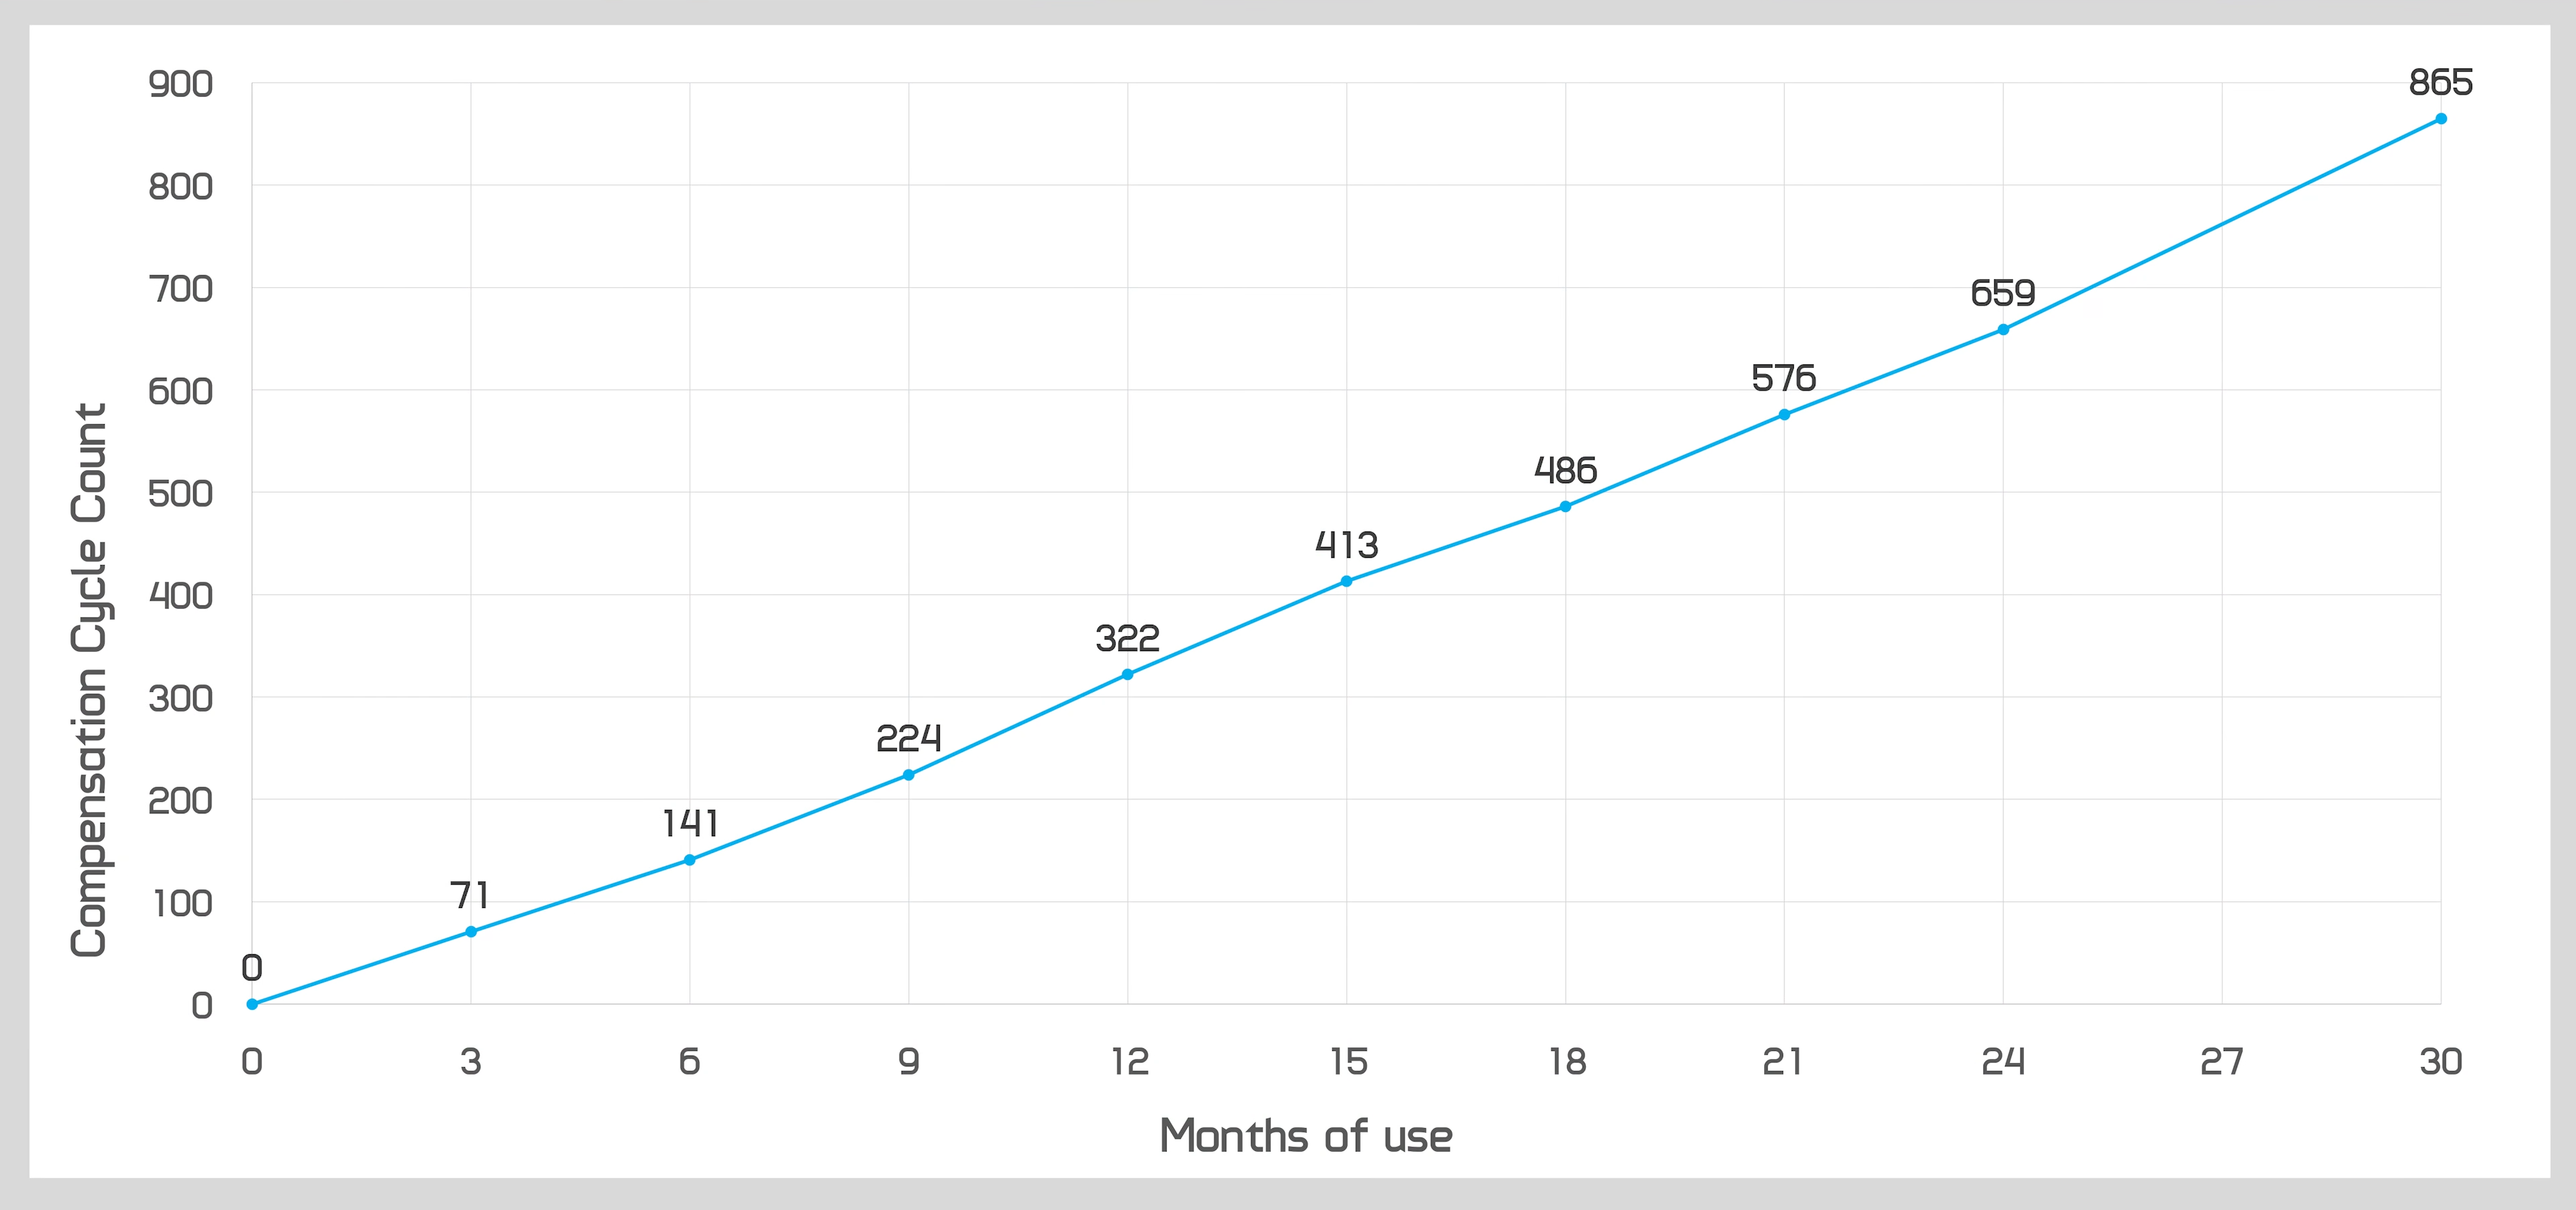
The panel reports that 865 compensation cycles have been completed, which is completely in line with previous updates in this series, though naturally it's a larger-than-usual jump now that we've moved from three-month to six-month updates.
As a reminder, the recommended interval for compensation cycles is every four hours. But having to stop using the display for seven minutes every four hours is annoying, so I only let the monitor run the cycle when it's asleep at the end of each day. This means we've completed only about half the recommended number of cycles, which adds further stress to the test.
Number of Compensation Cycles
MSI MPG 321URX QD-OLED
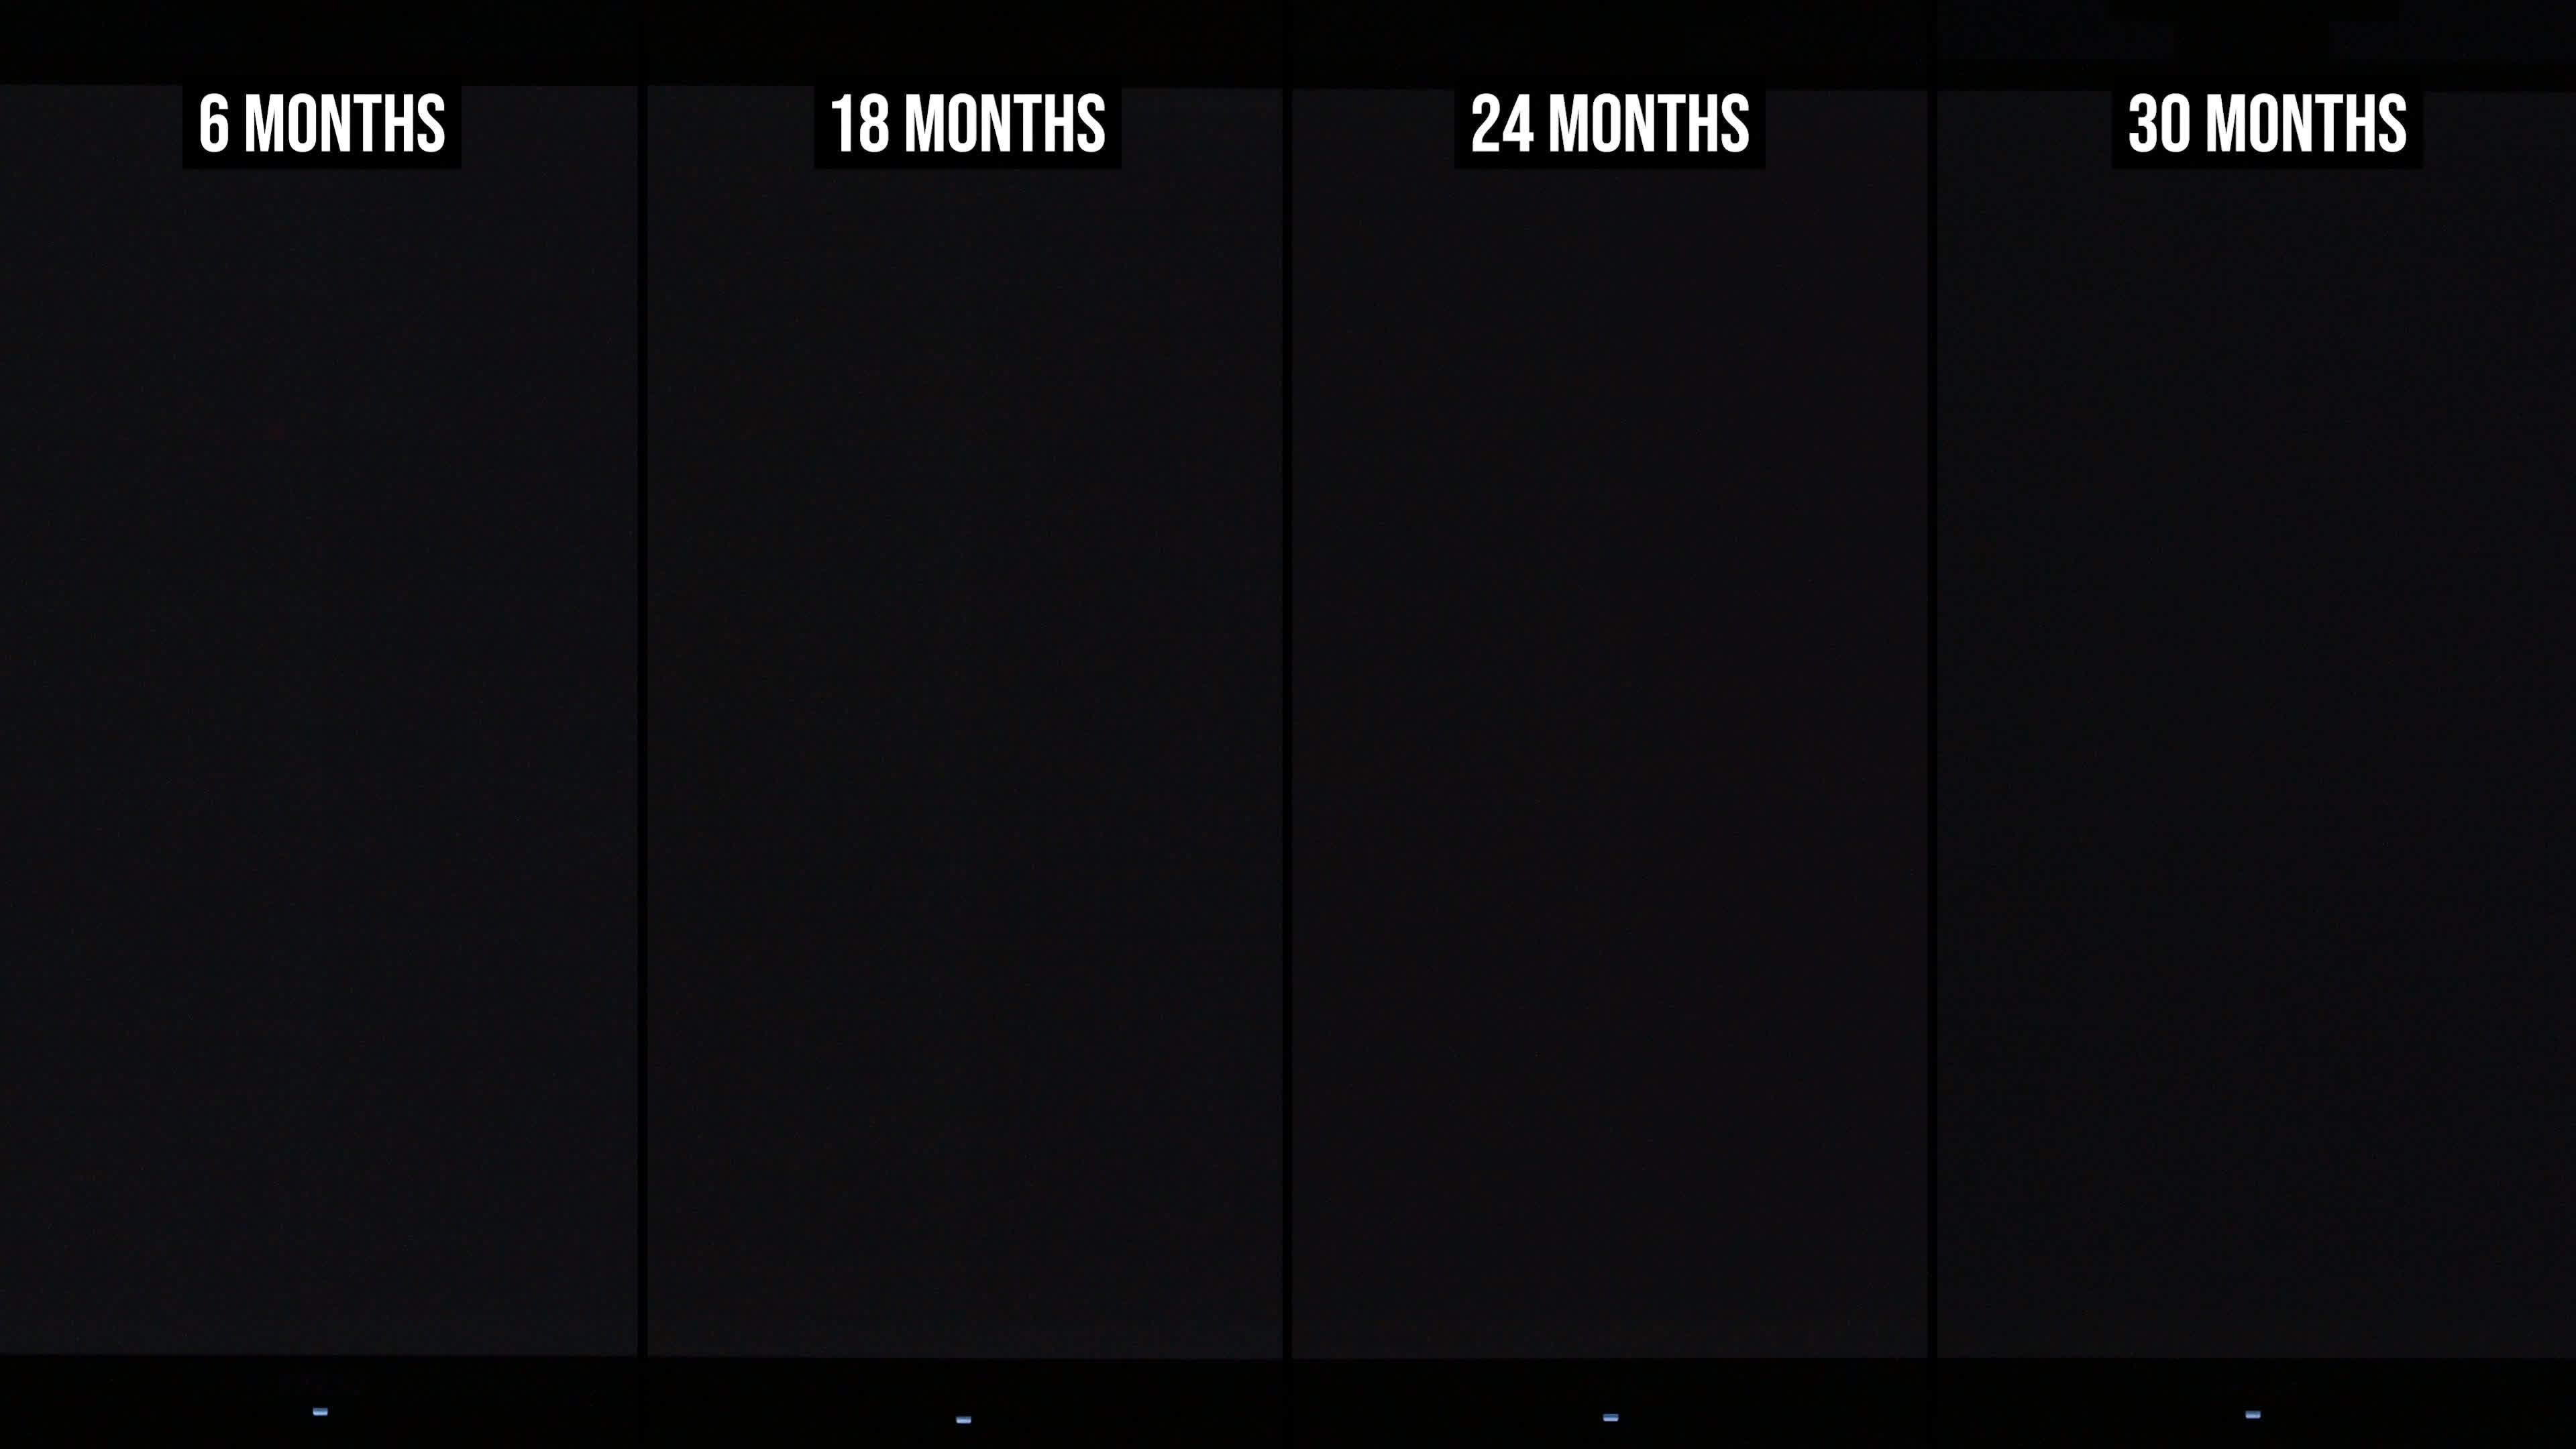
For this update, we're comparing the results from six months into the test, giving us a look at how the screen appeared relatively early in the process, with three additional updates spaced six months apart: 18 months, 24 months, and now 30 months.
The main focus is the center of the screen, which is the area with the most visible burn-in. We've continued using the same image-processing method from the last few updates to make these artifacts easier to see after image and video compression, including adding static noise to the image. This appears to reduce compression artifacts and makes the burn-in more visible.
We have purposefully been using a 4K OLED monitor in ways that will cause permanent burn-in. This is not how you should be using an OLED monitor, but we're taking one for the team.
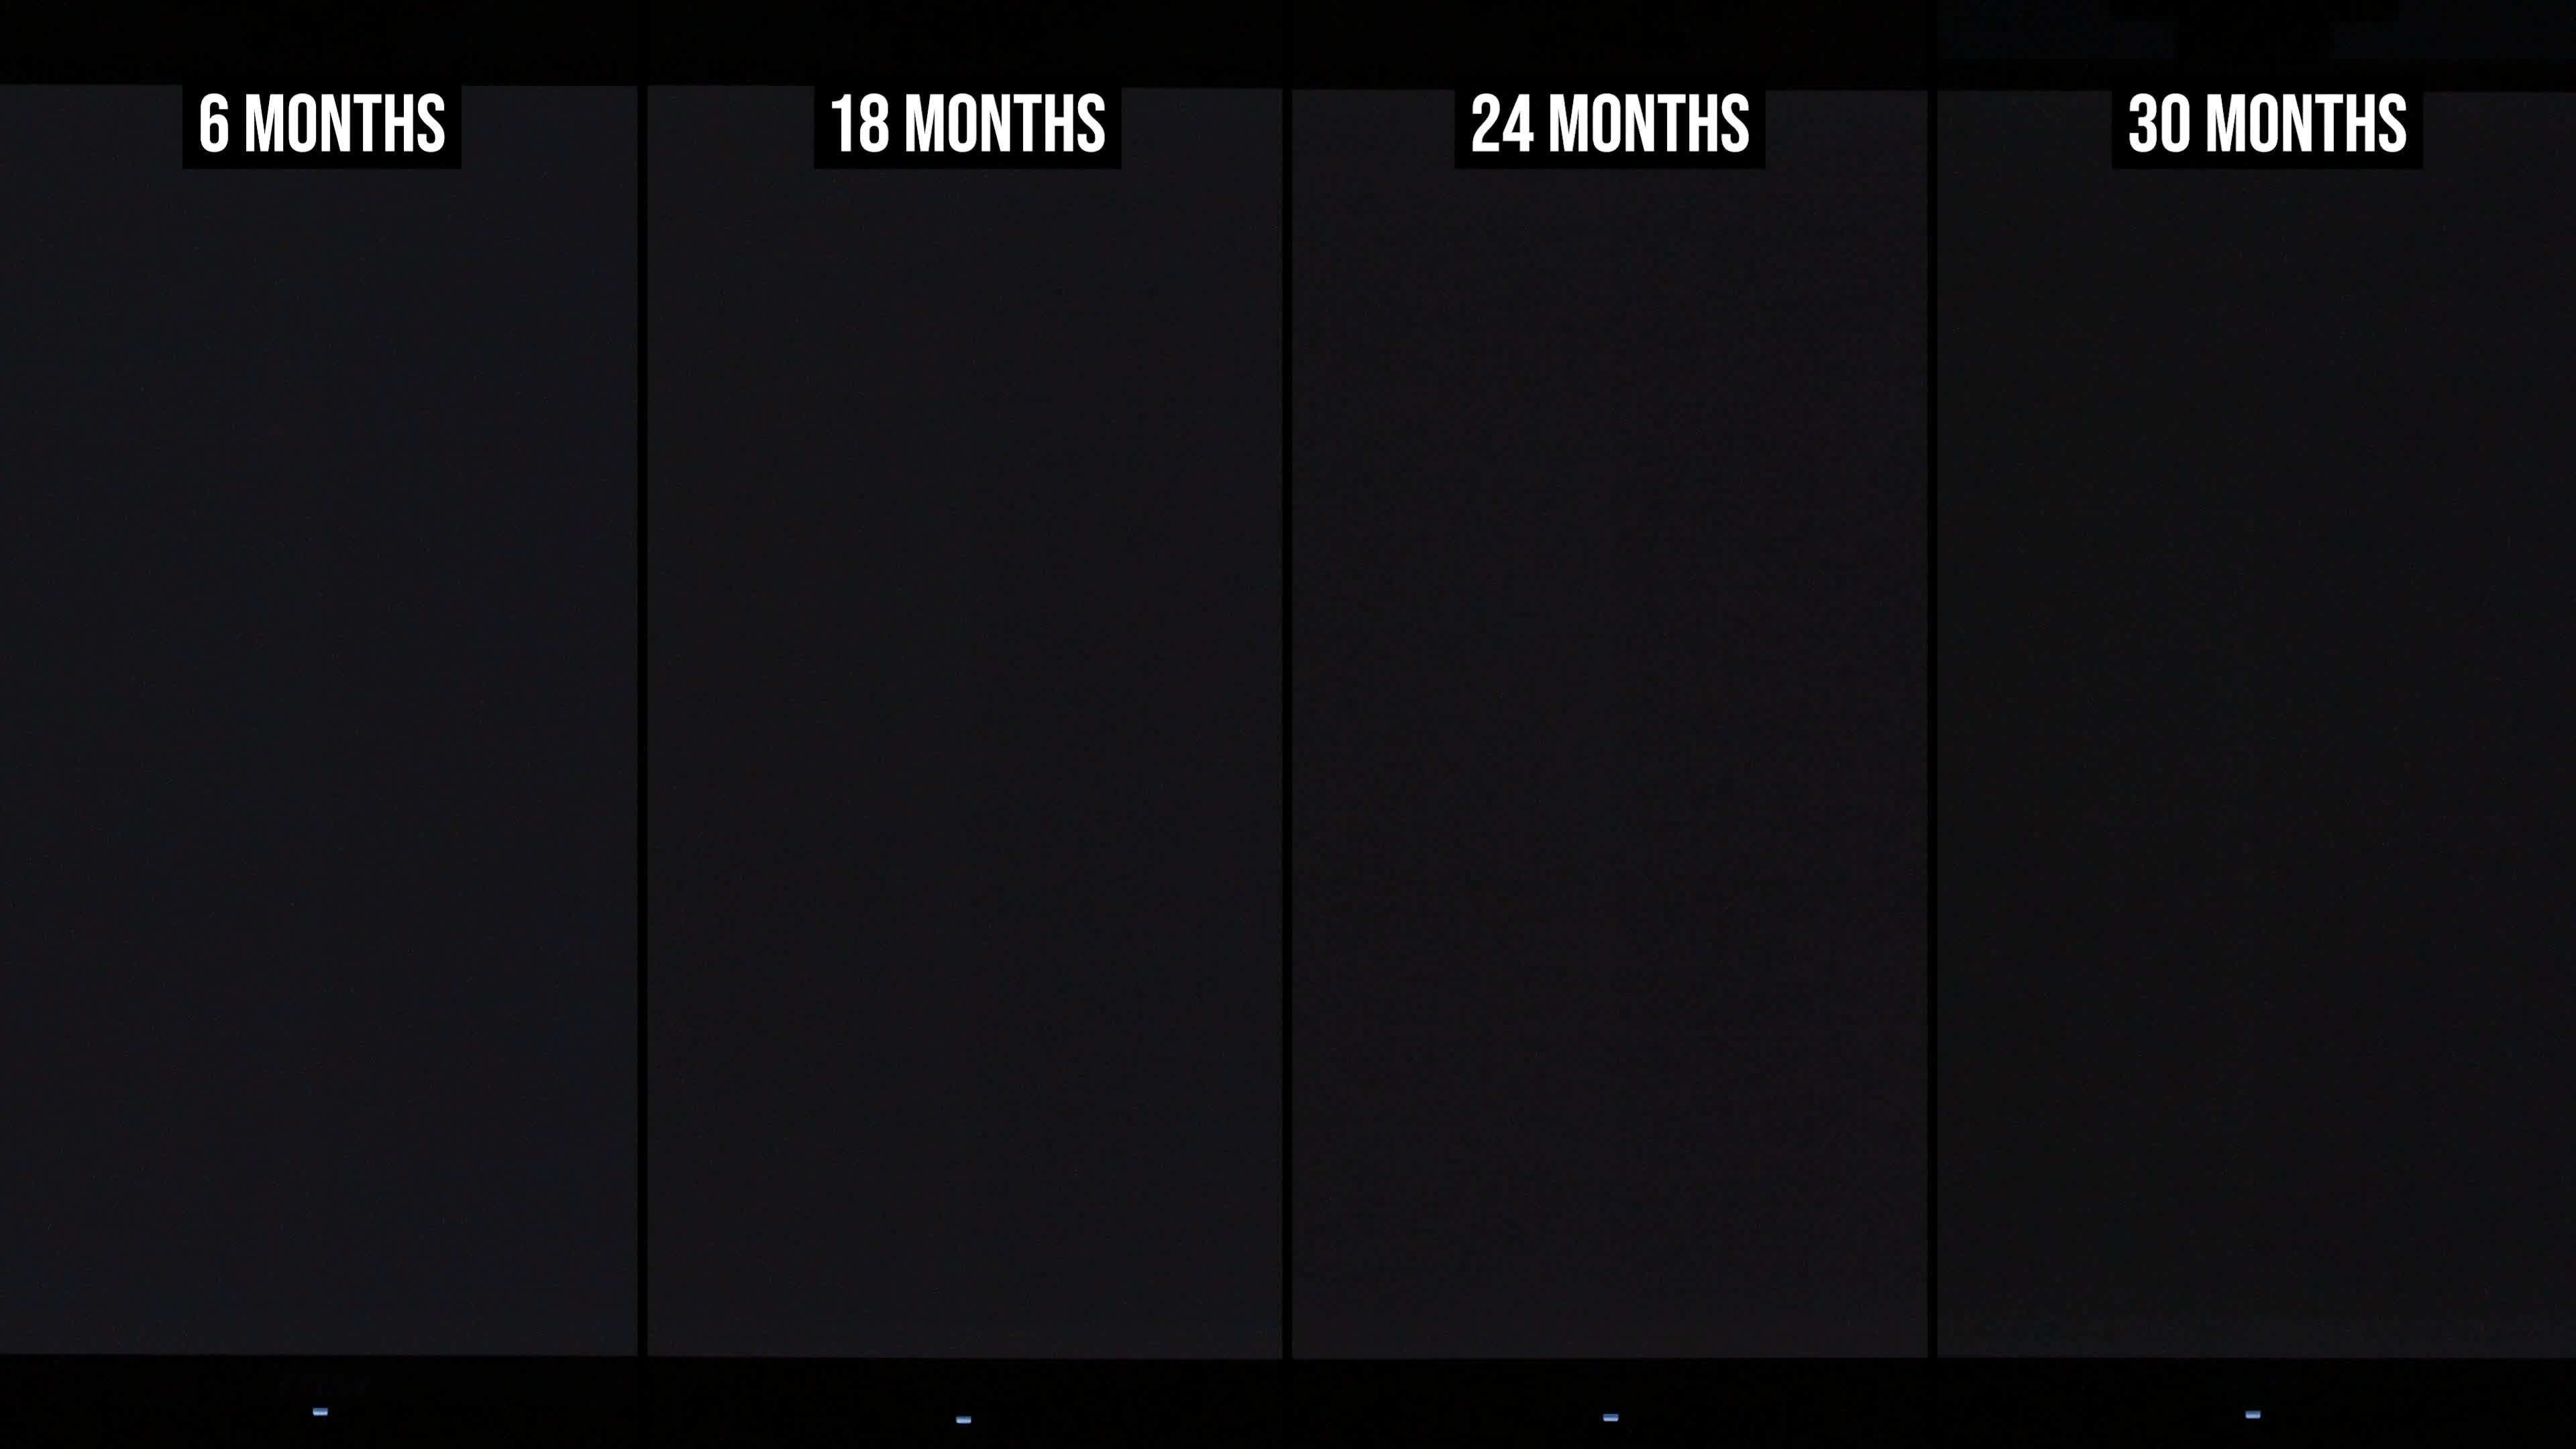
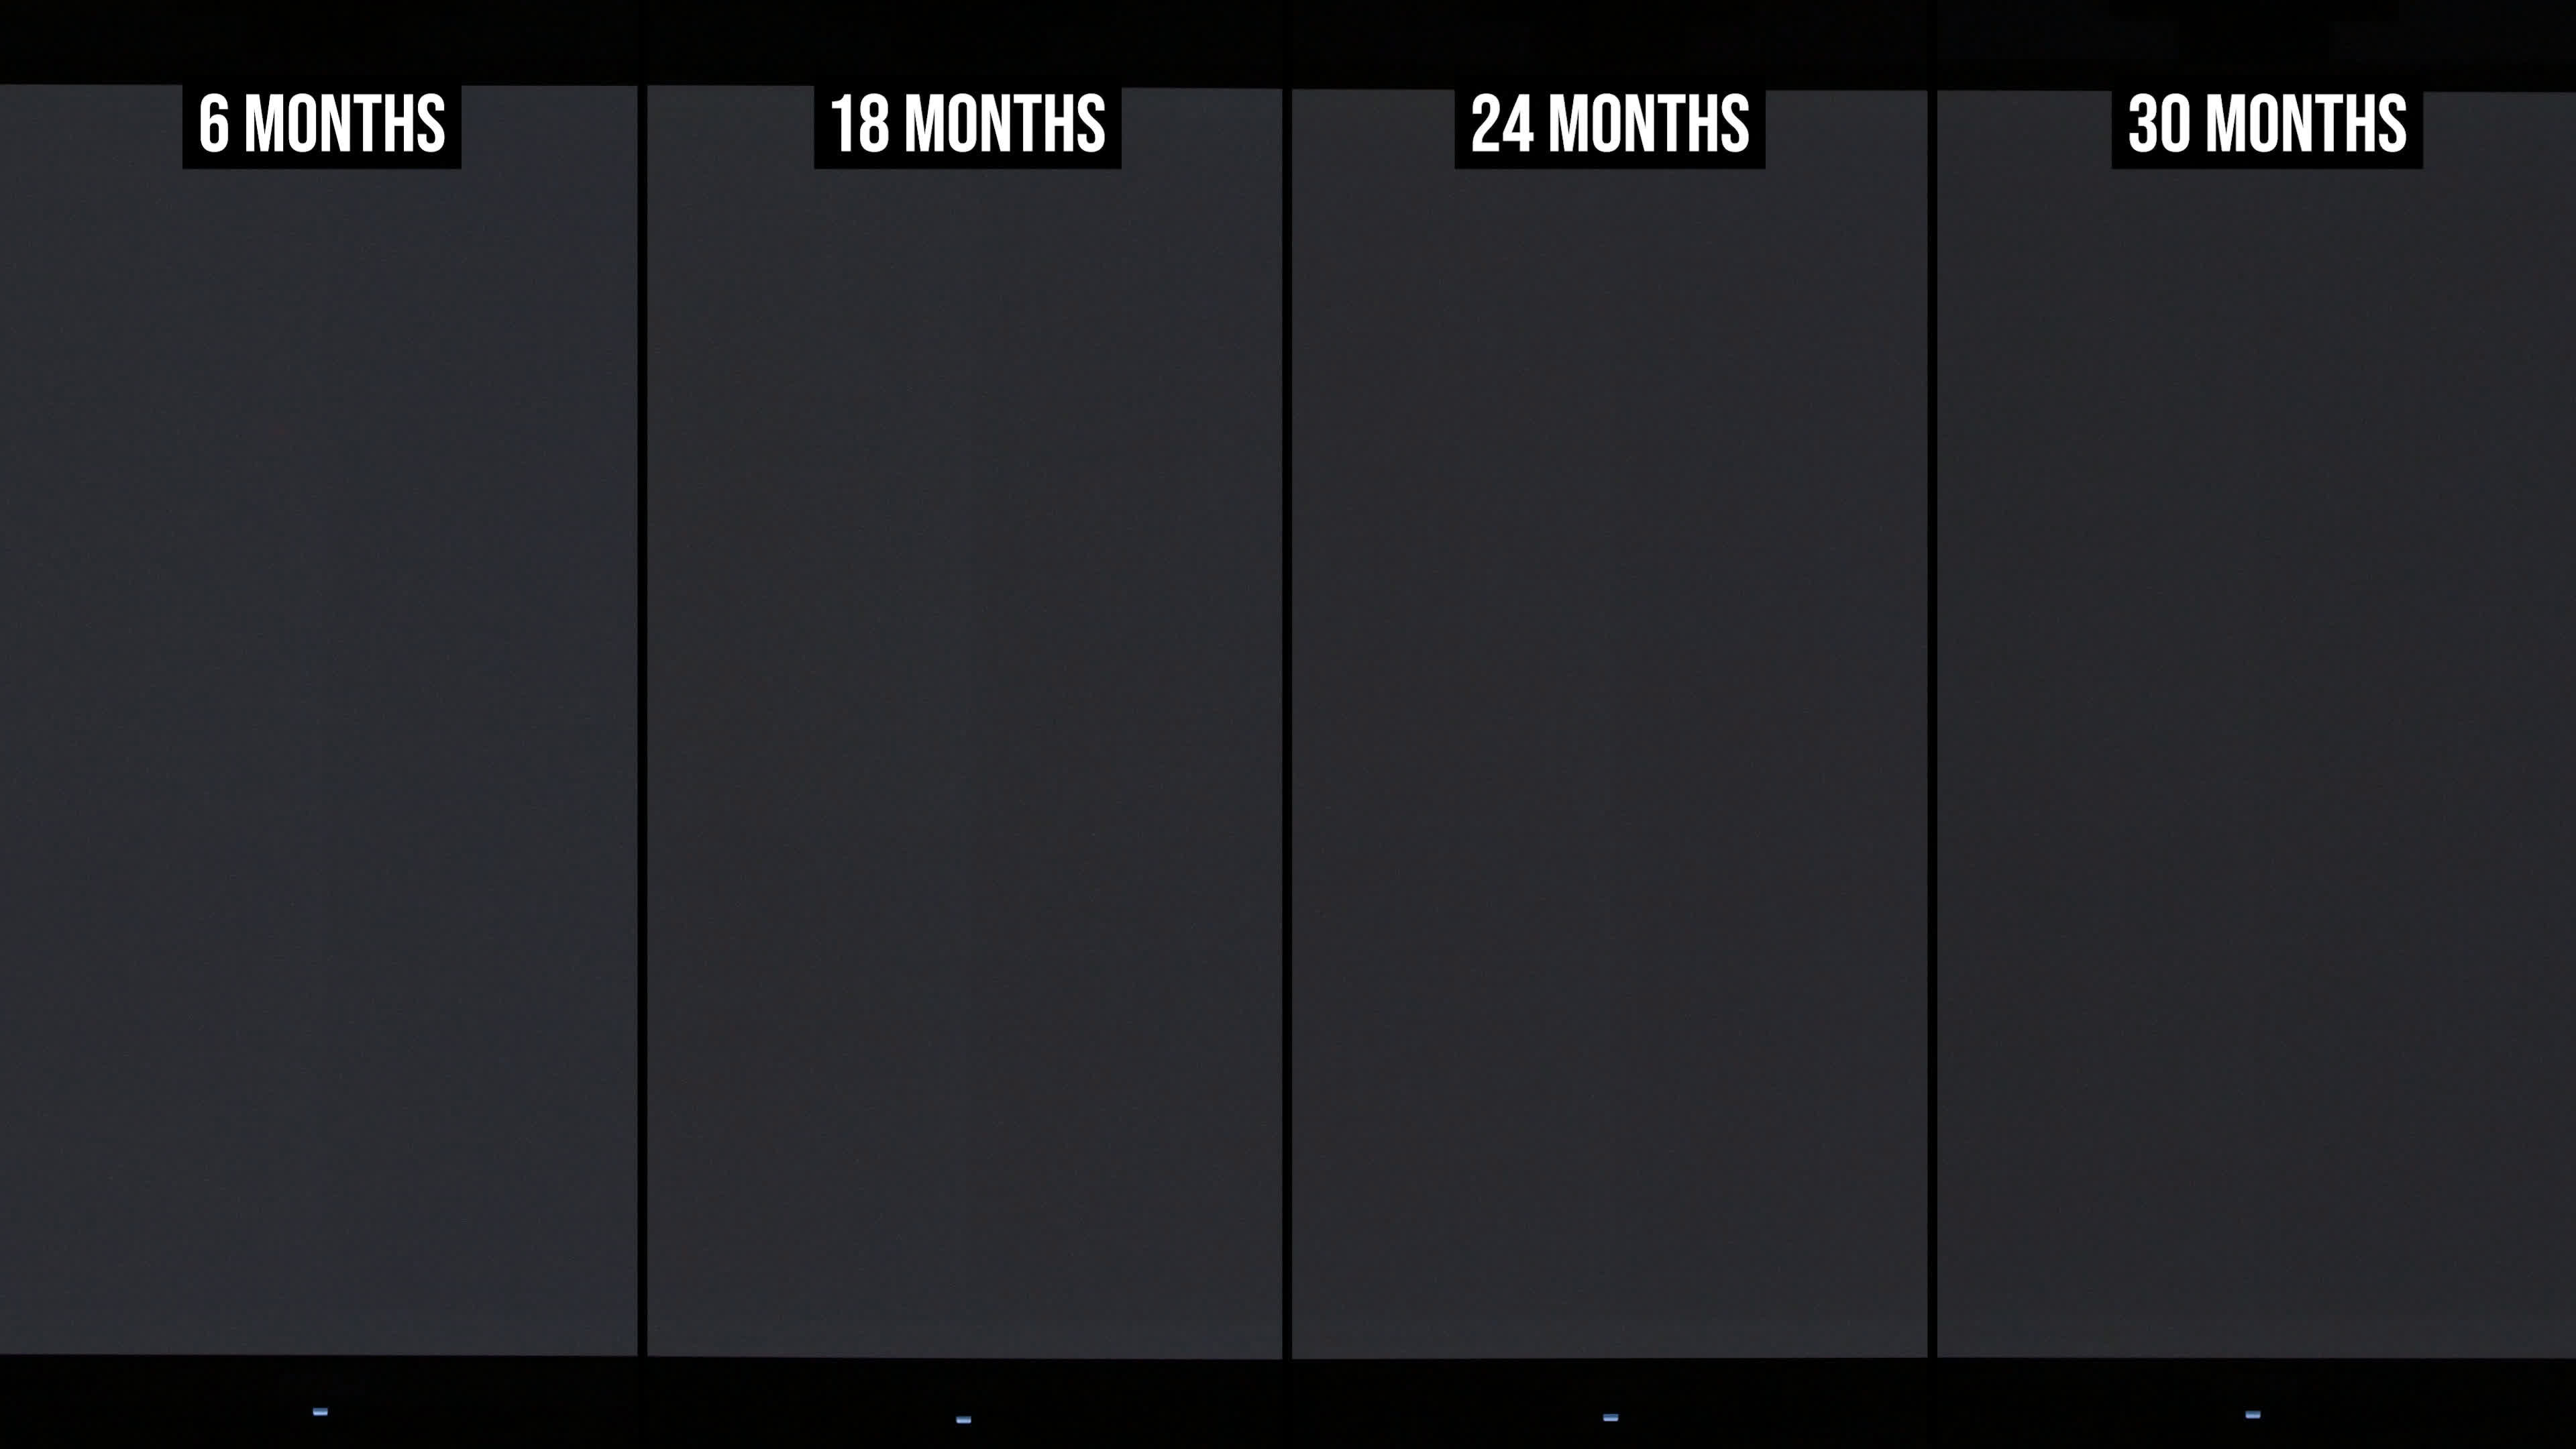
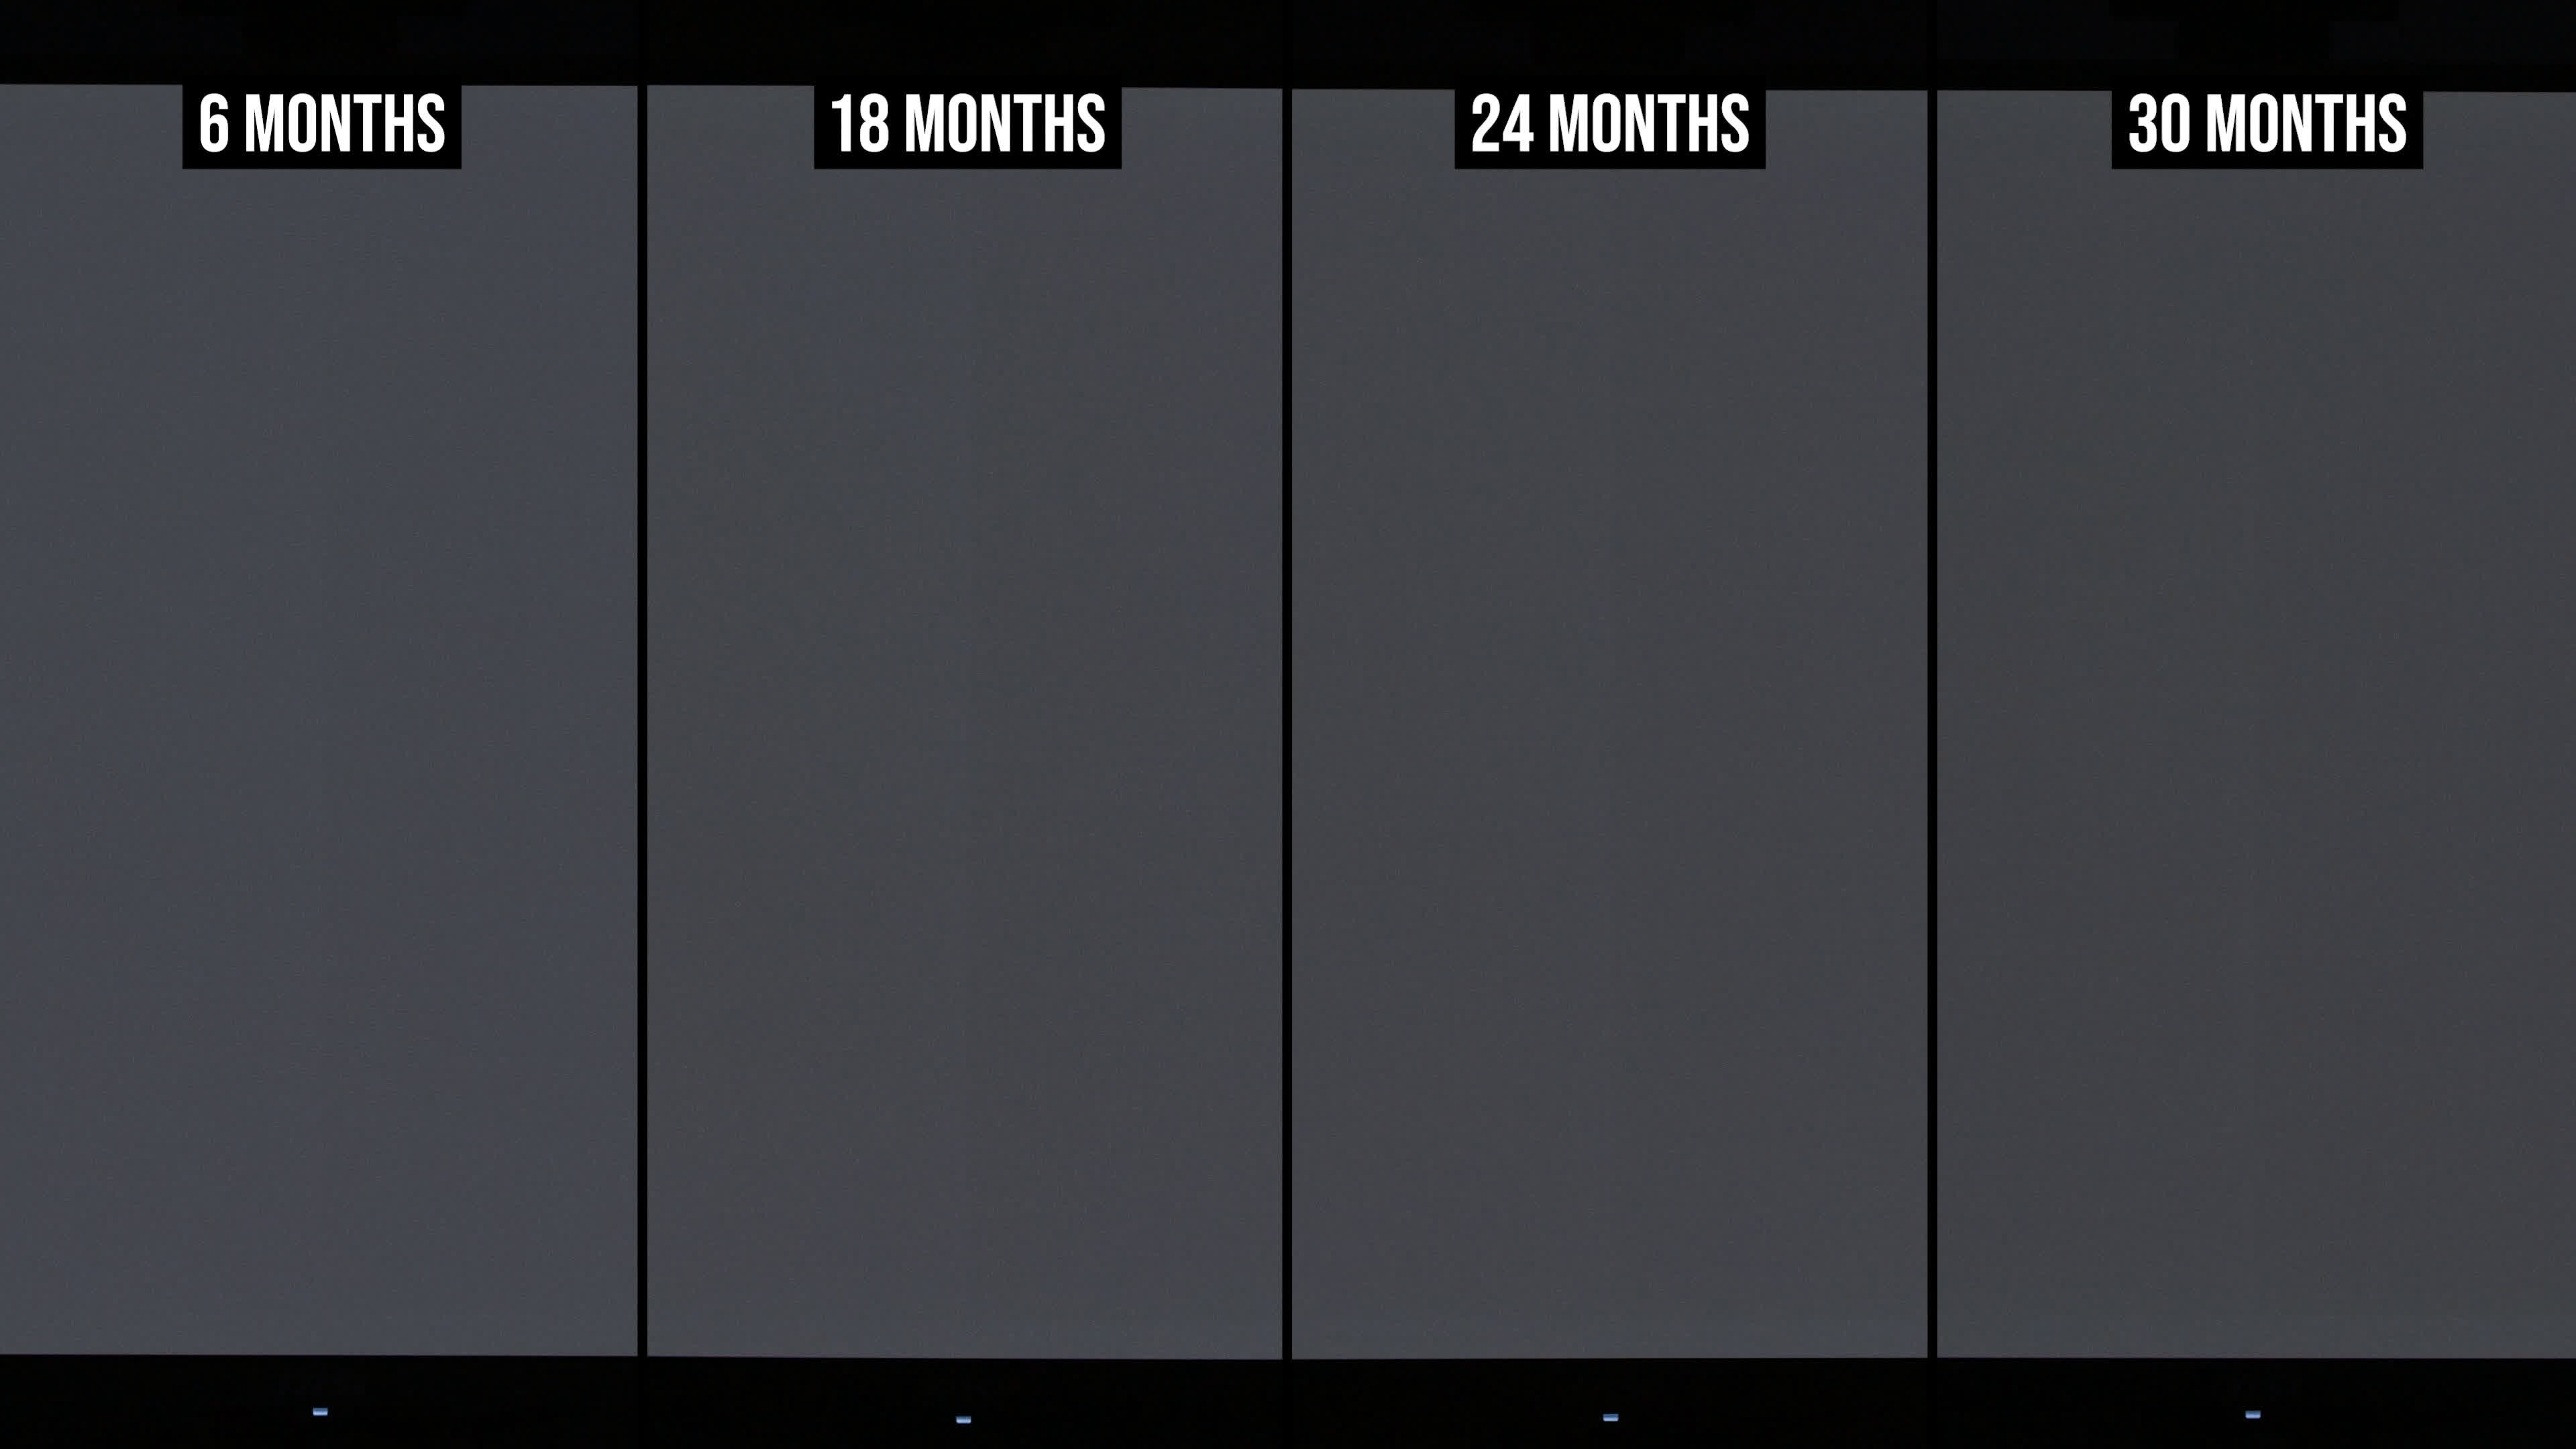
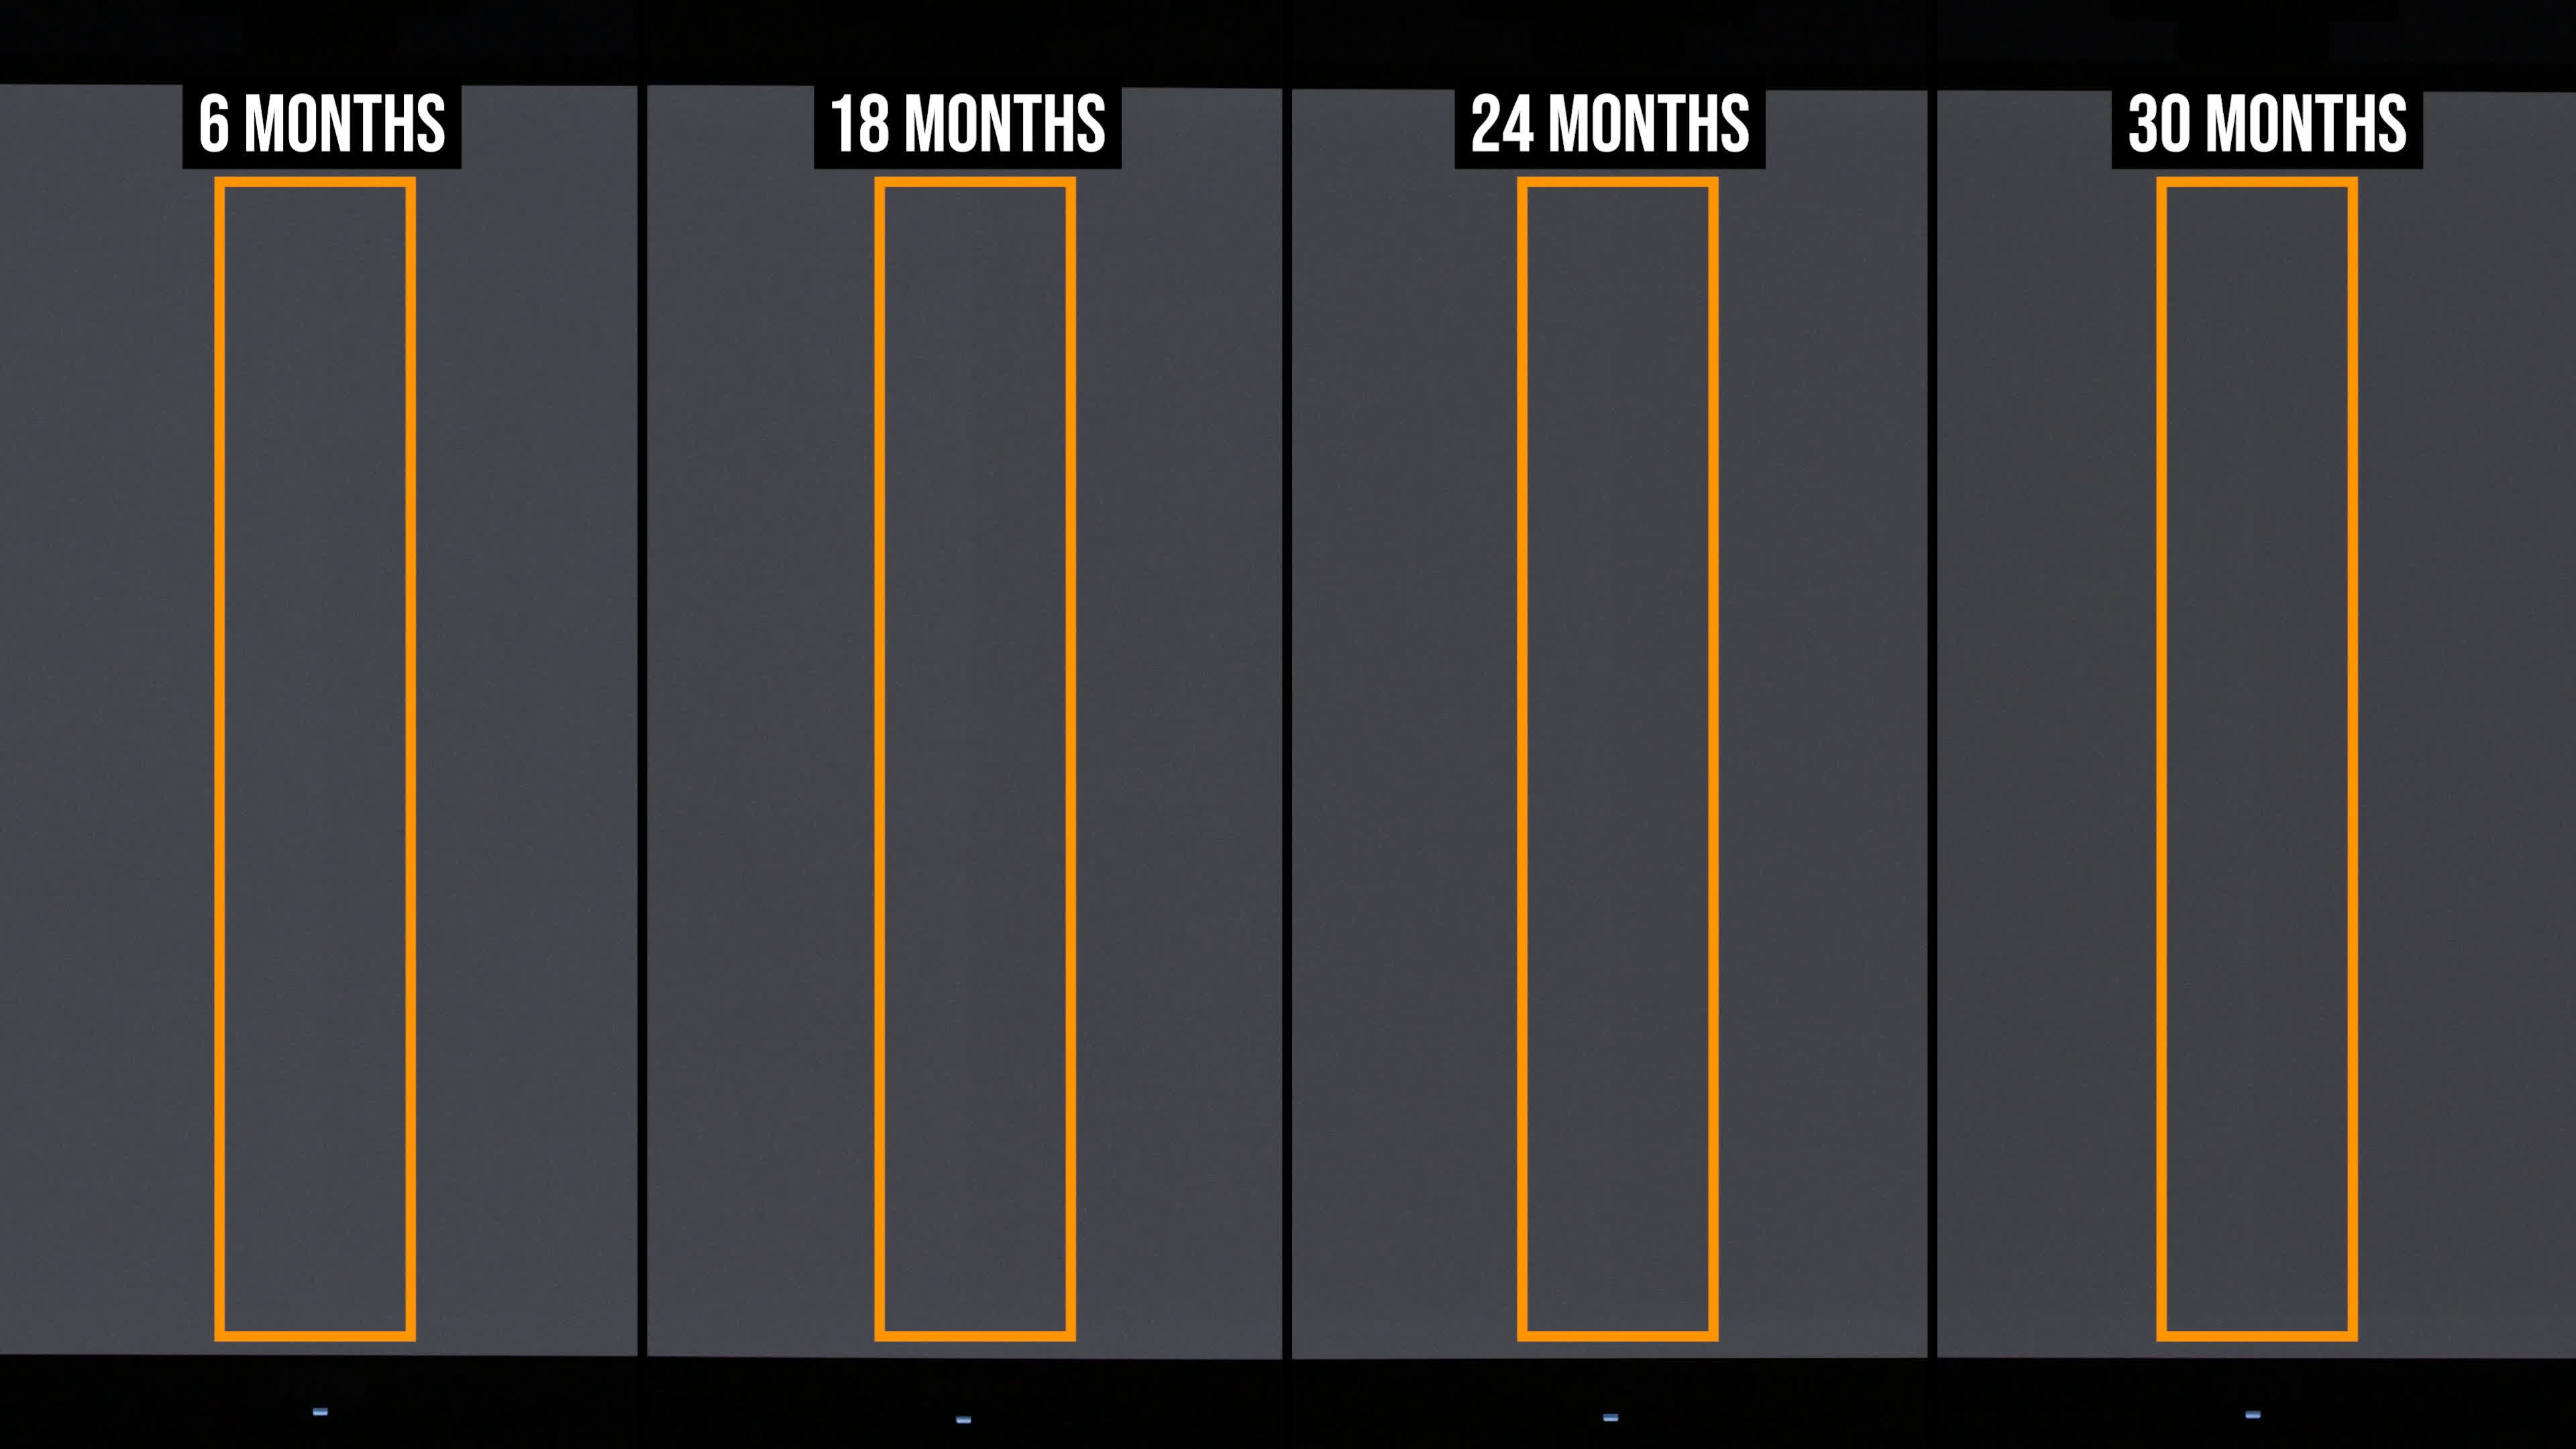
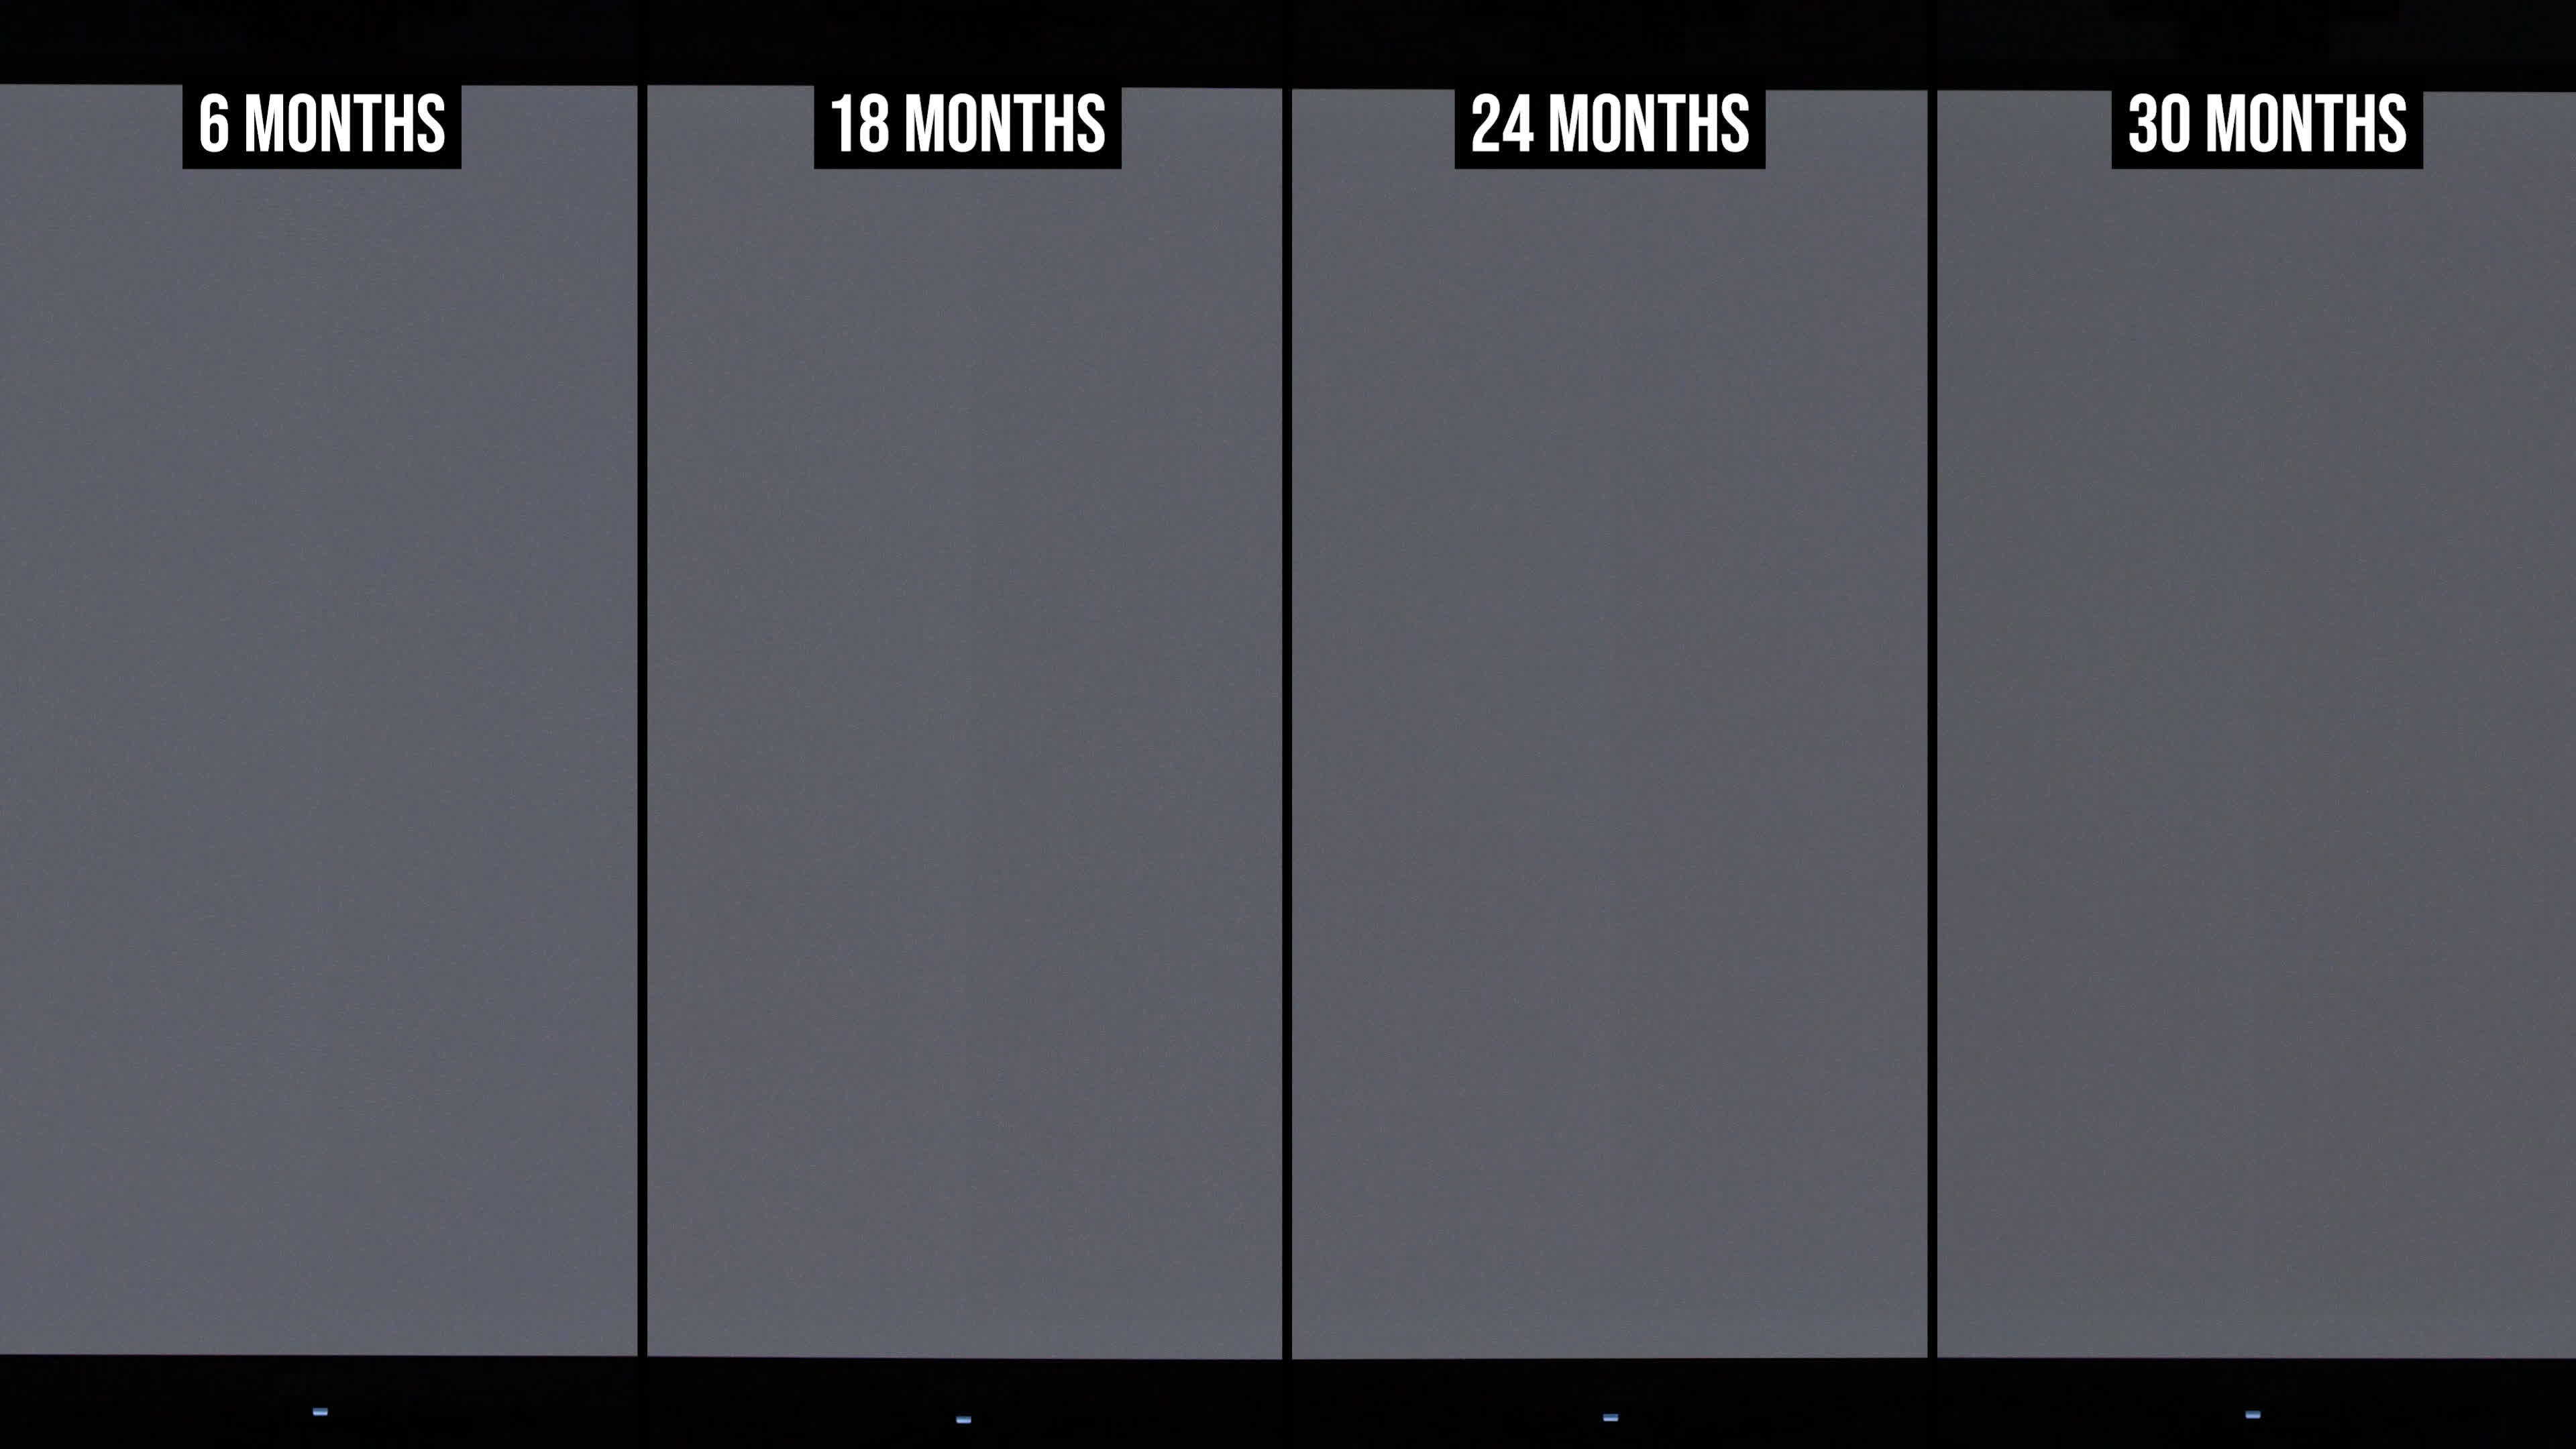
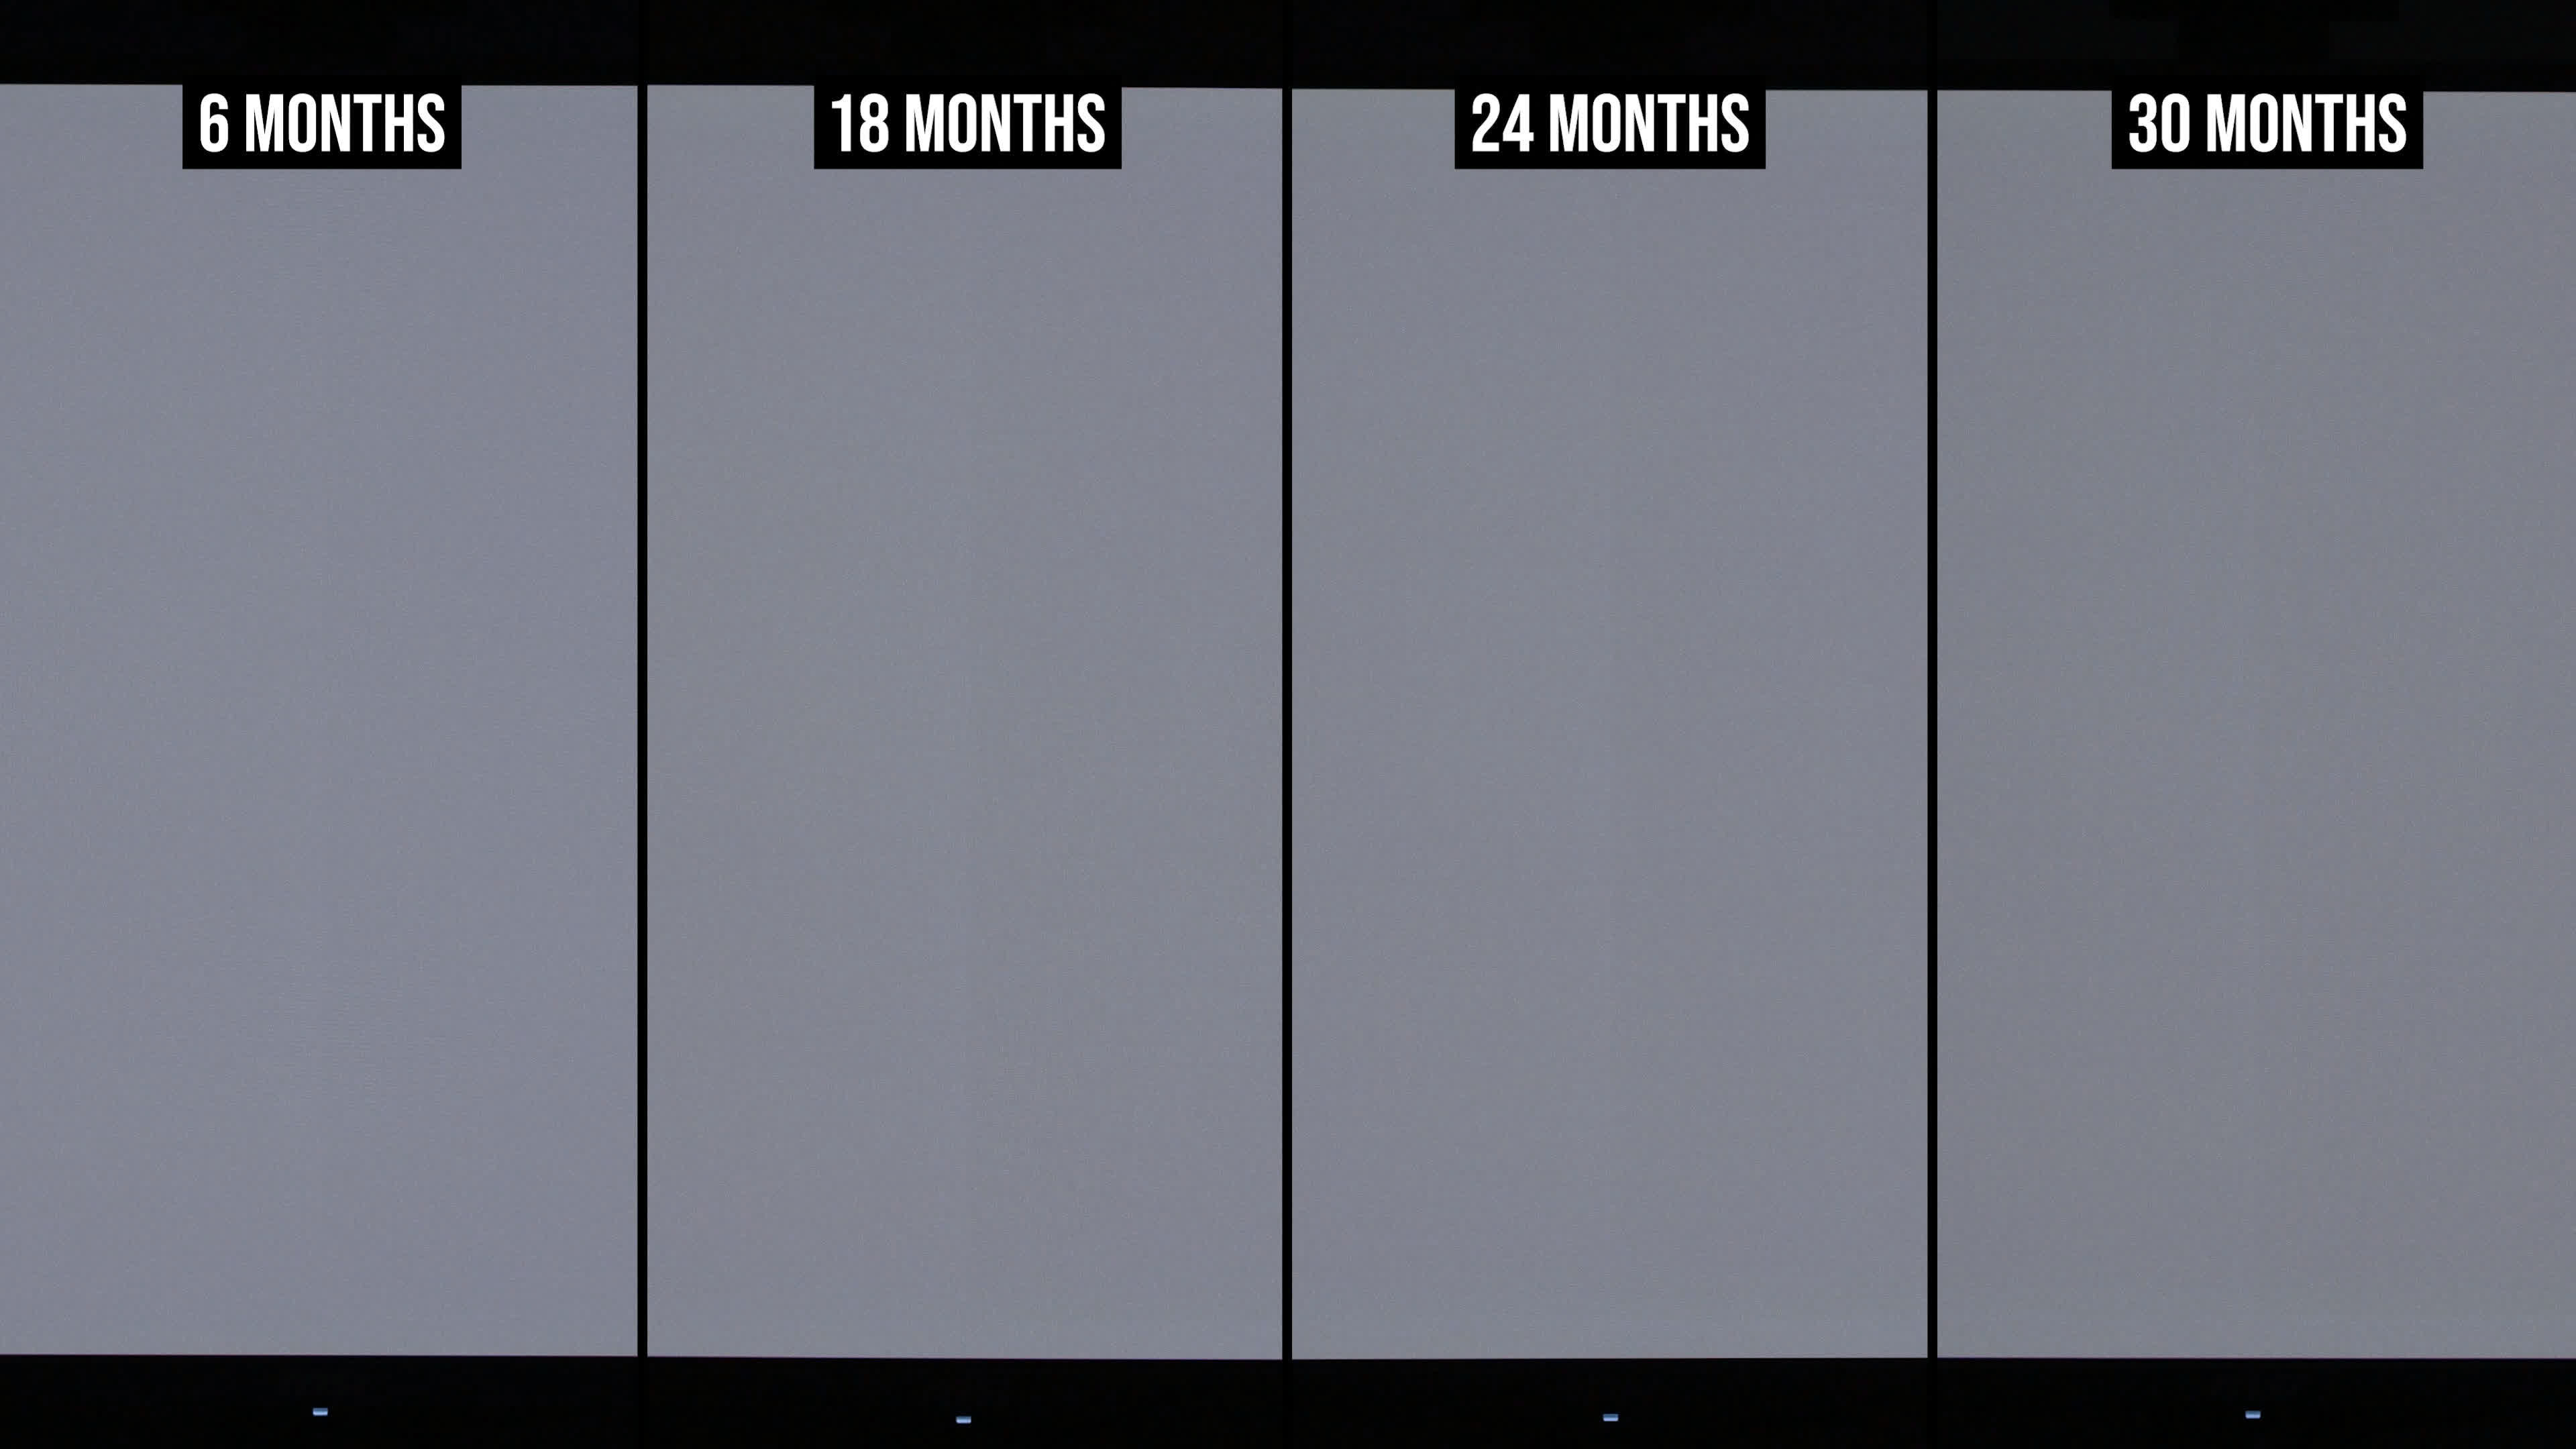
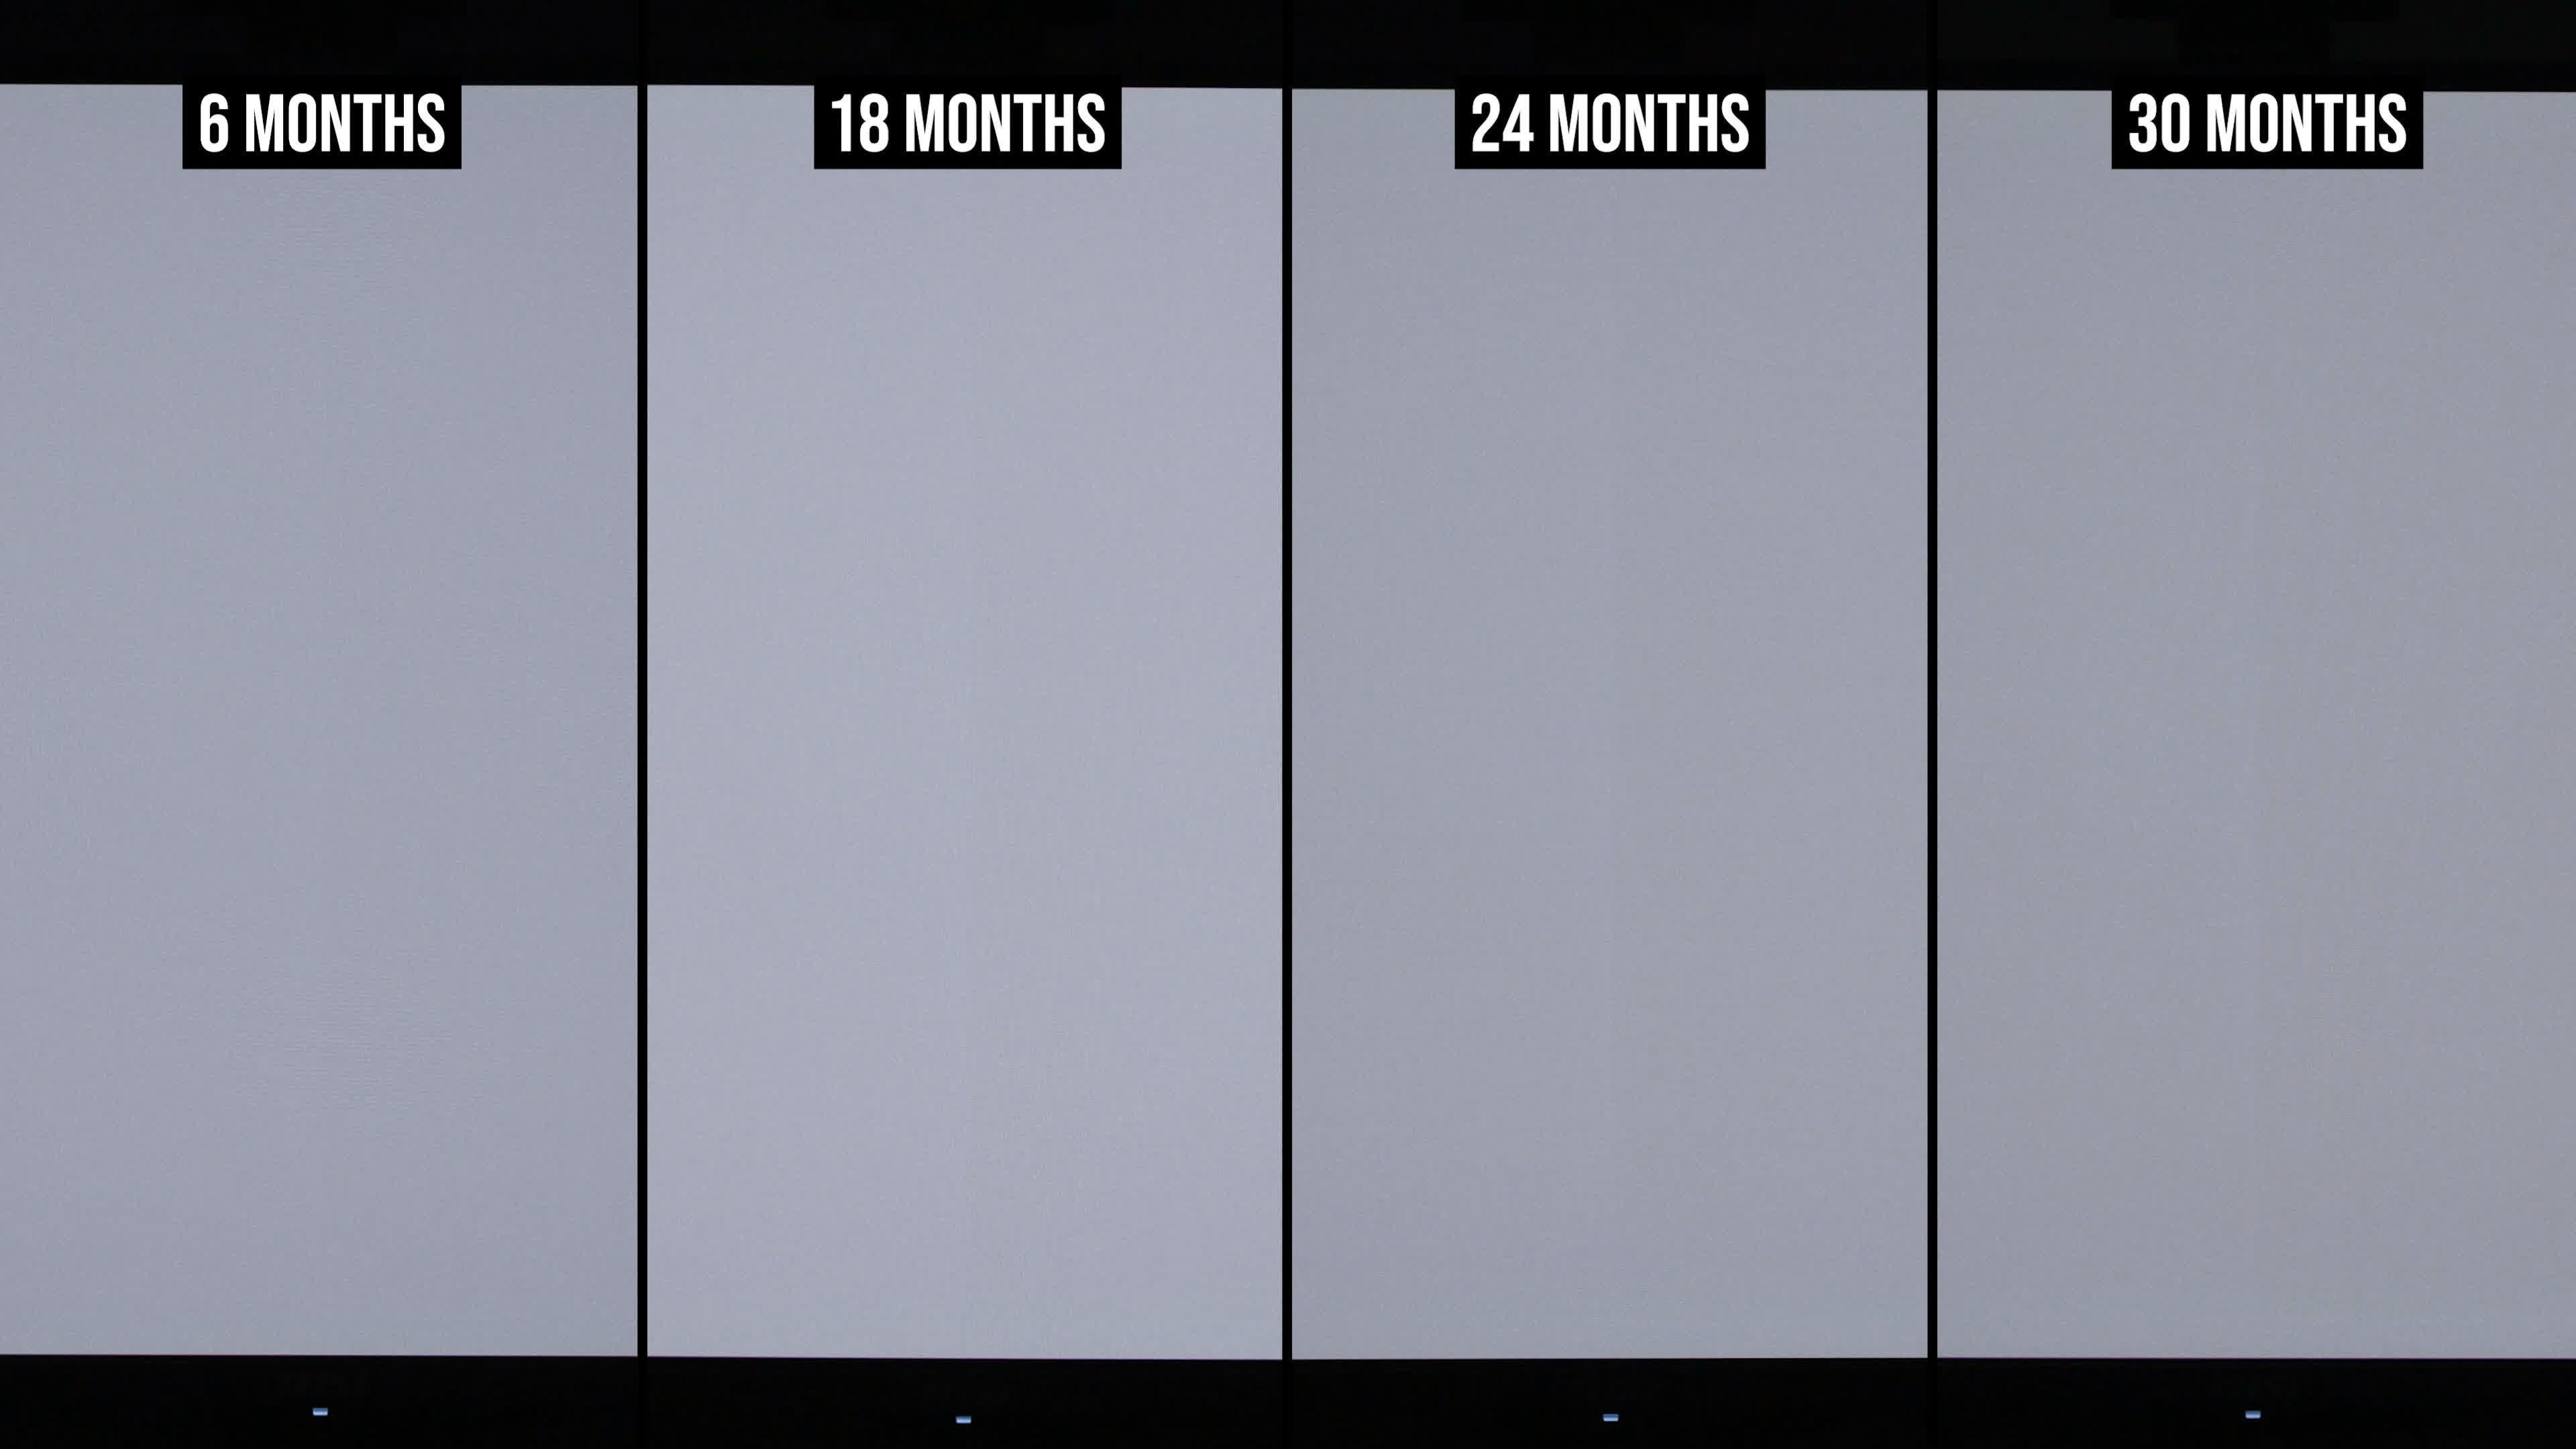
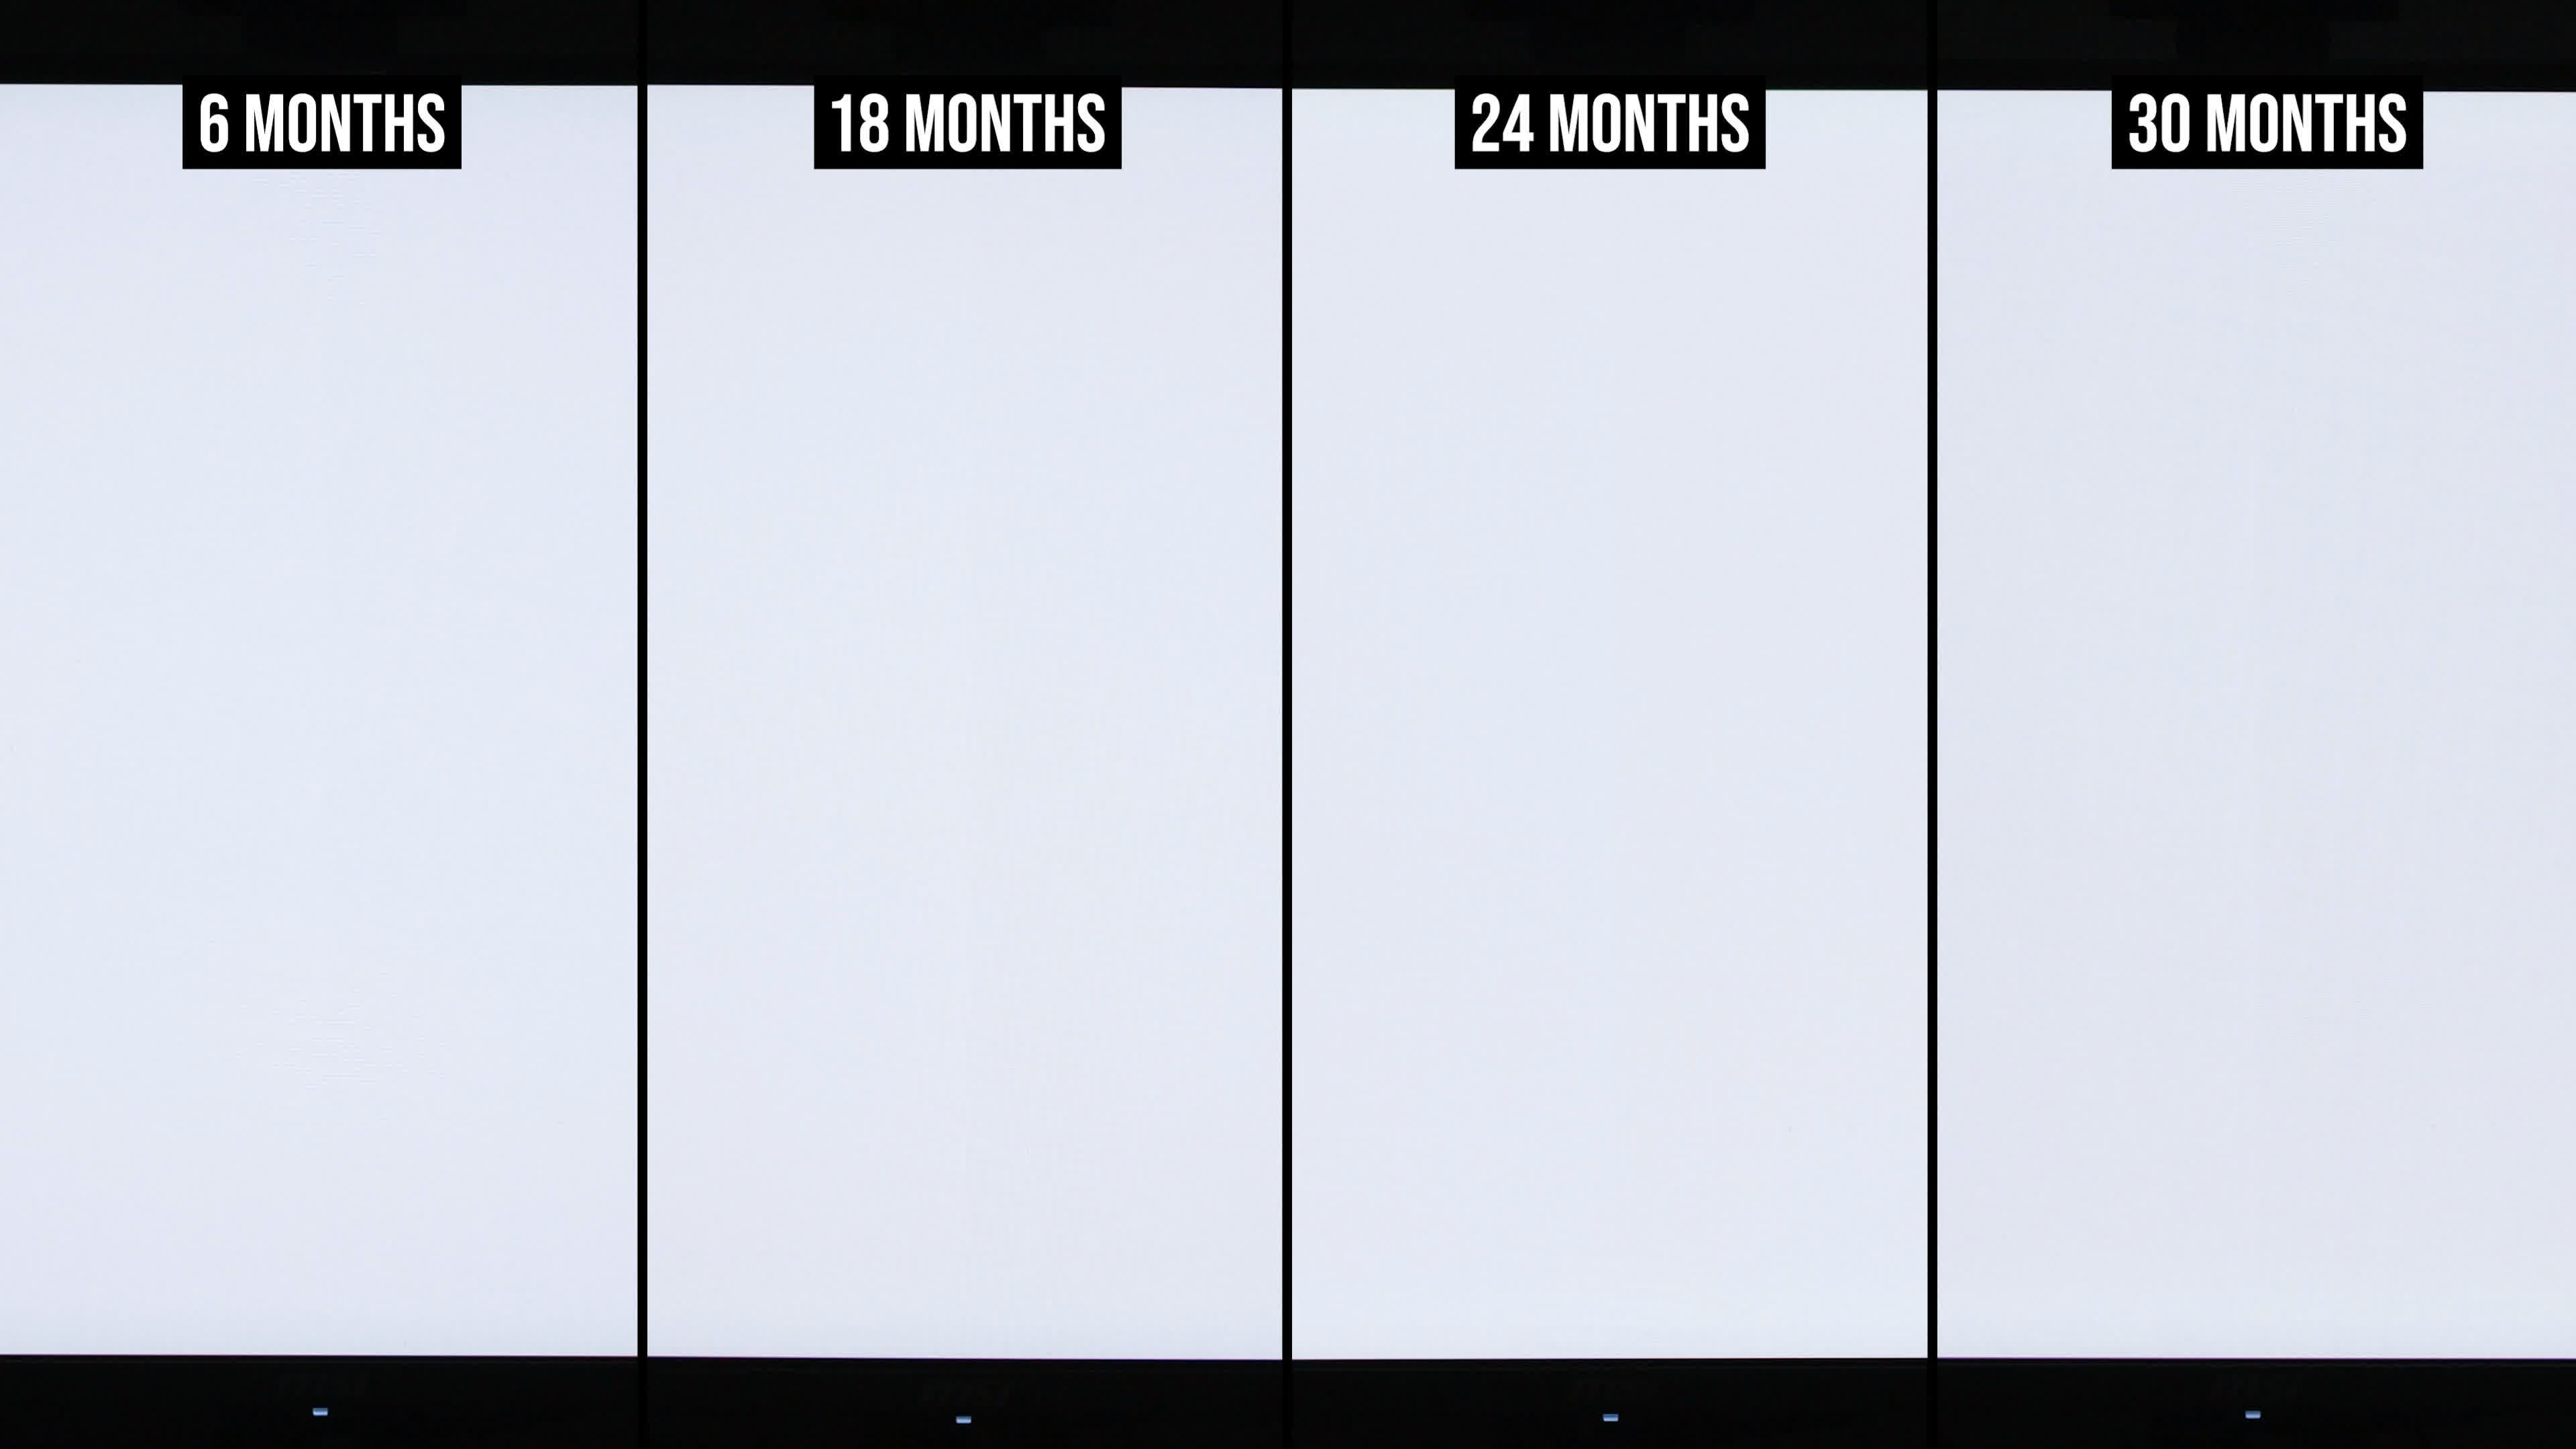
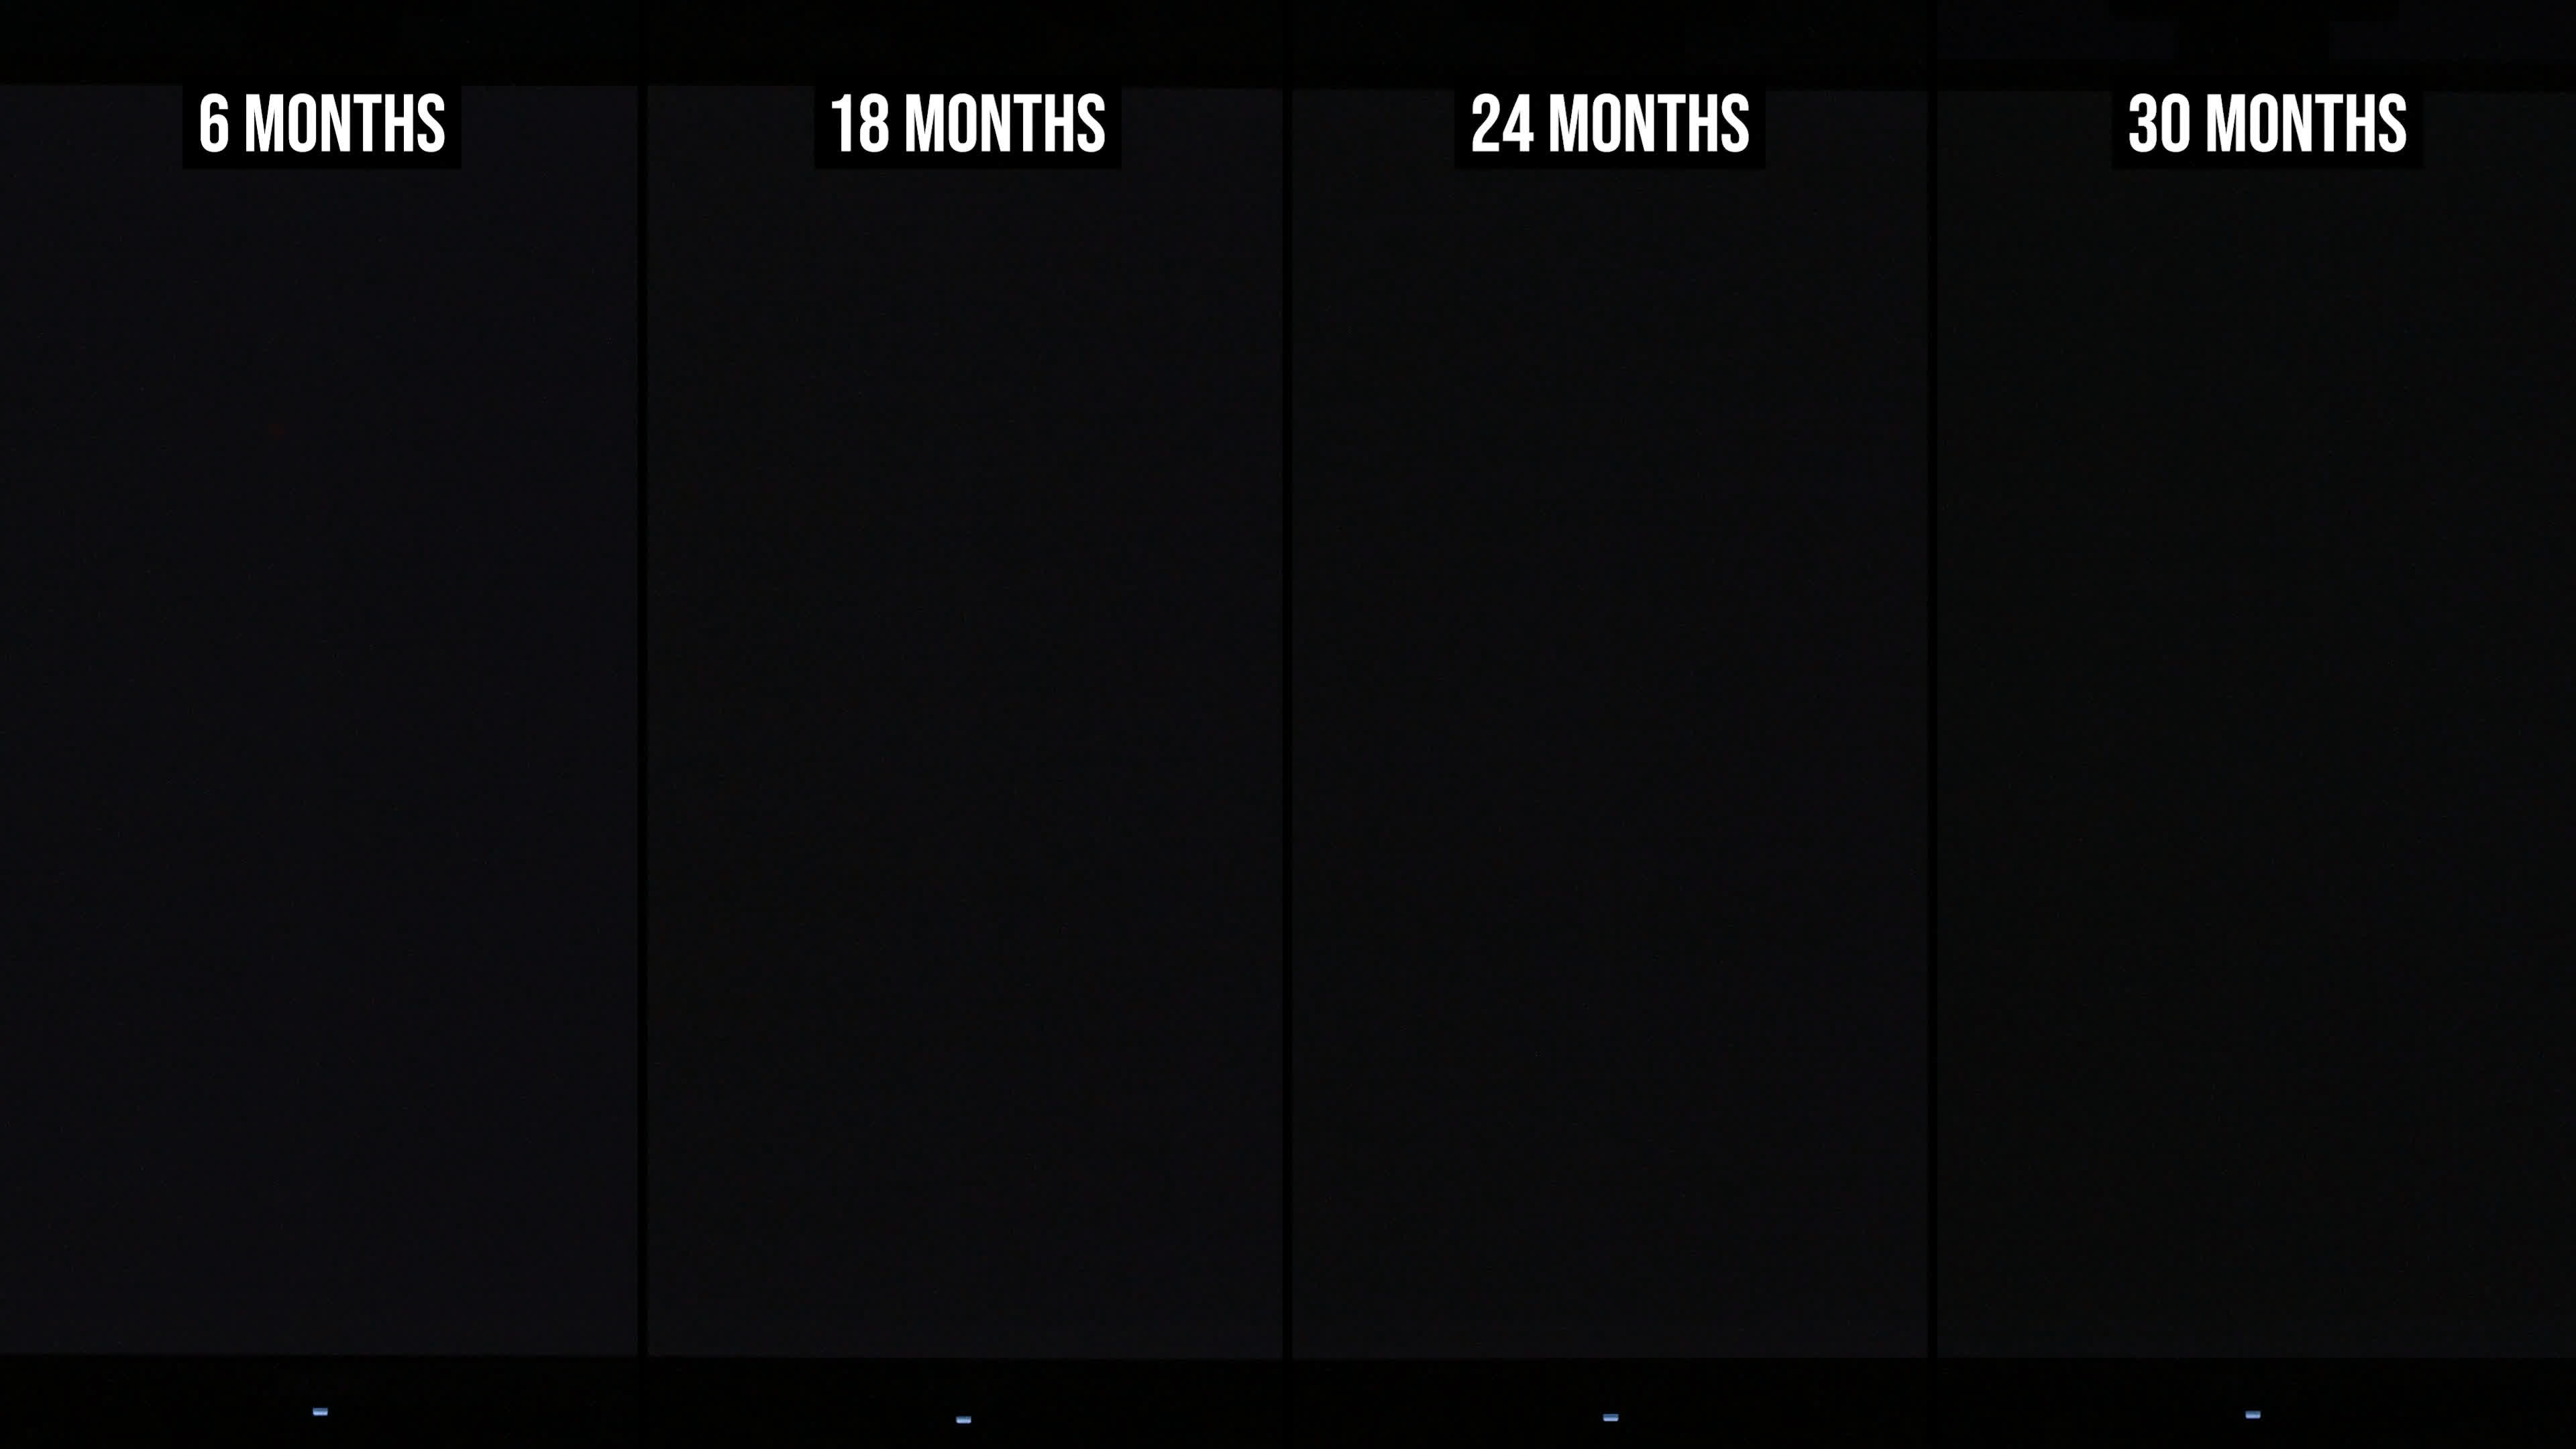
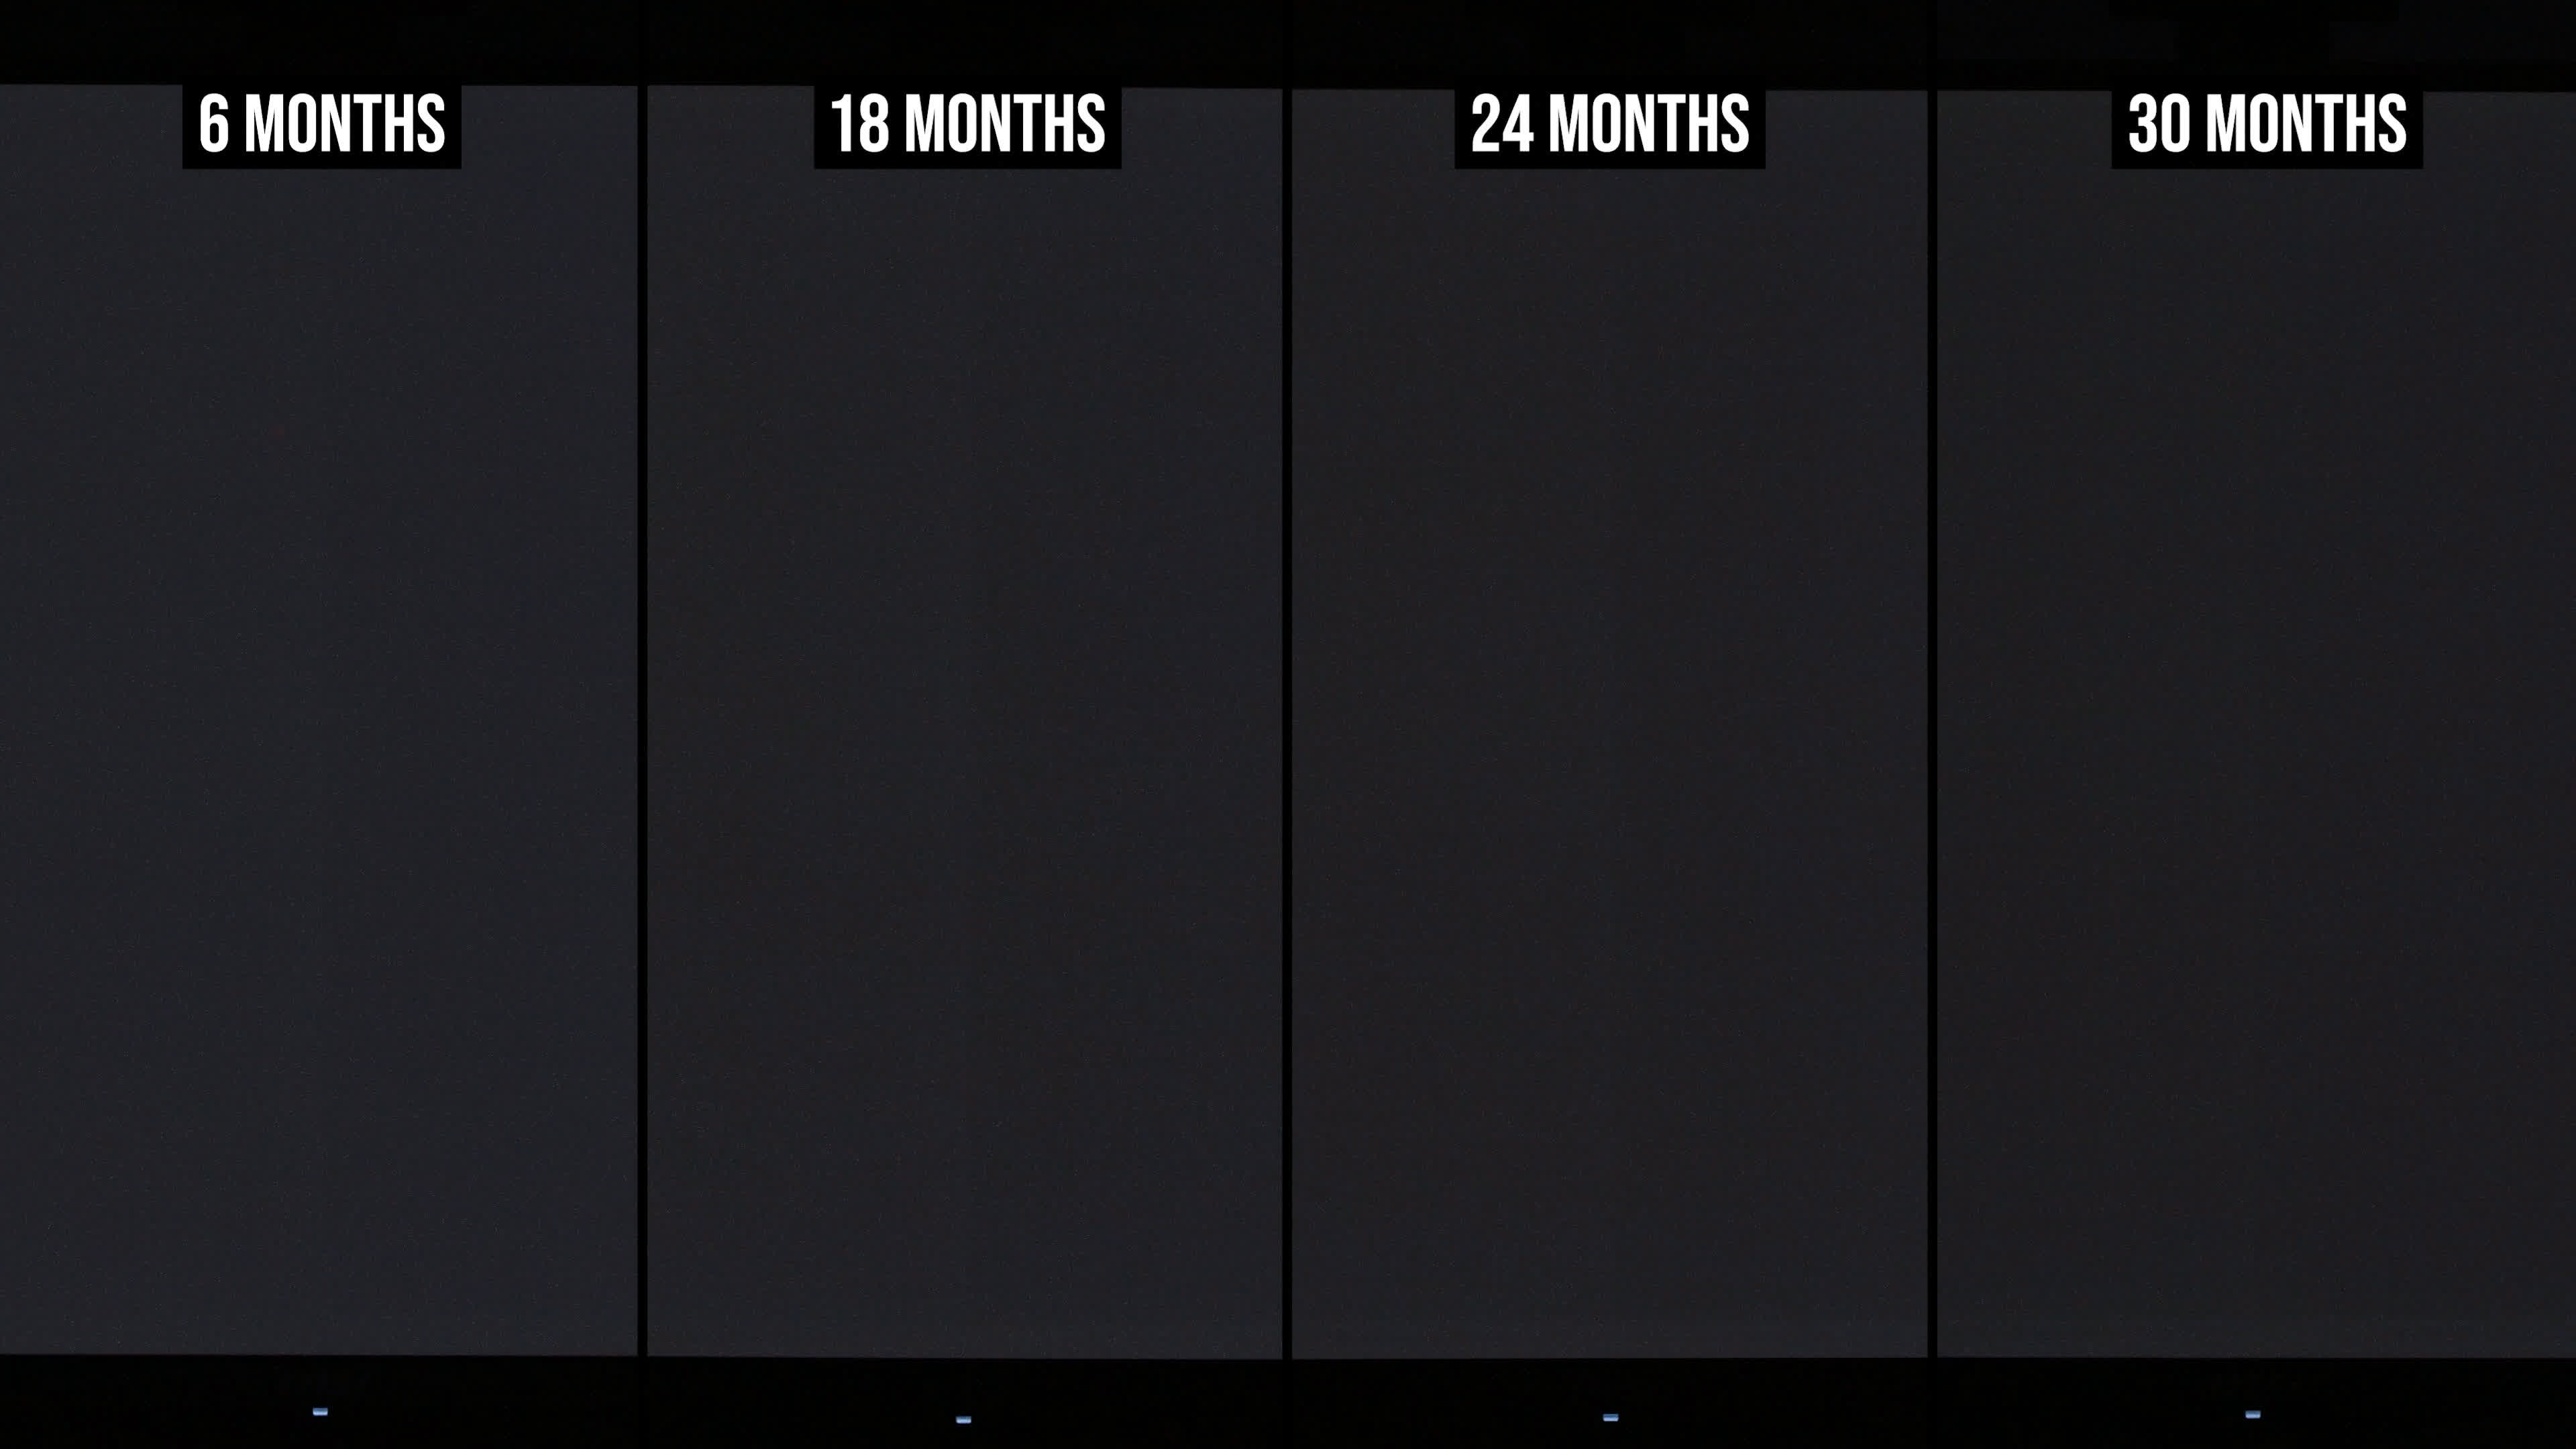
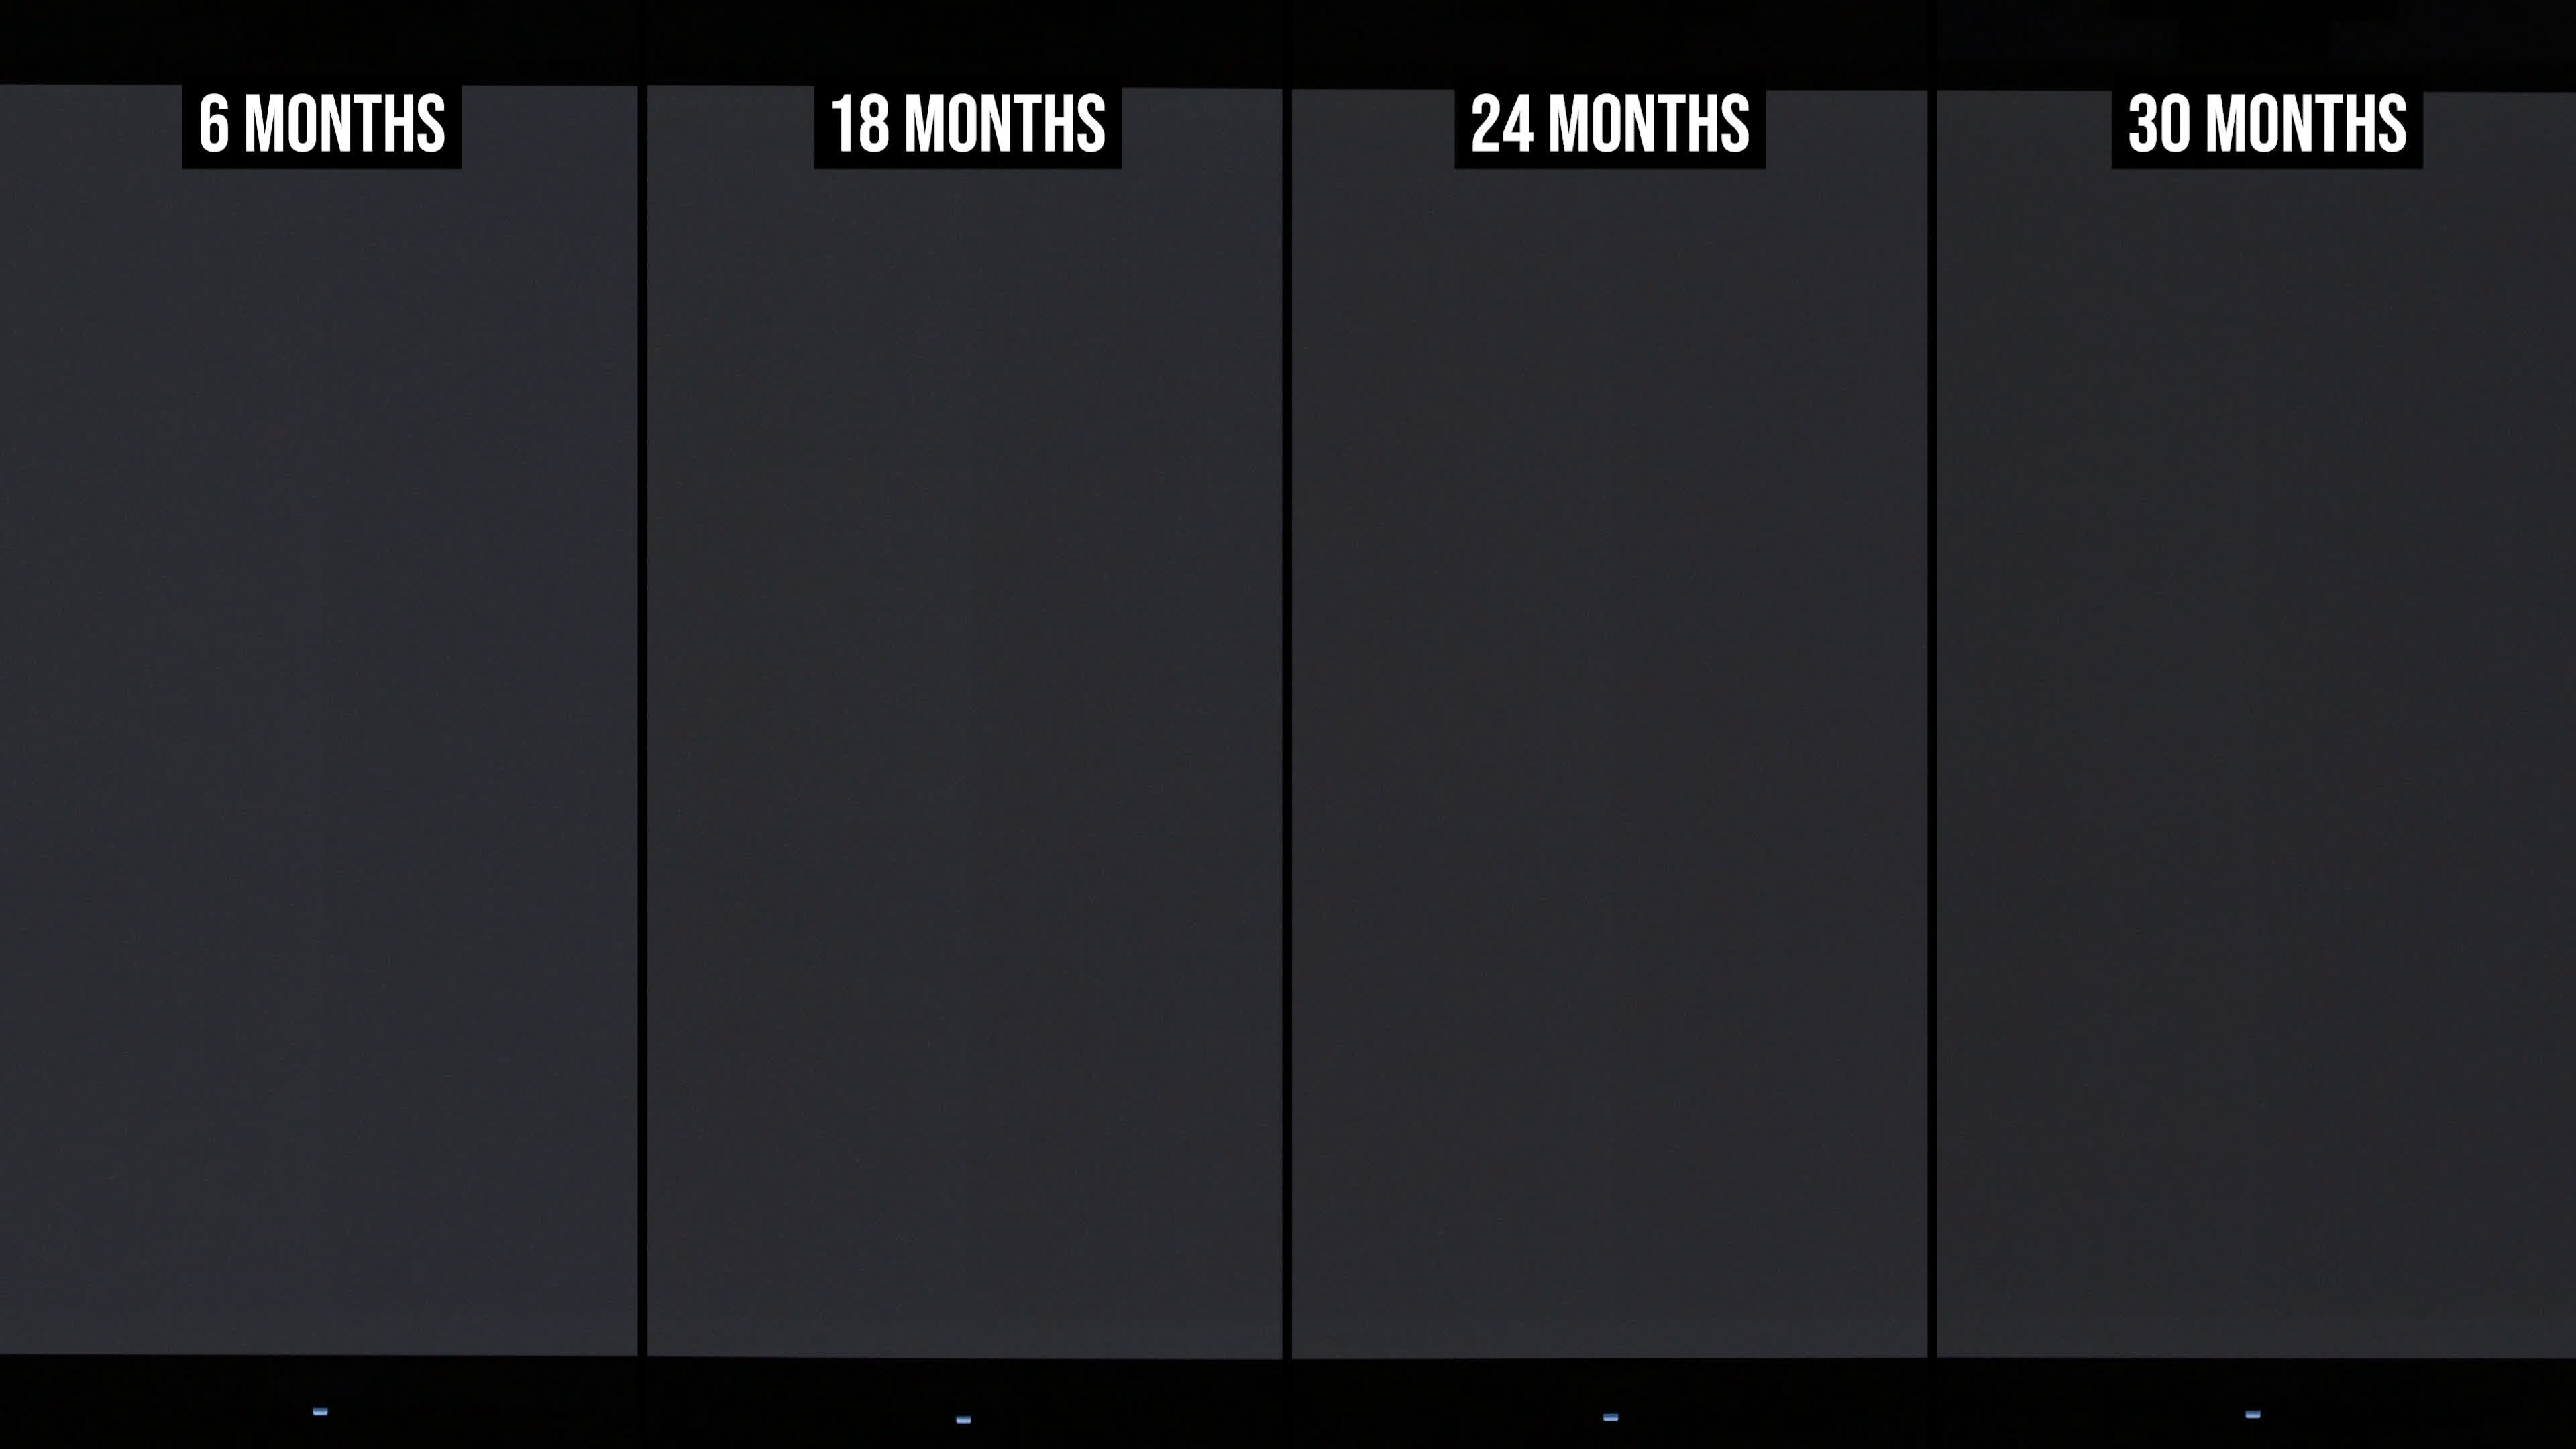
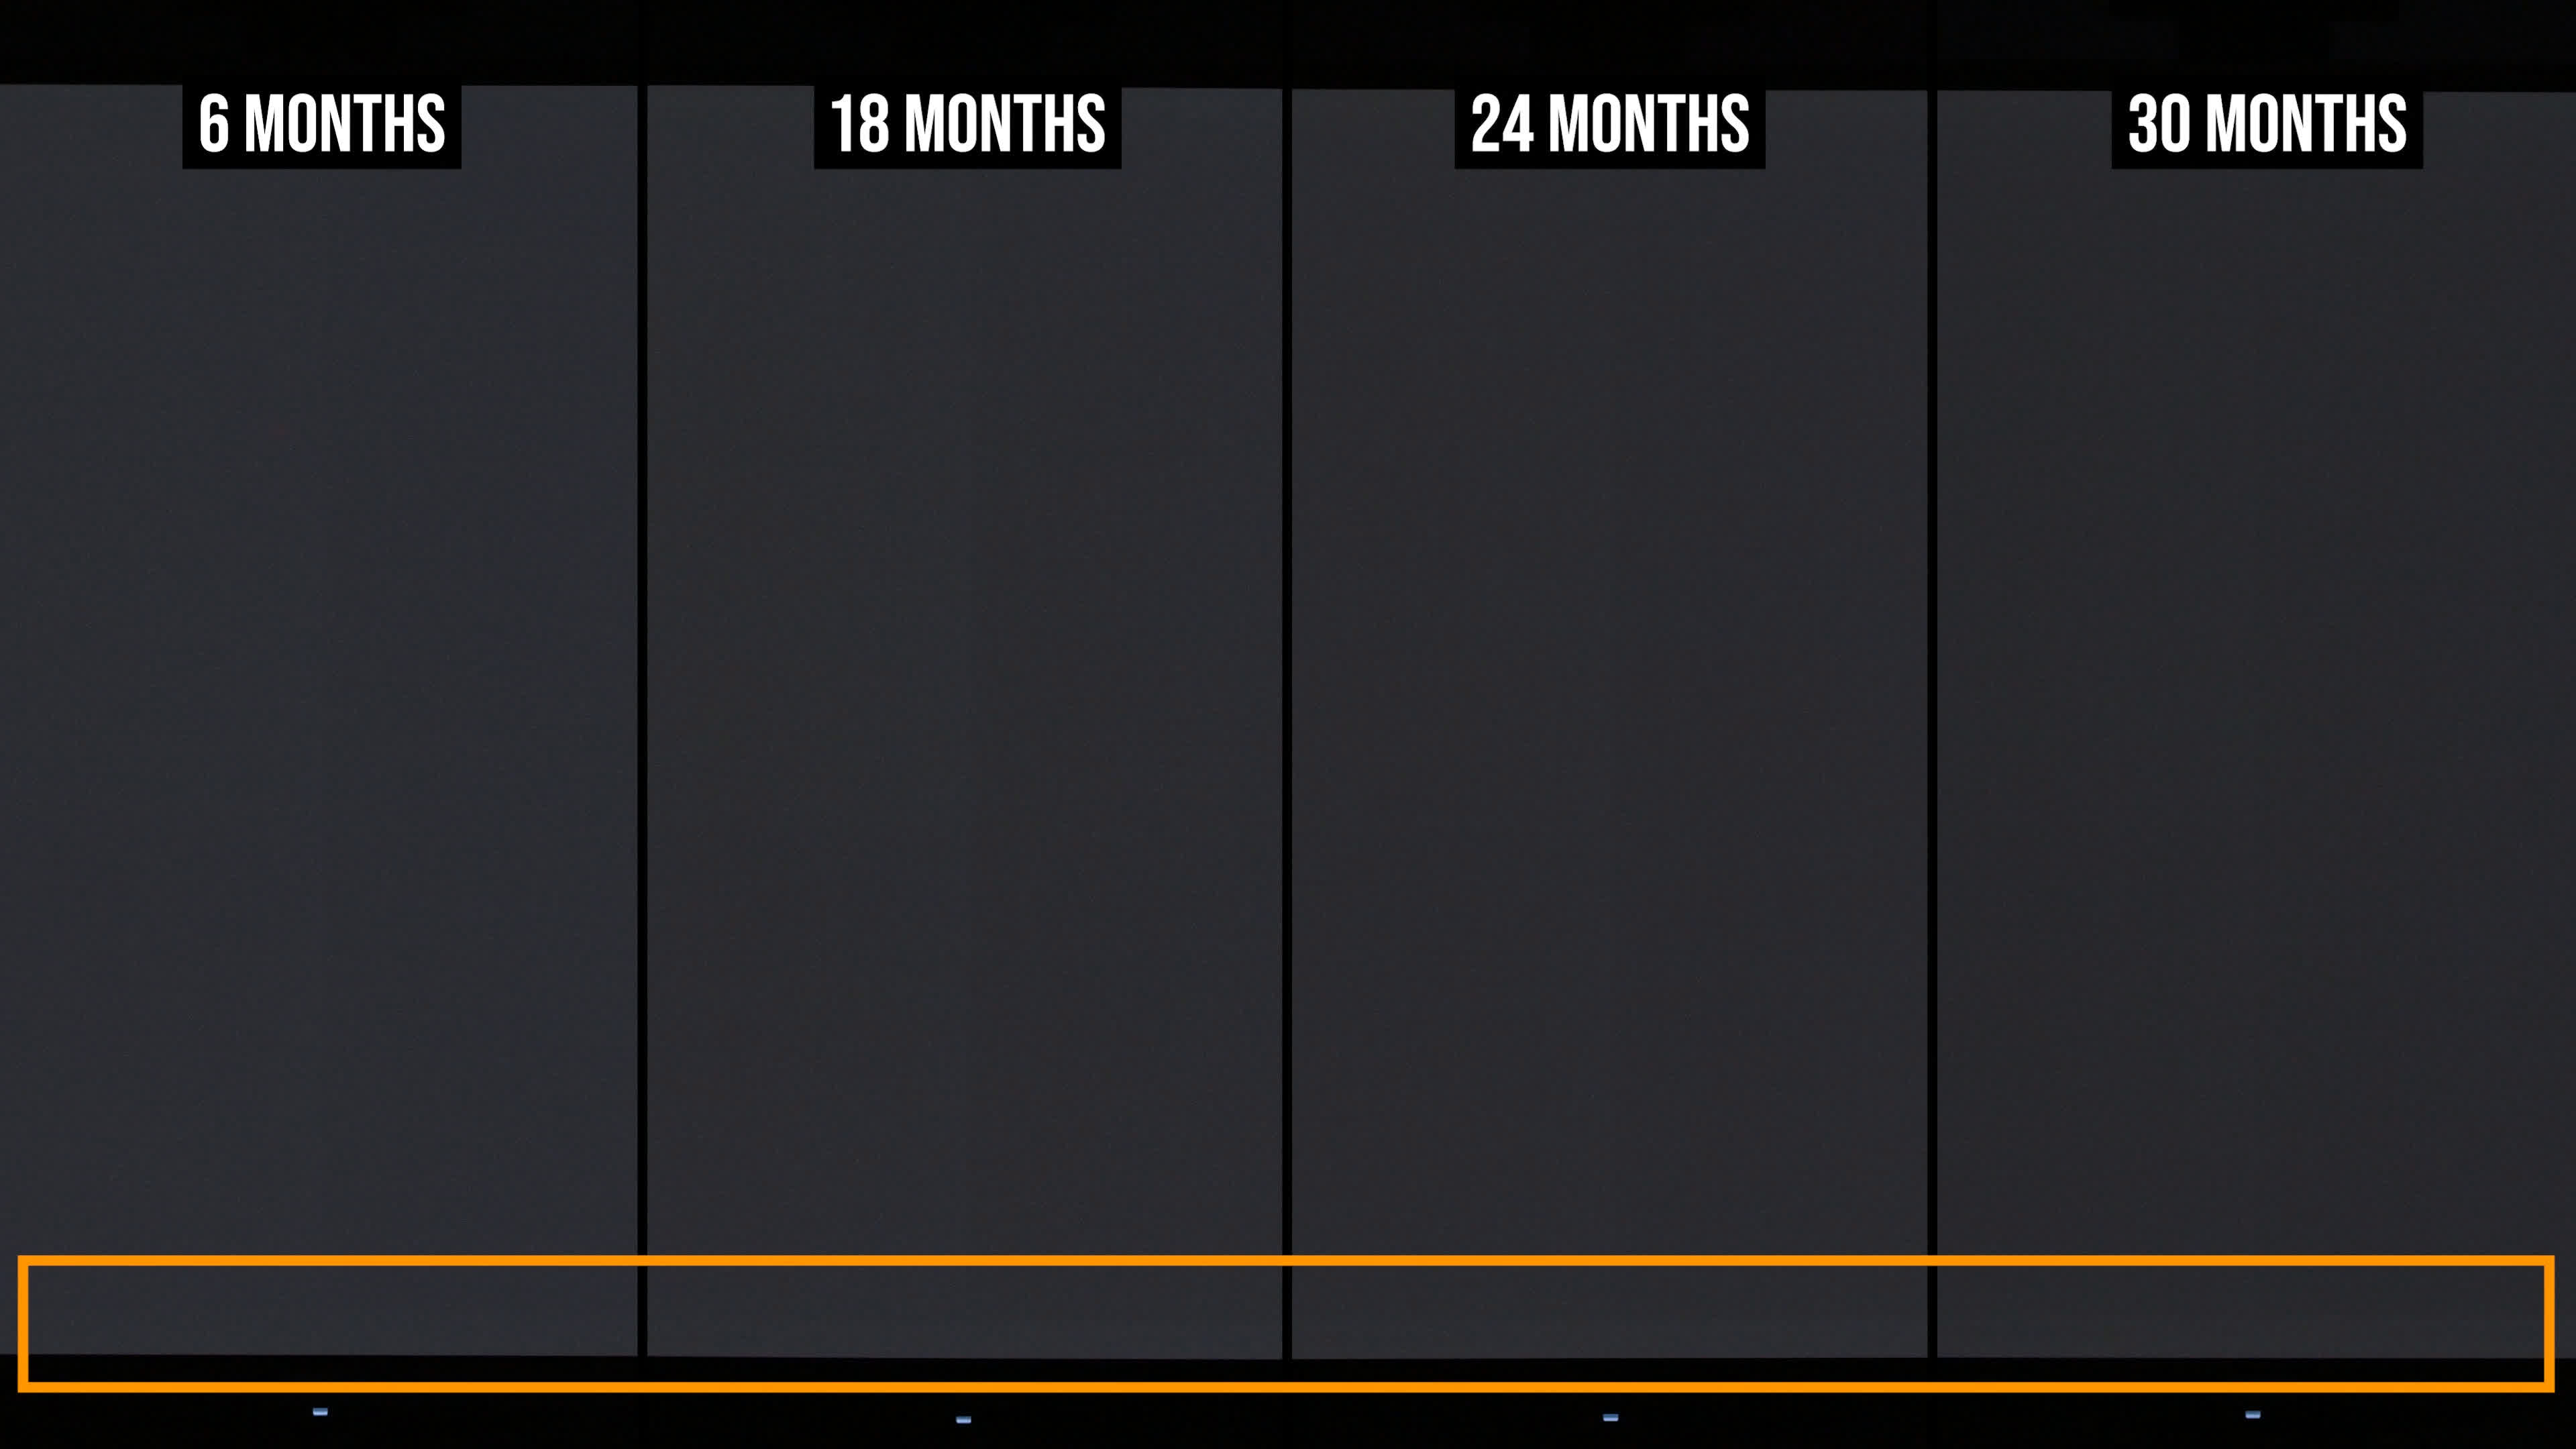
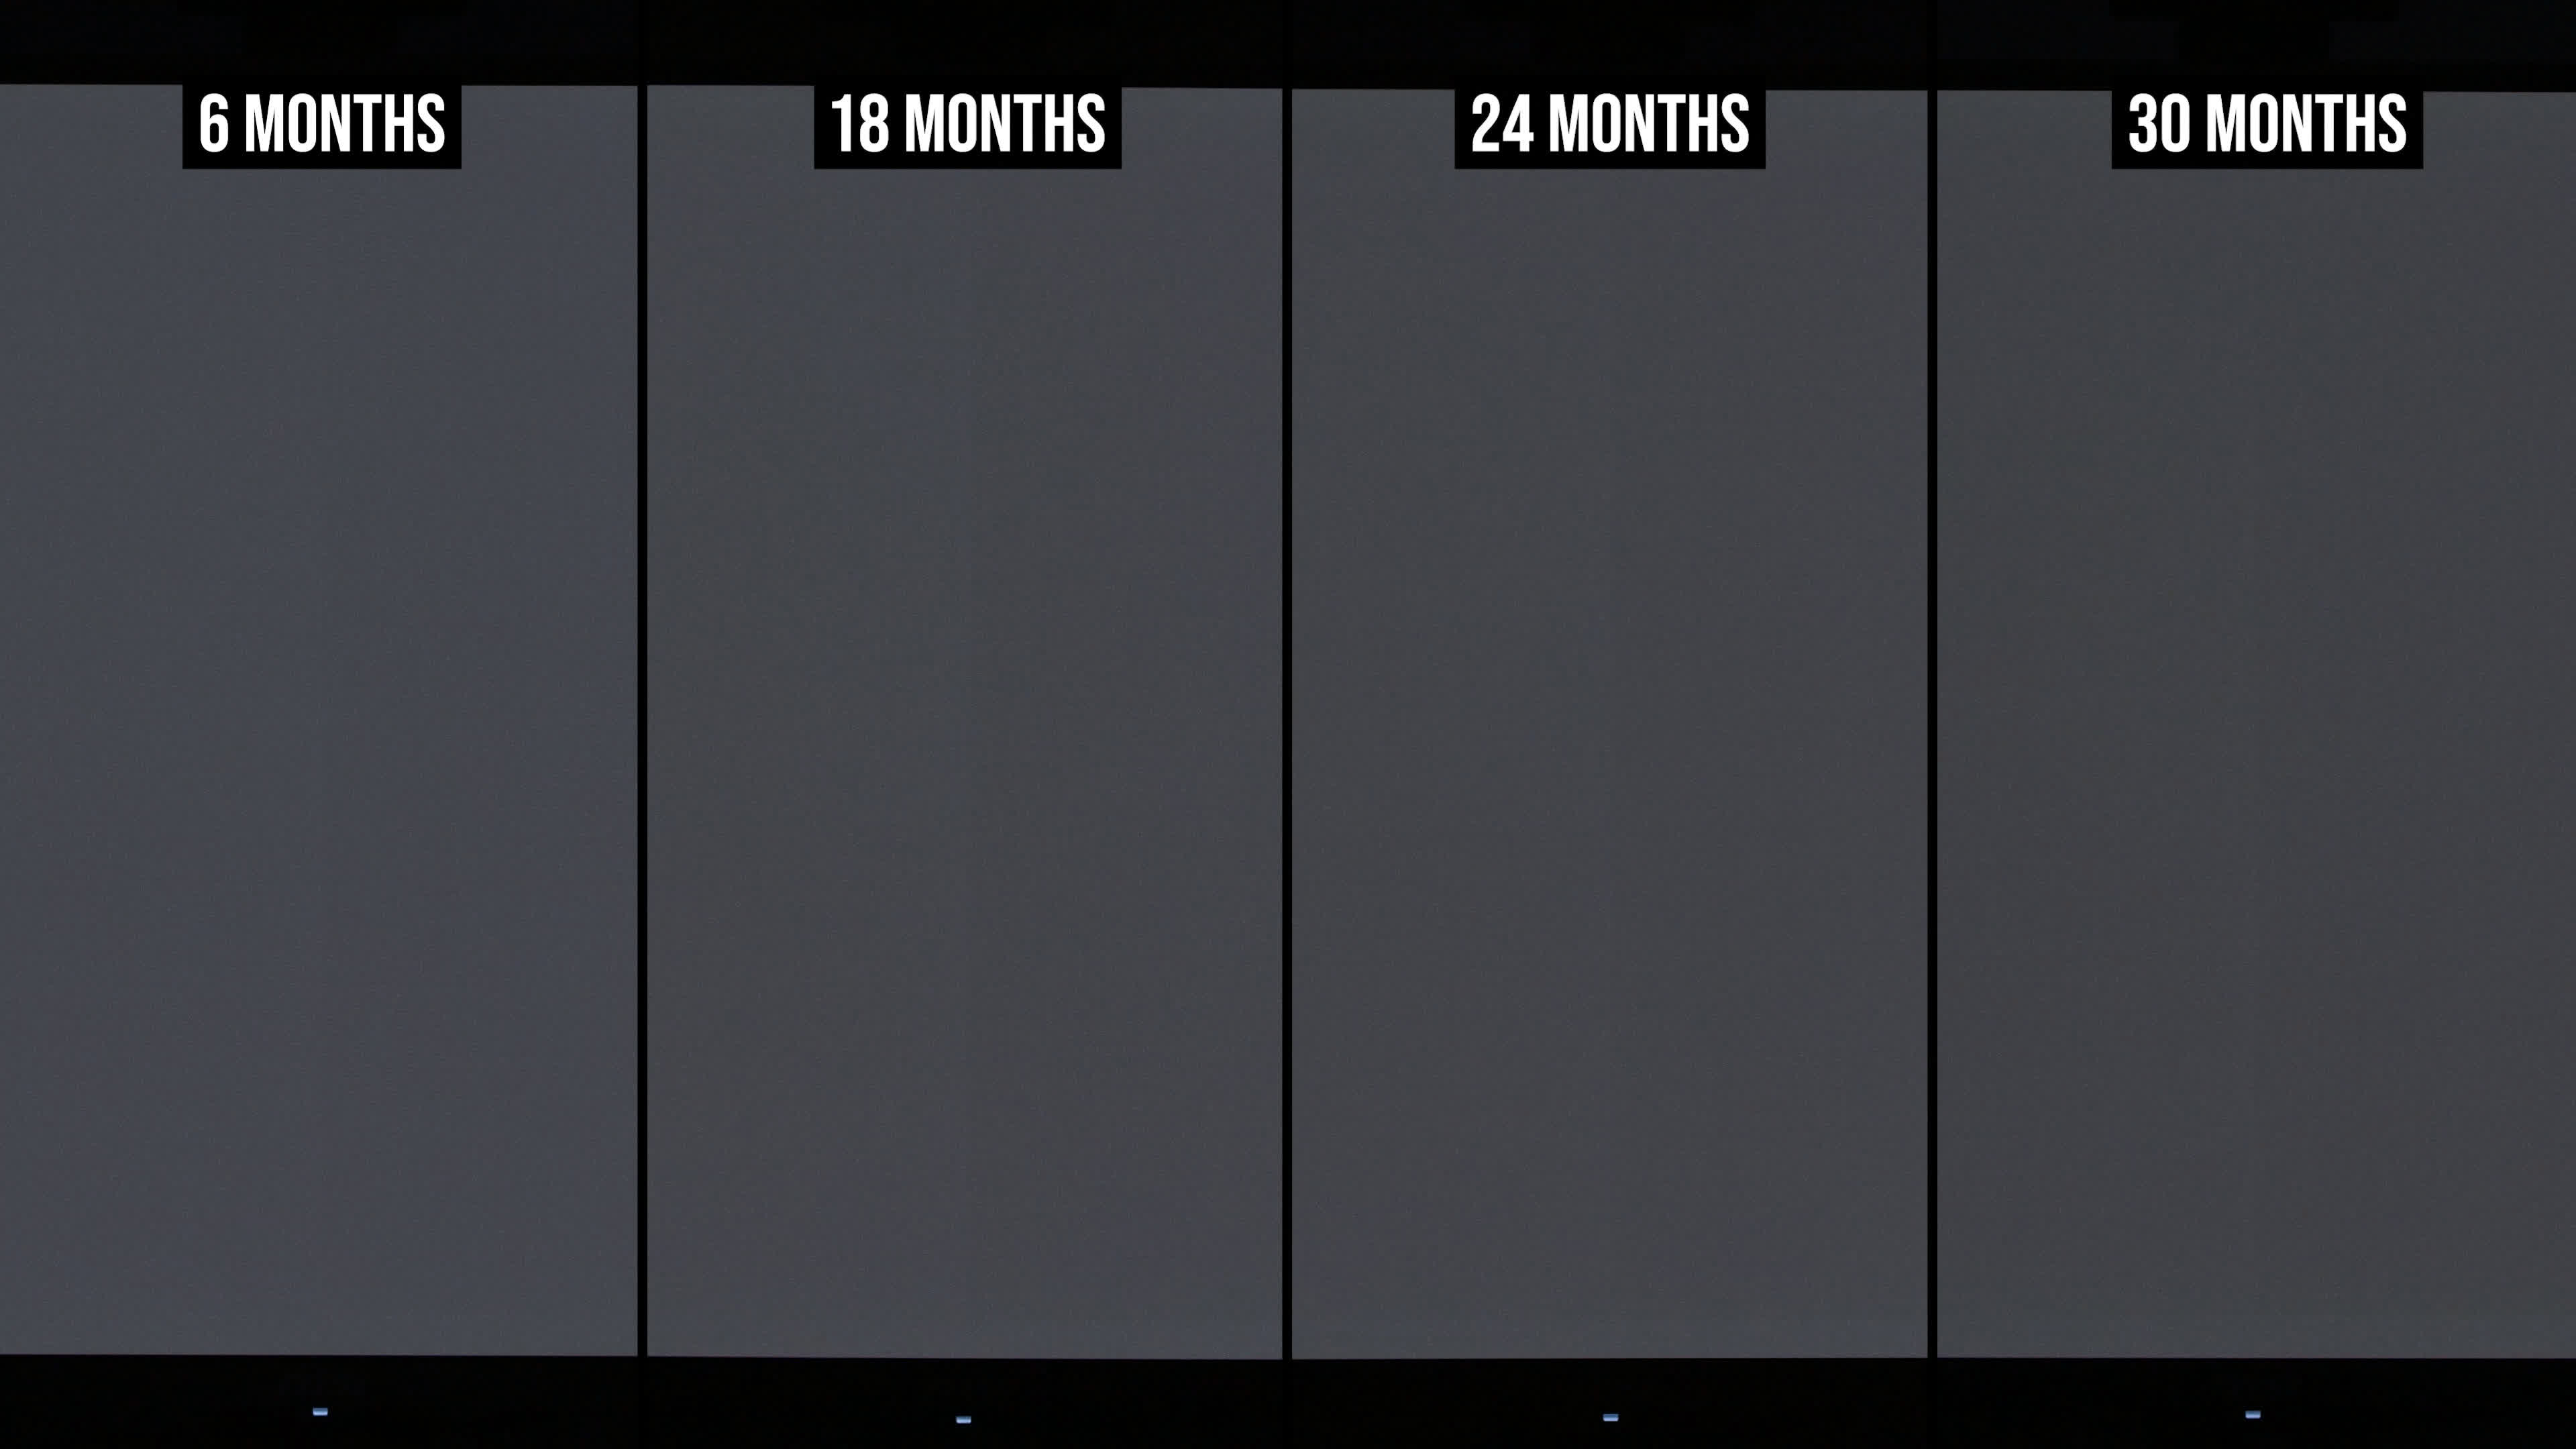
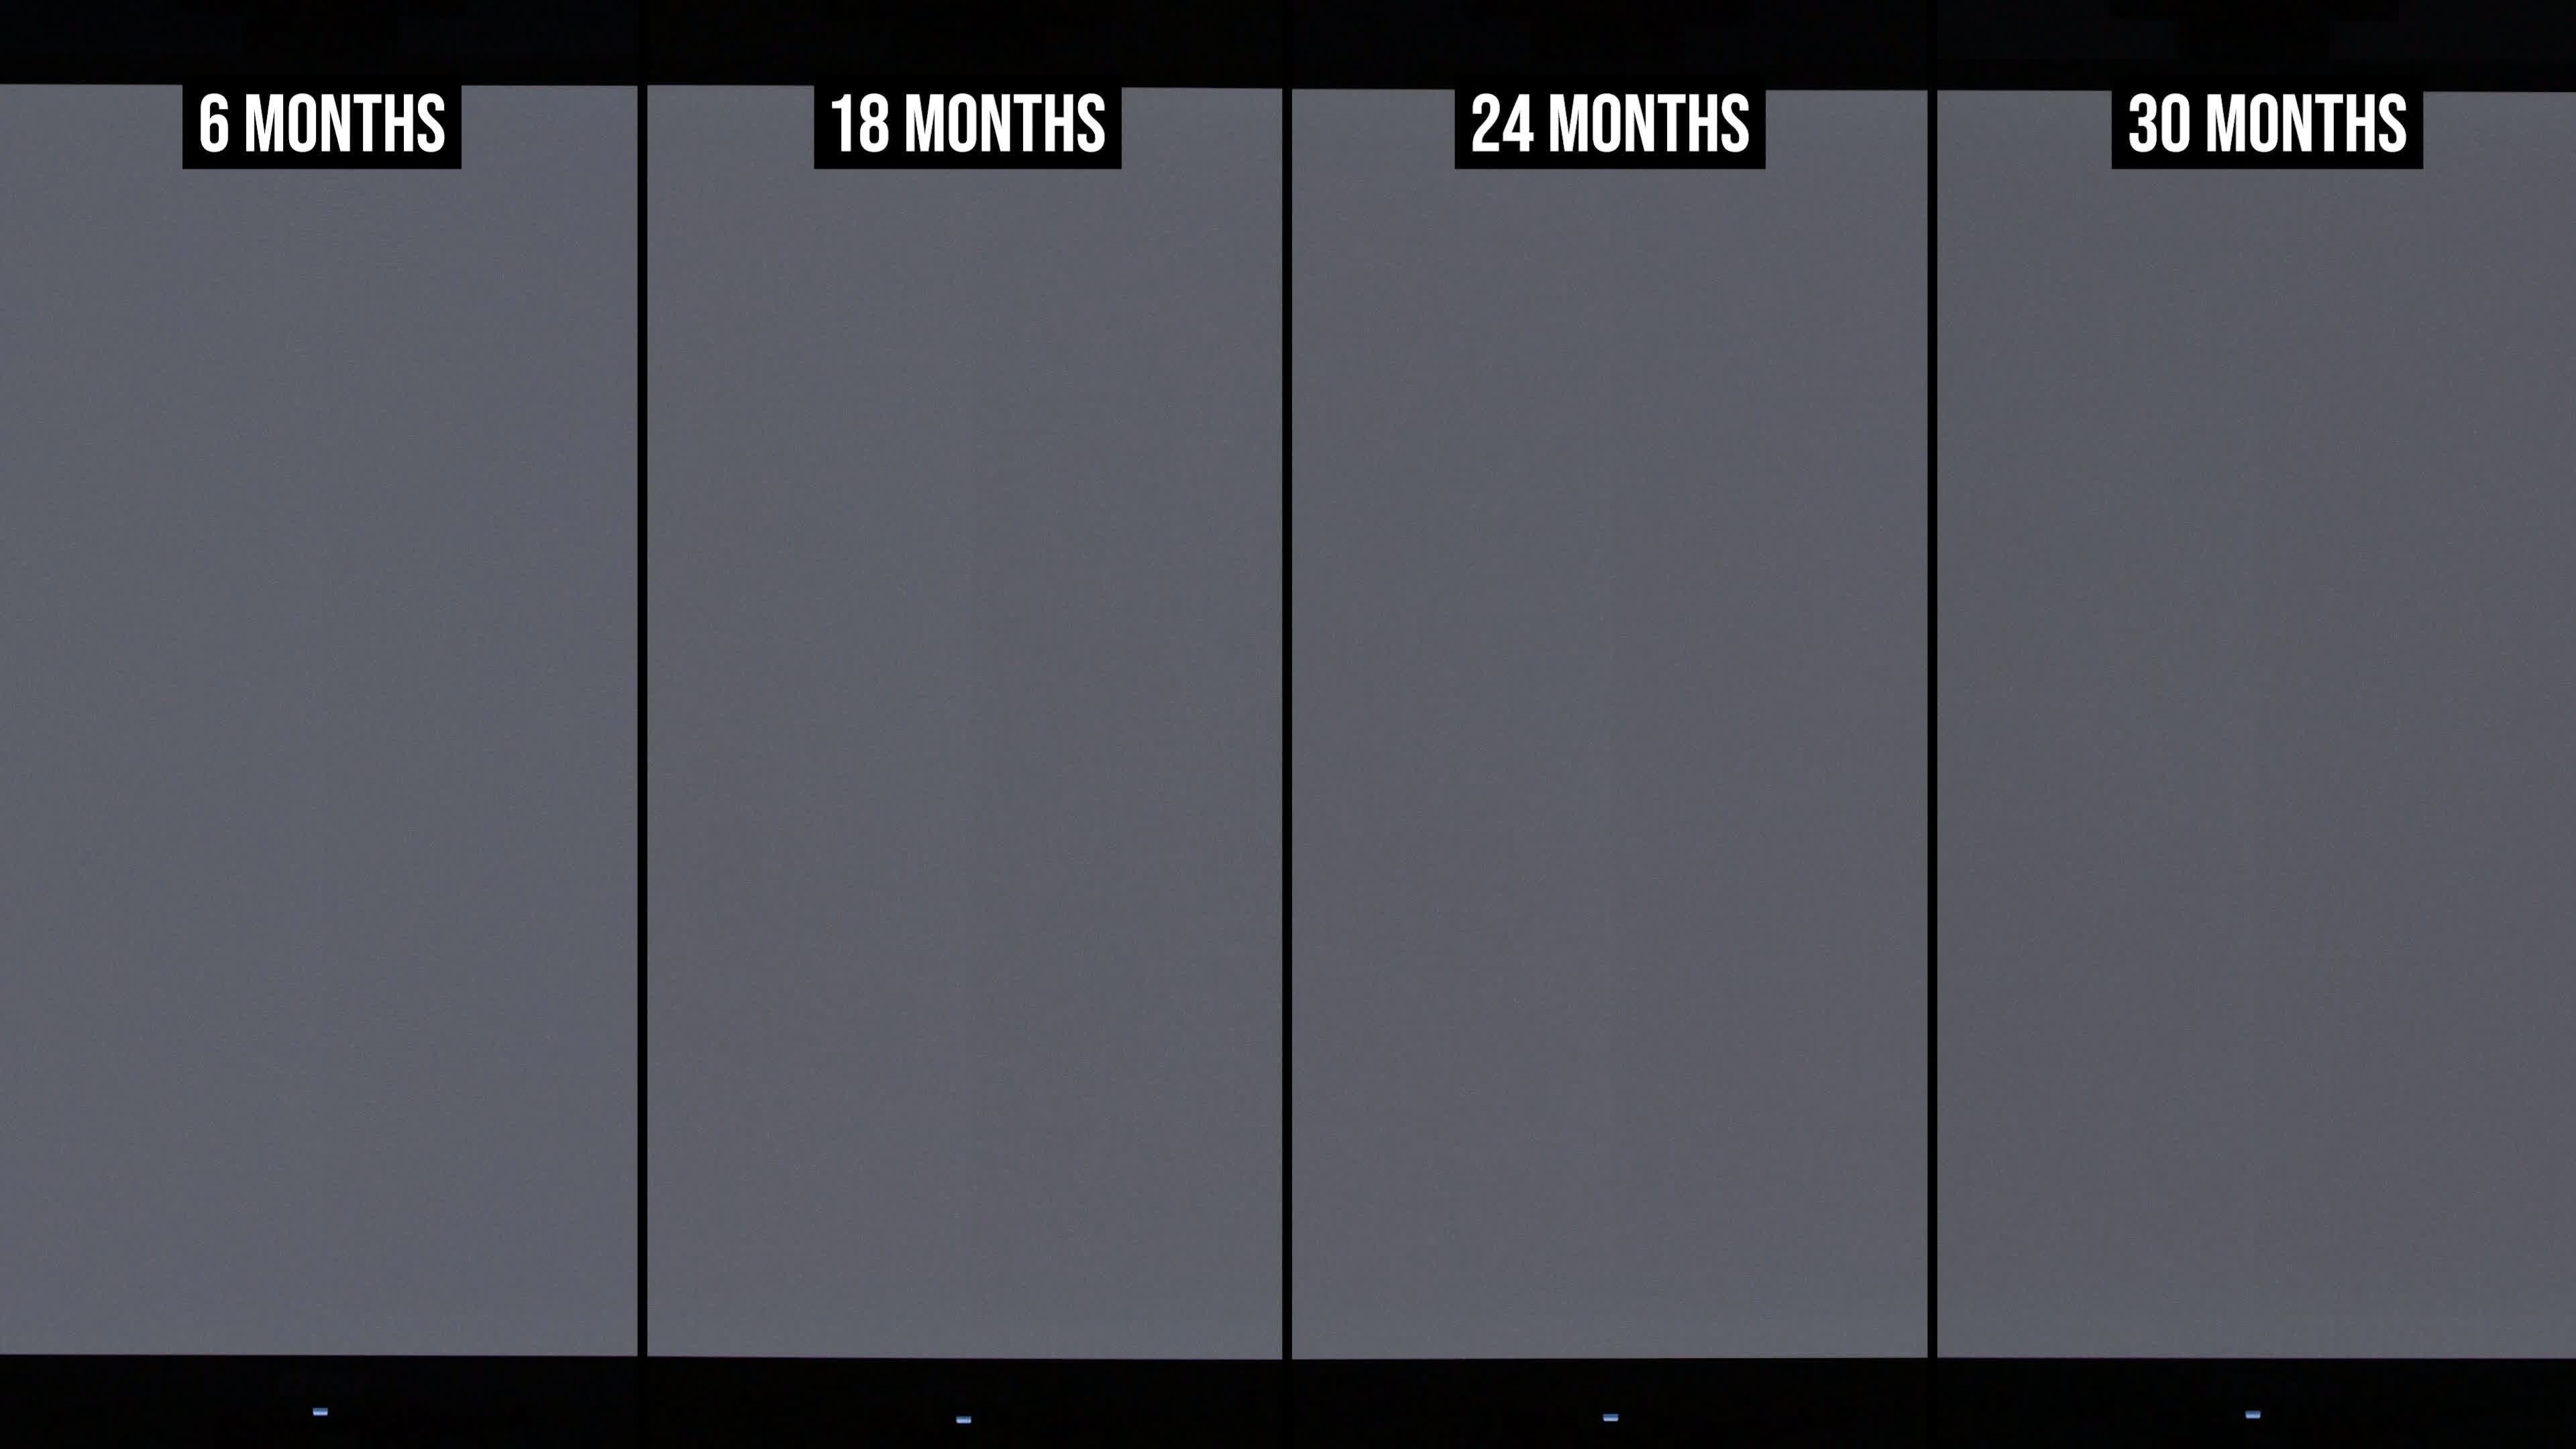
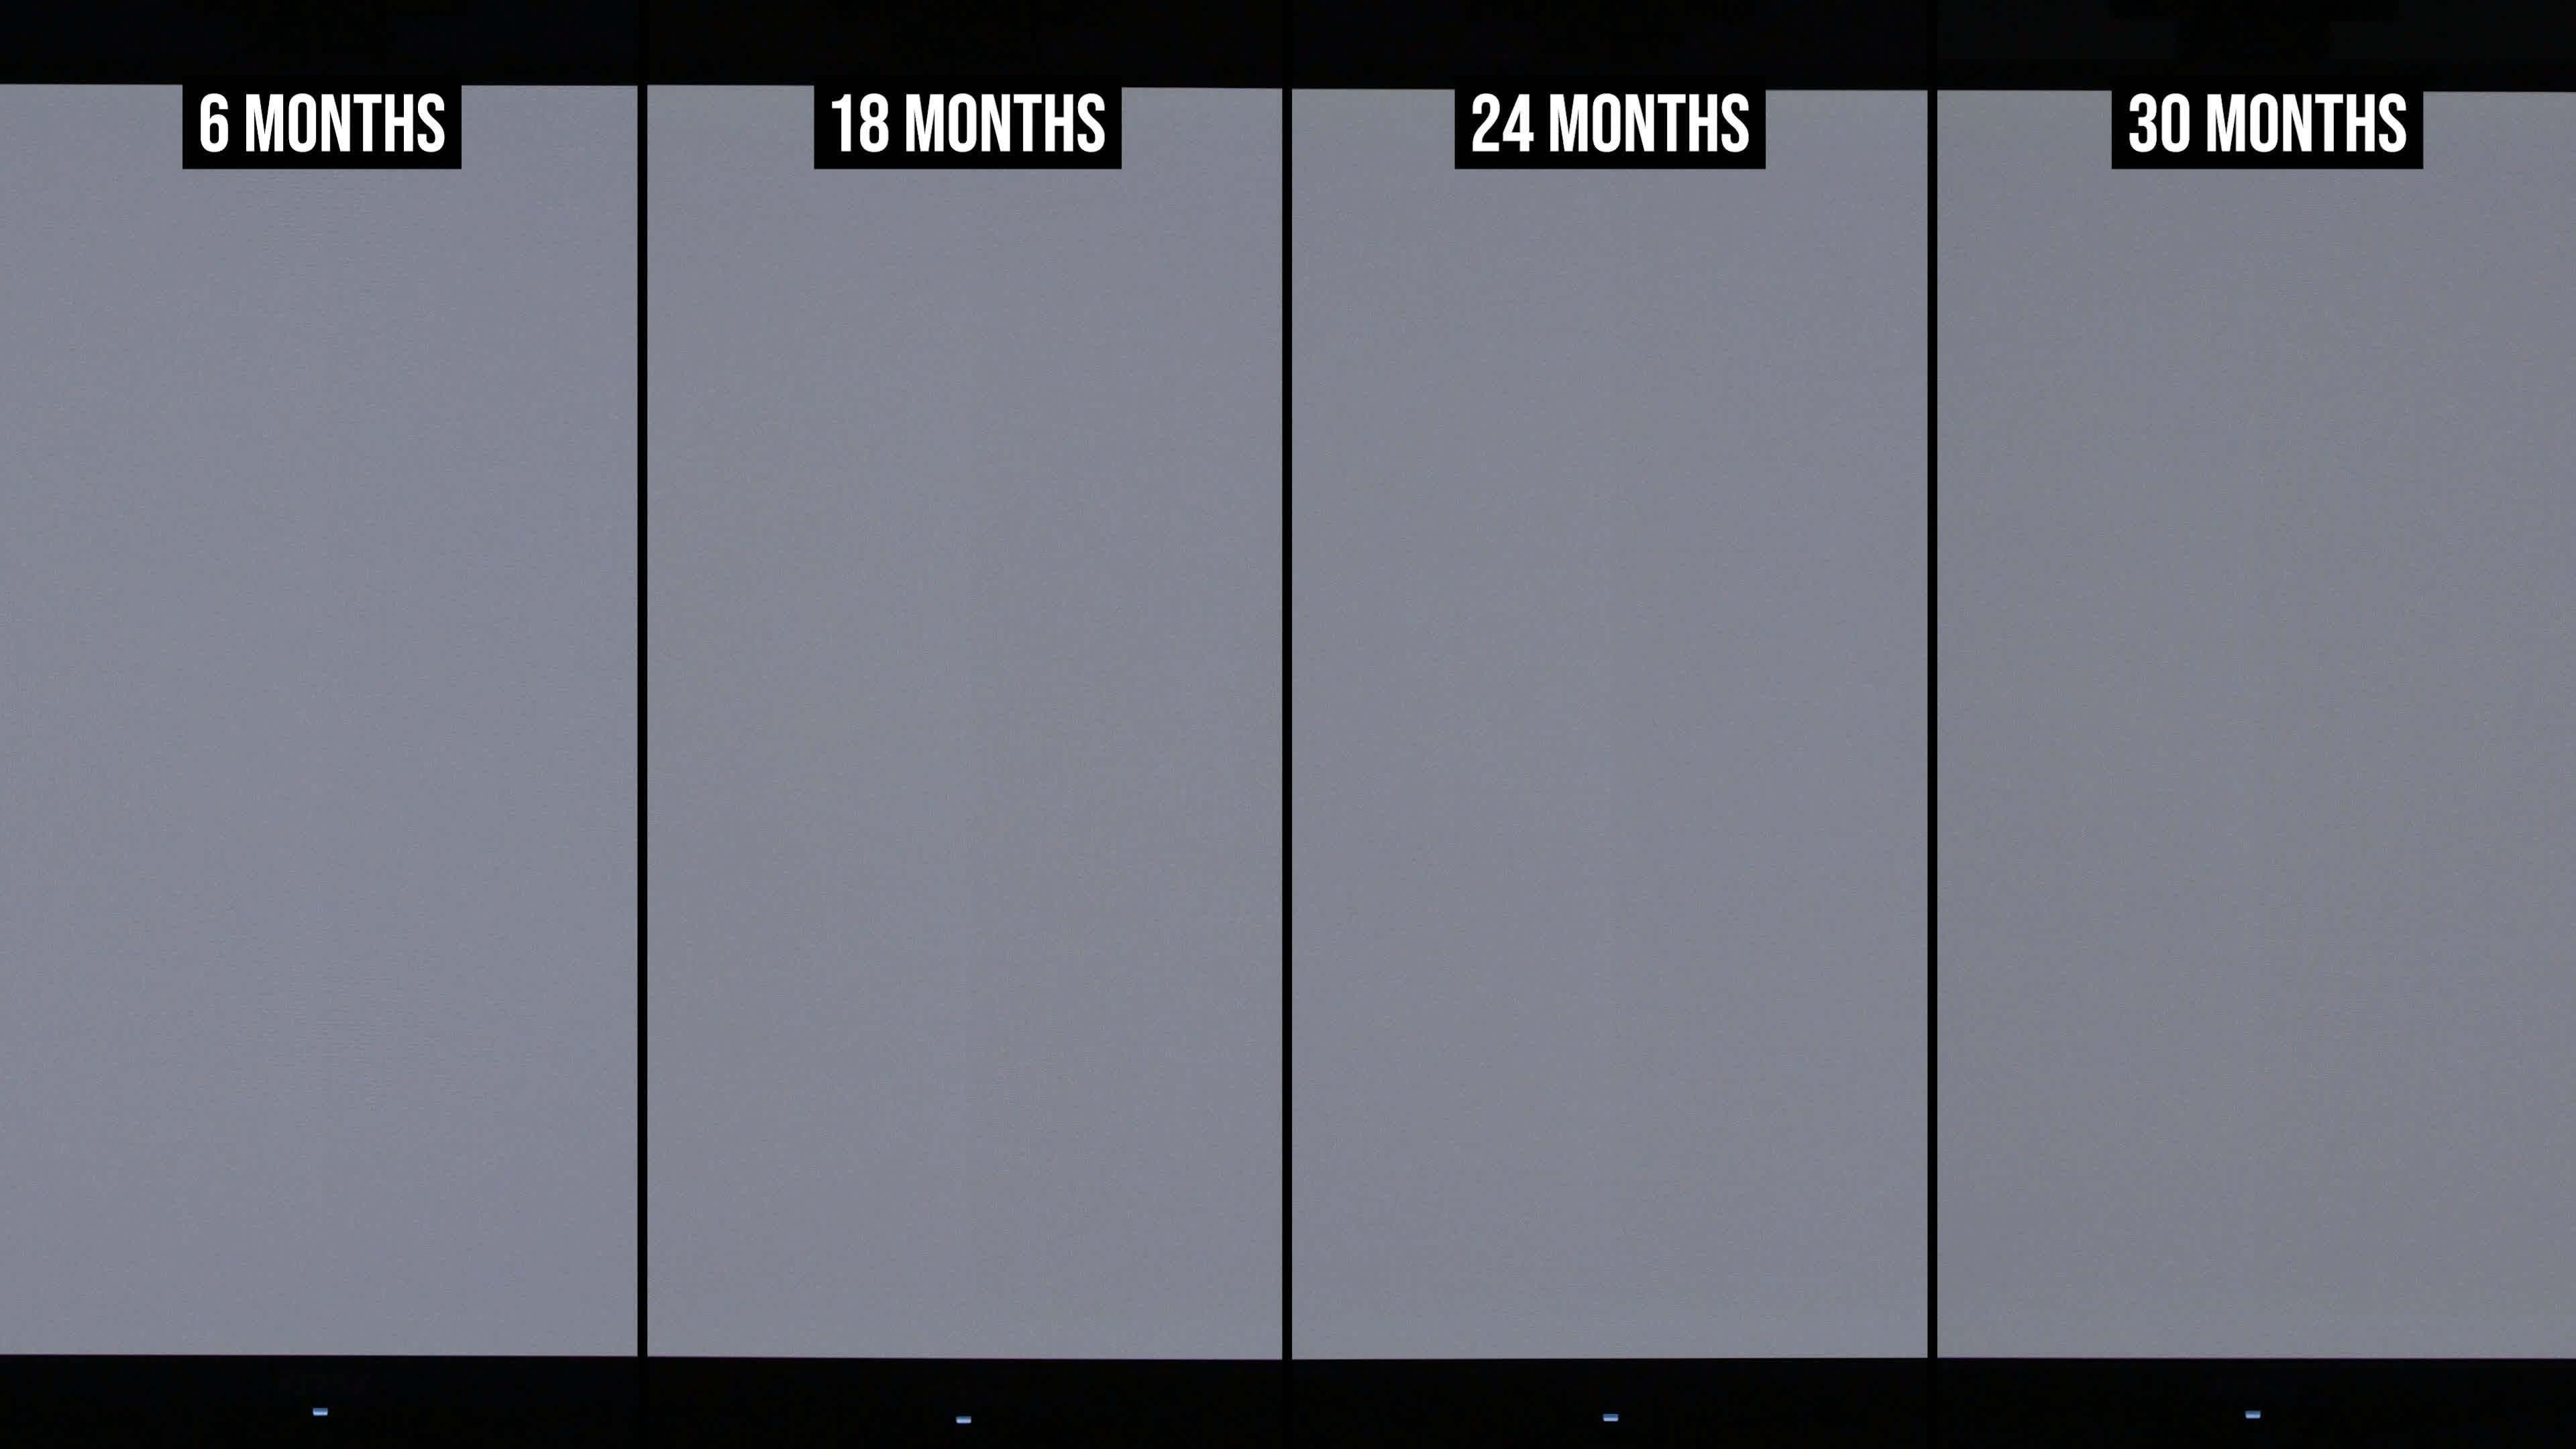
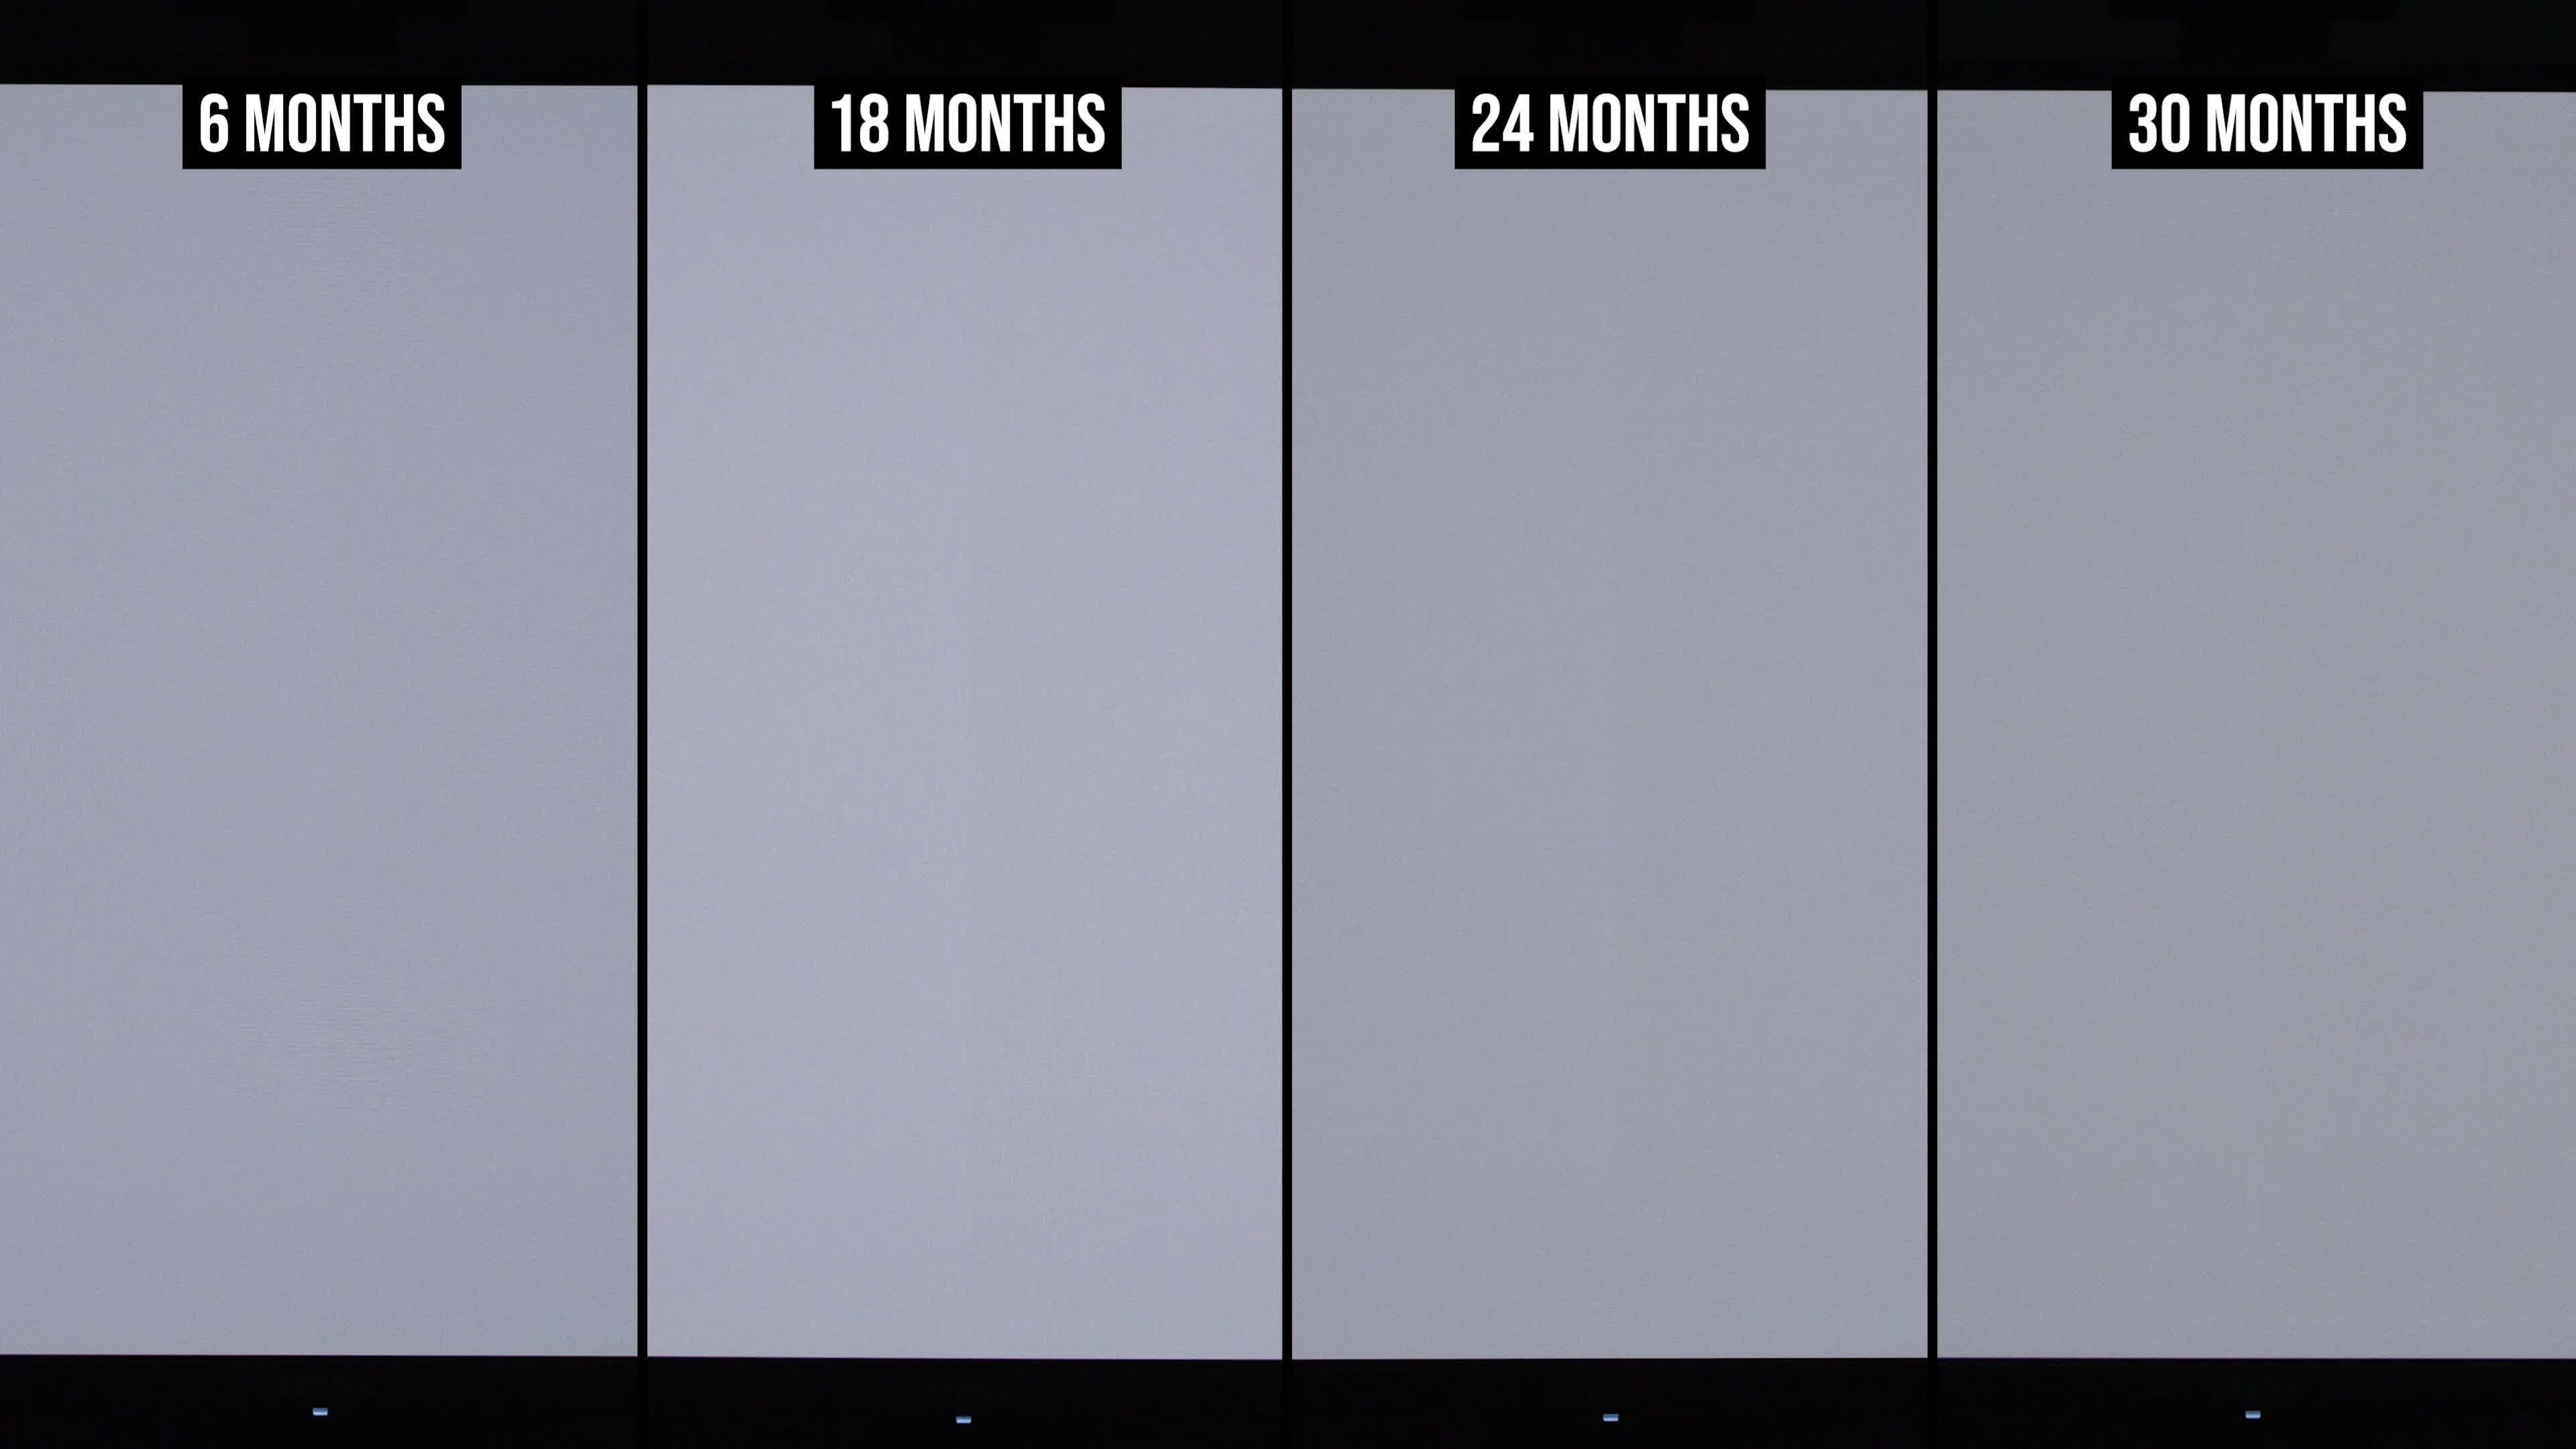
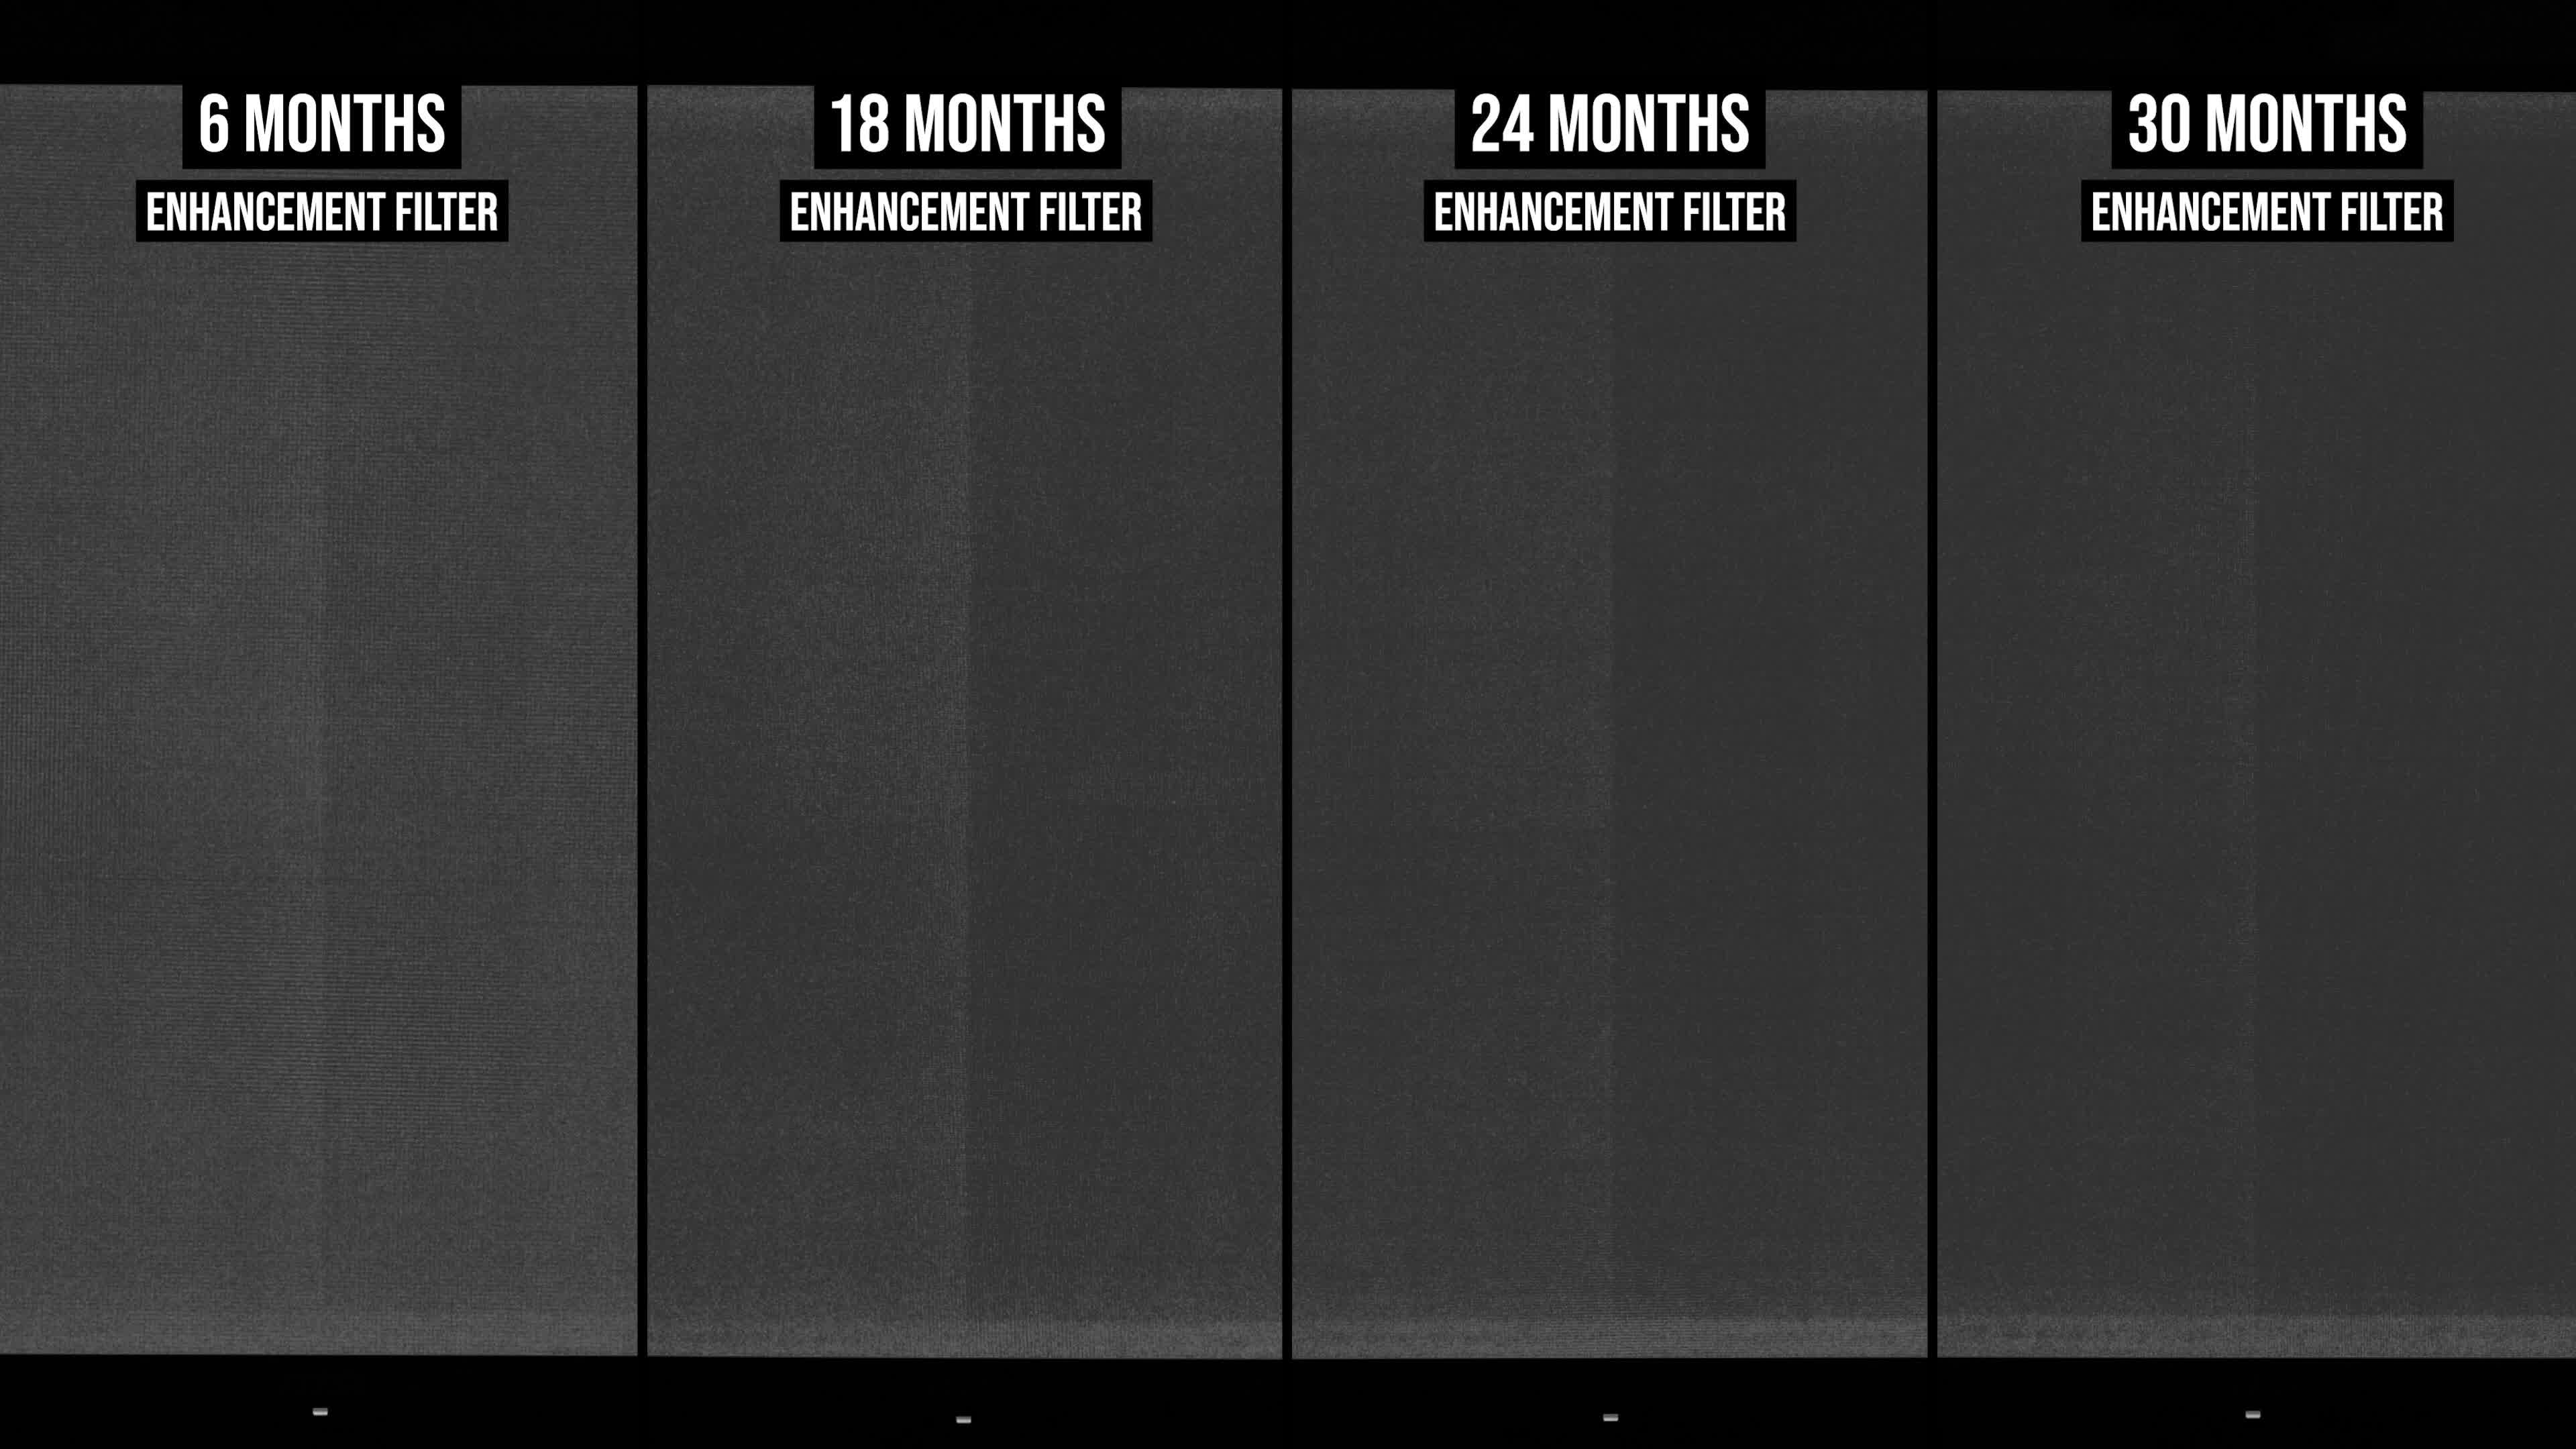
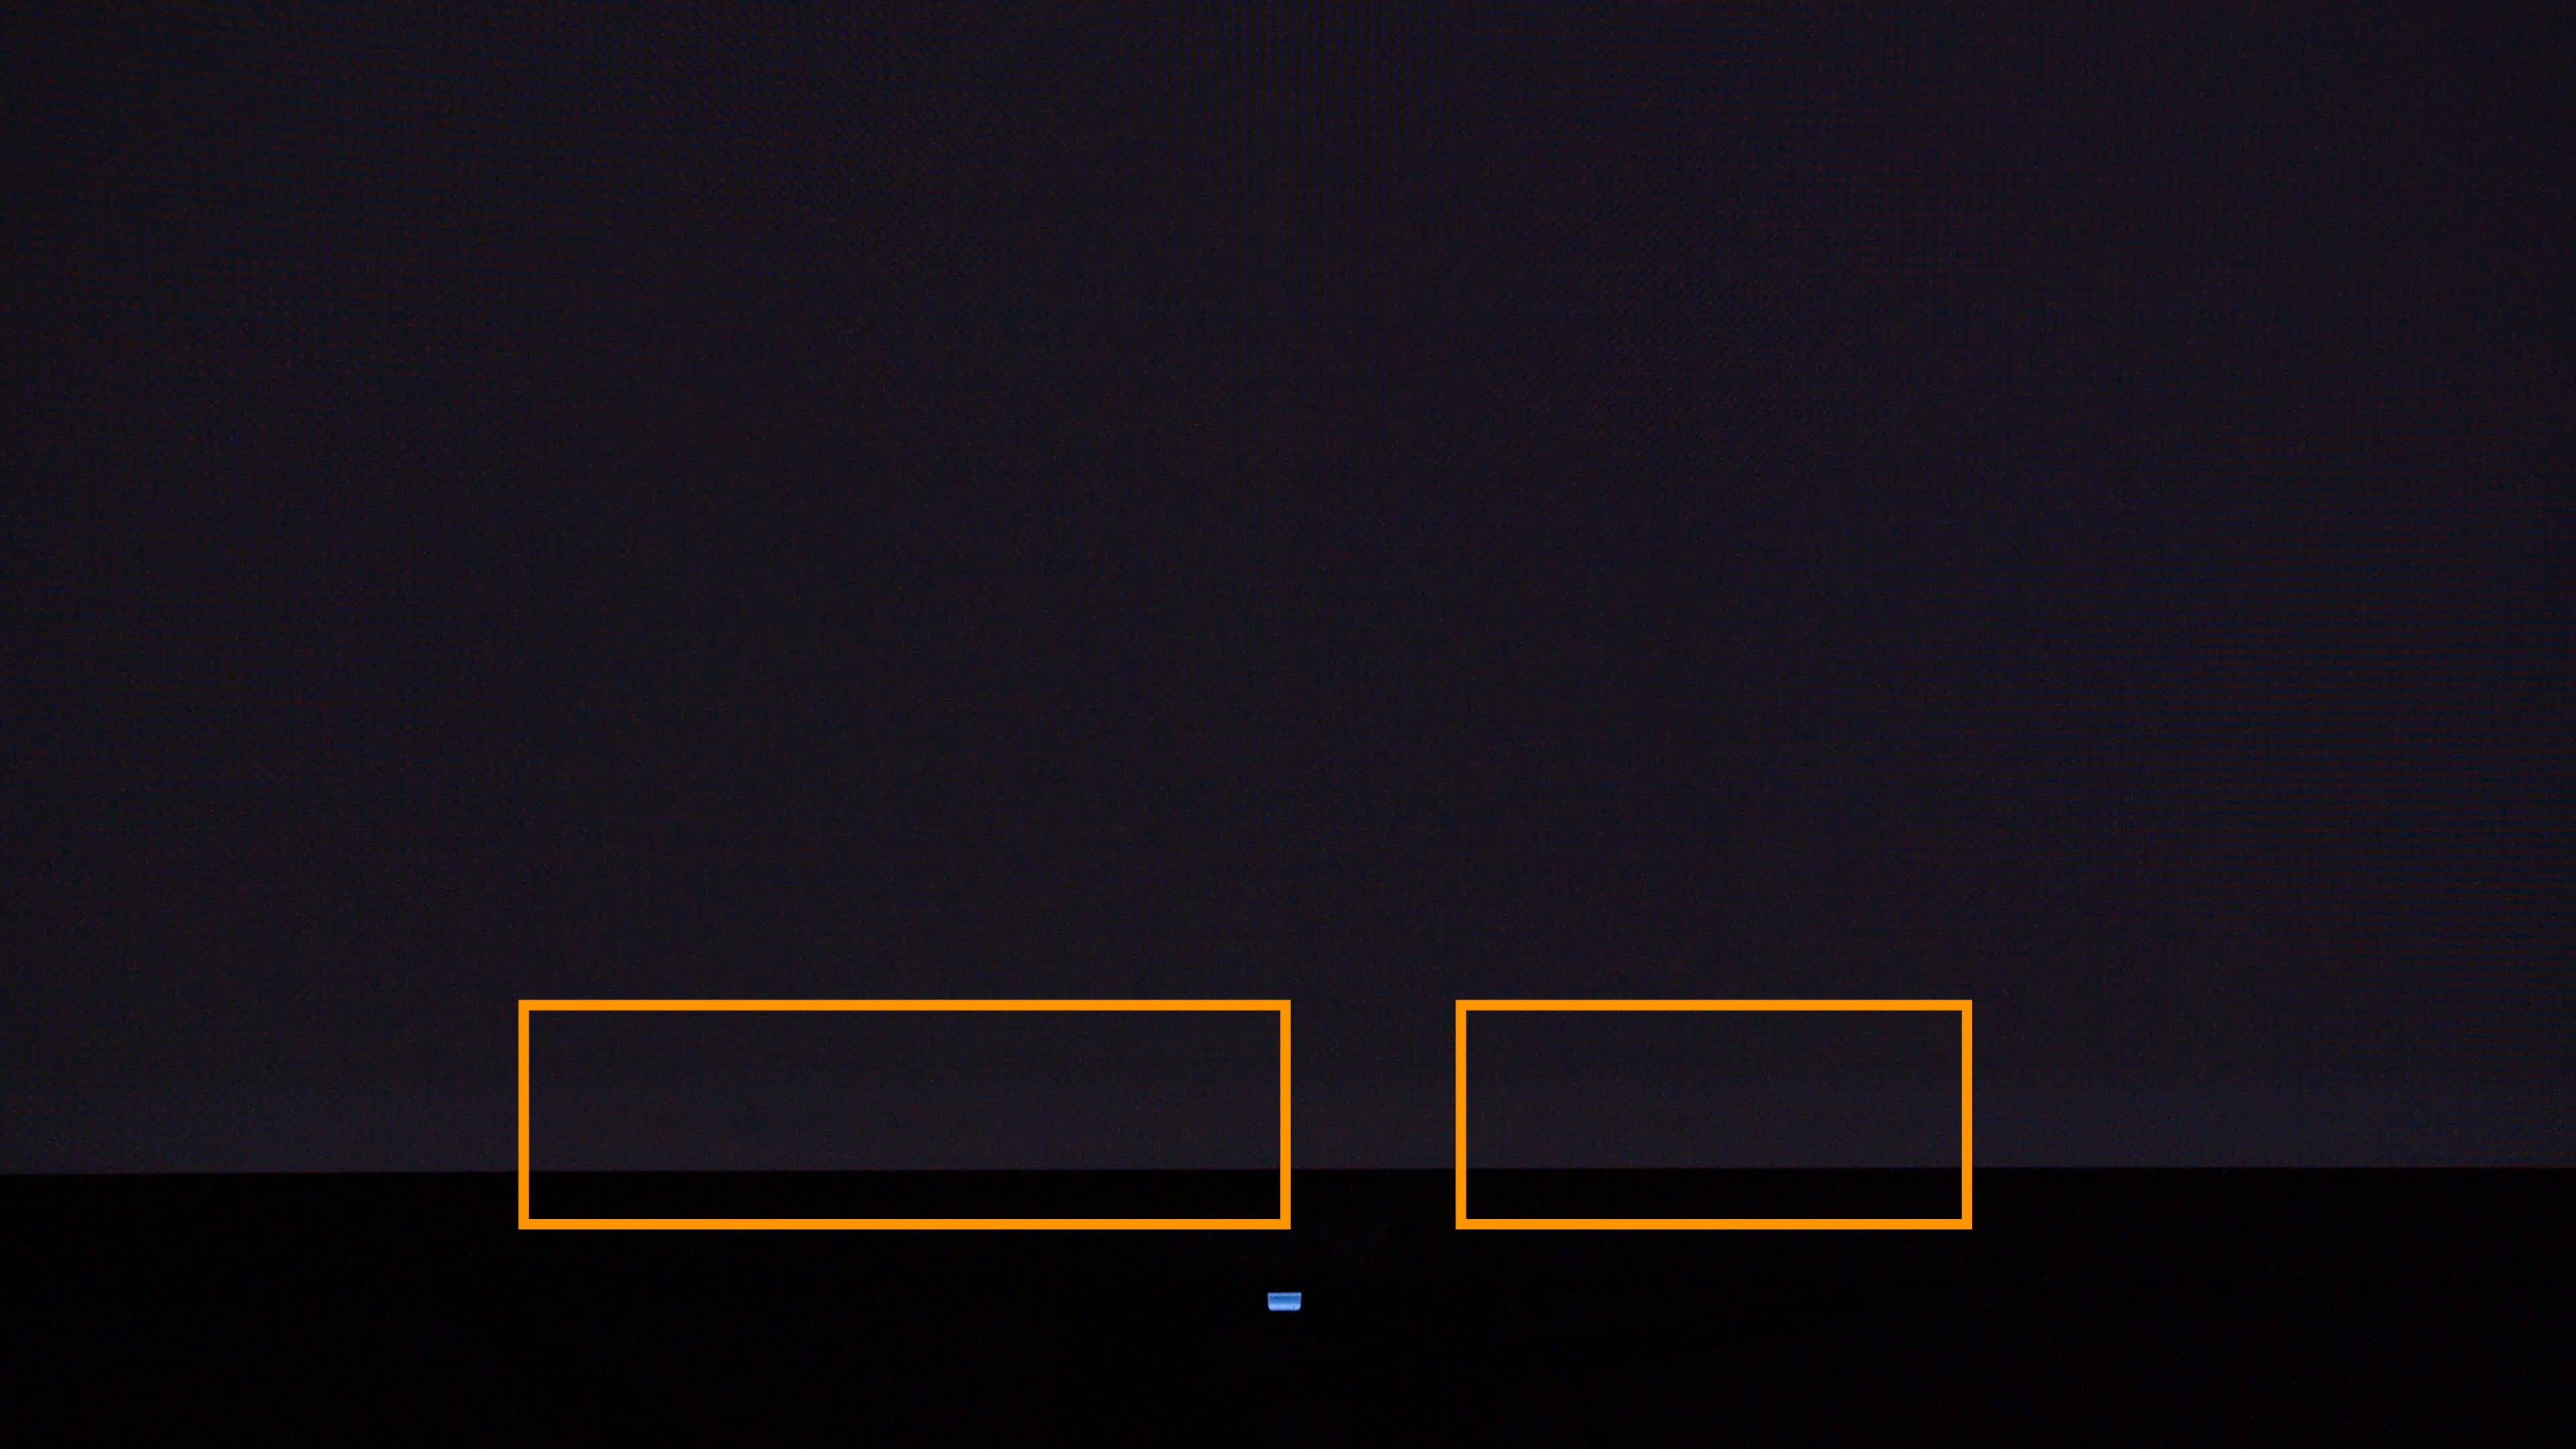
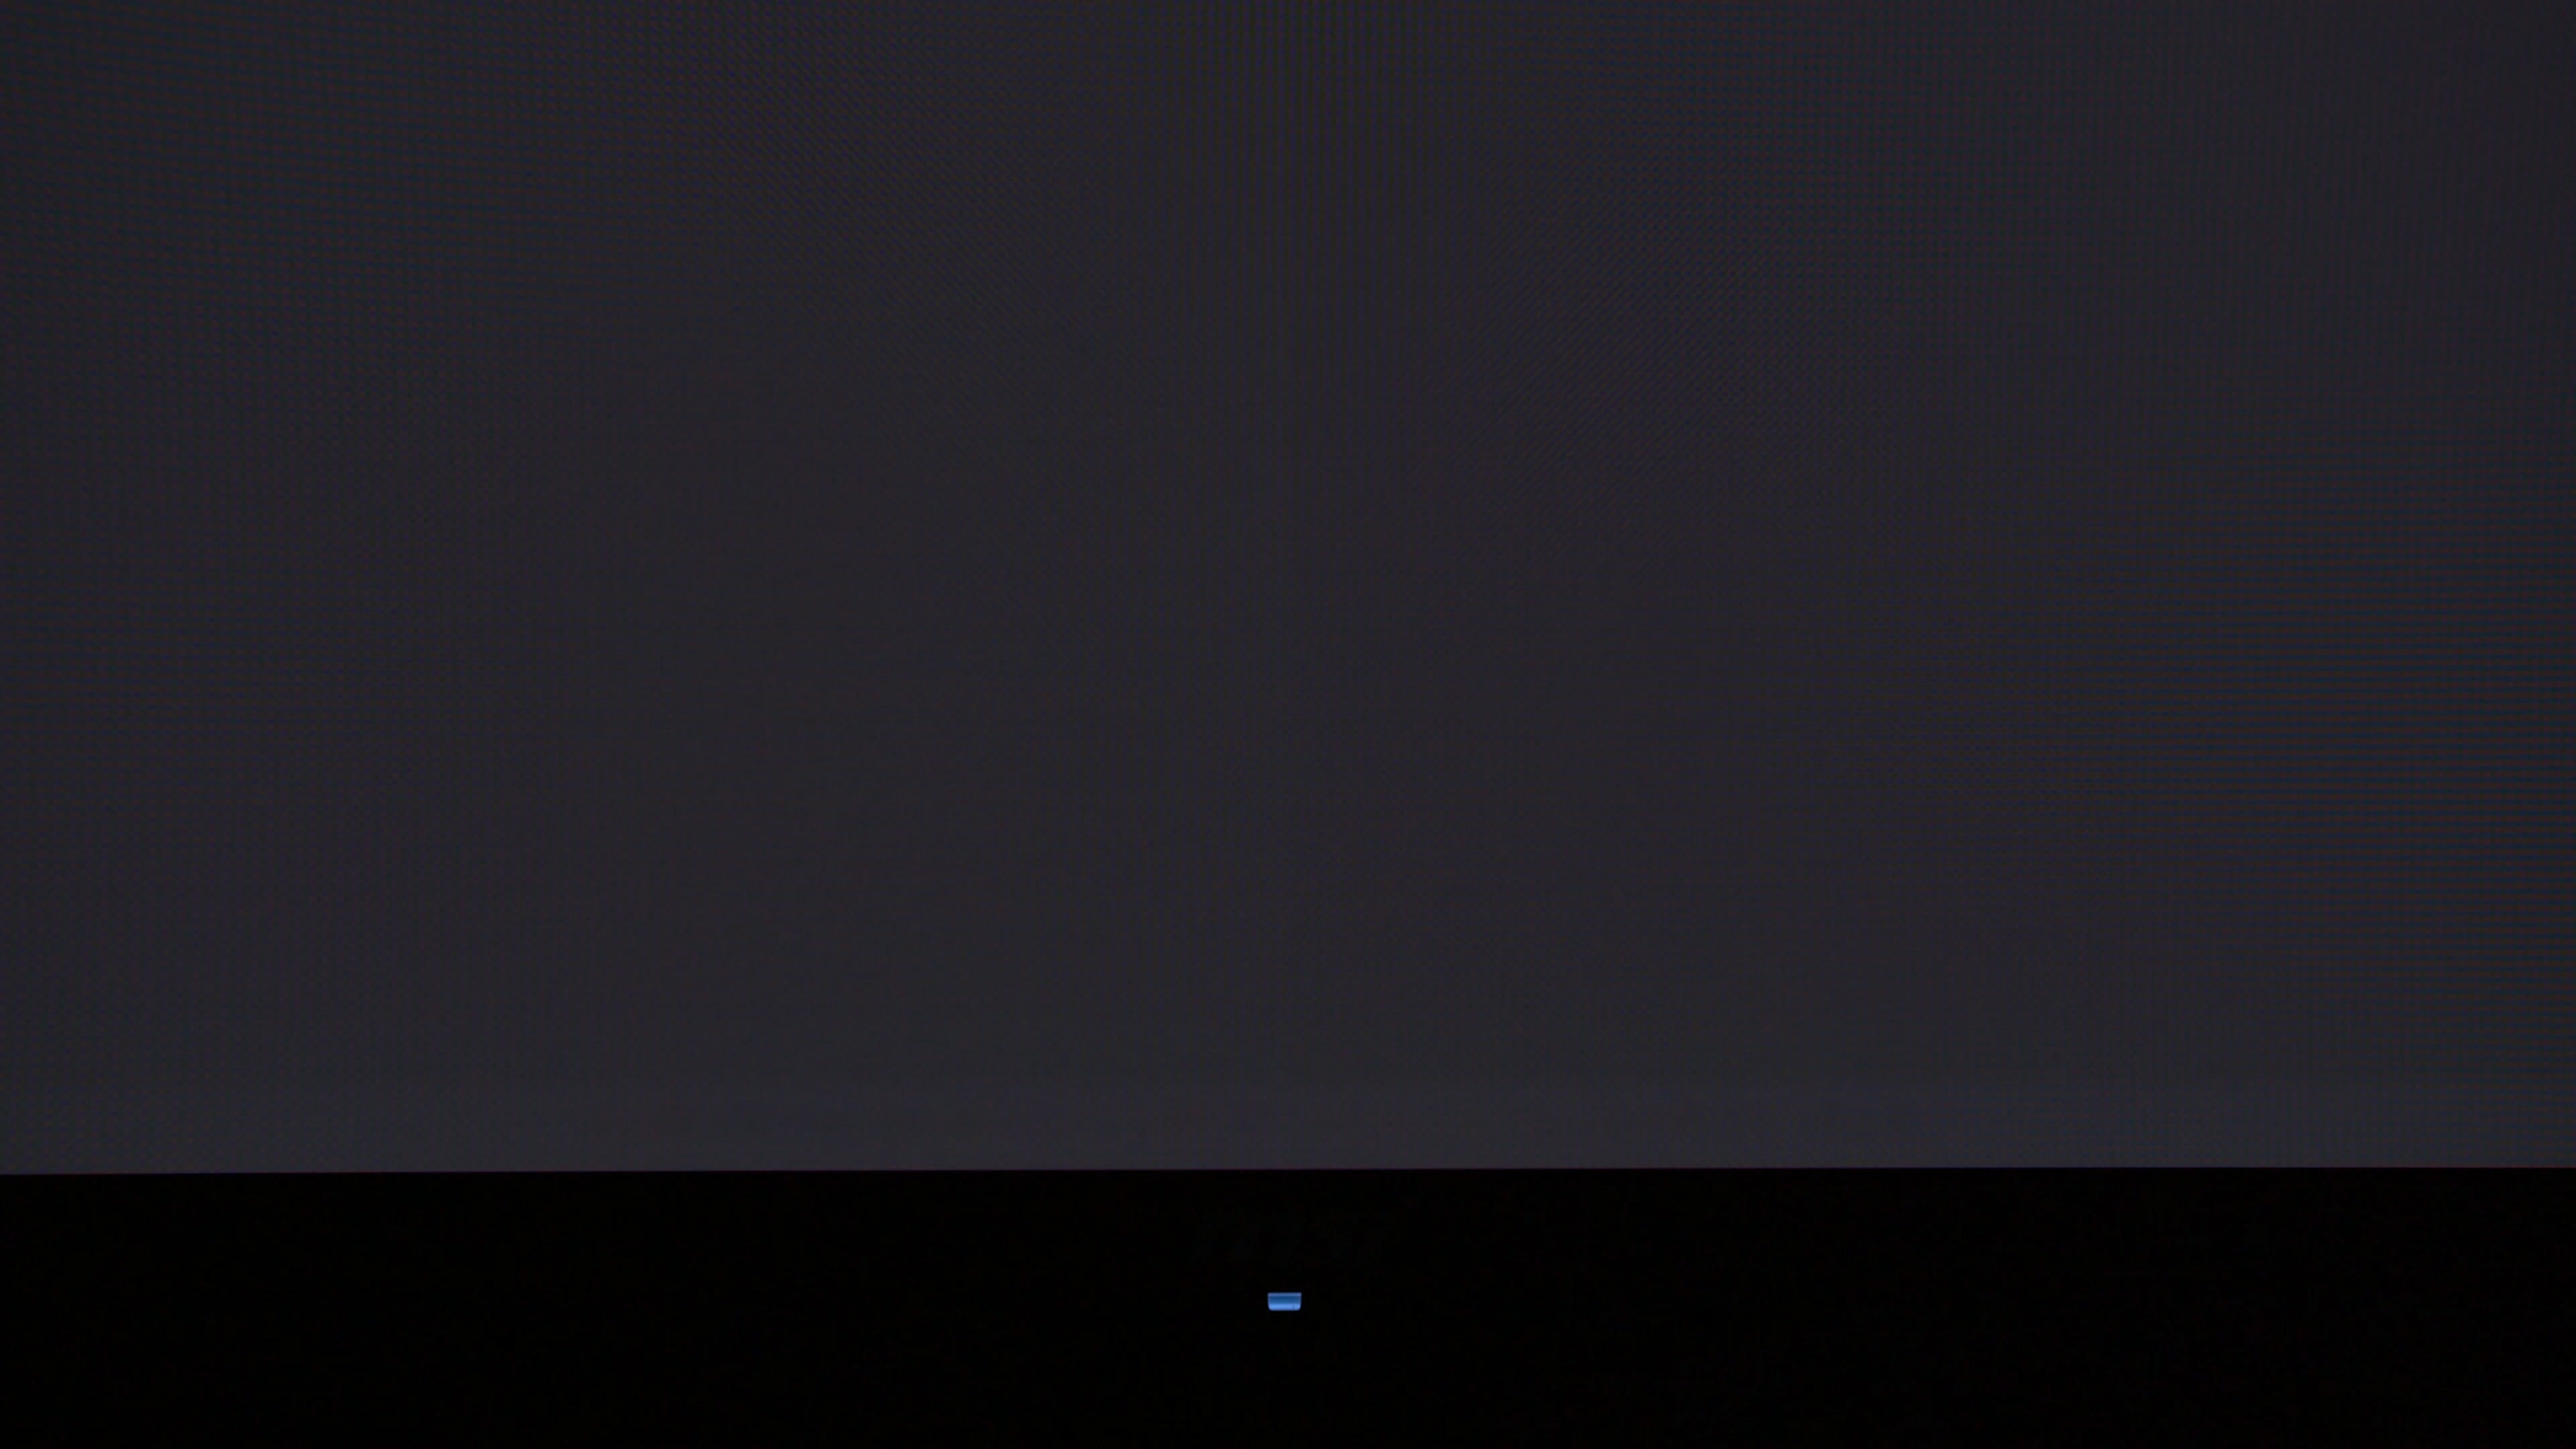
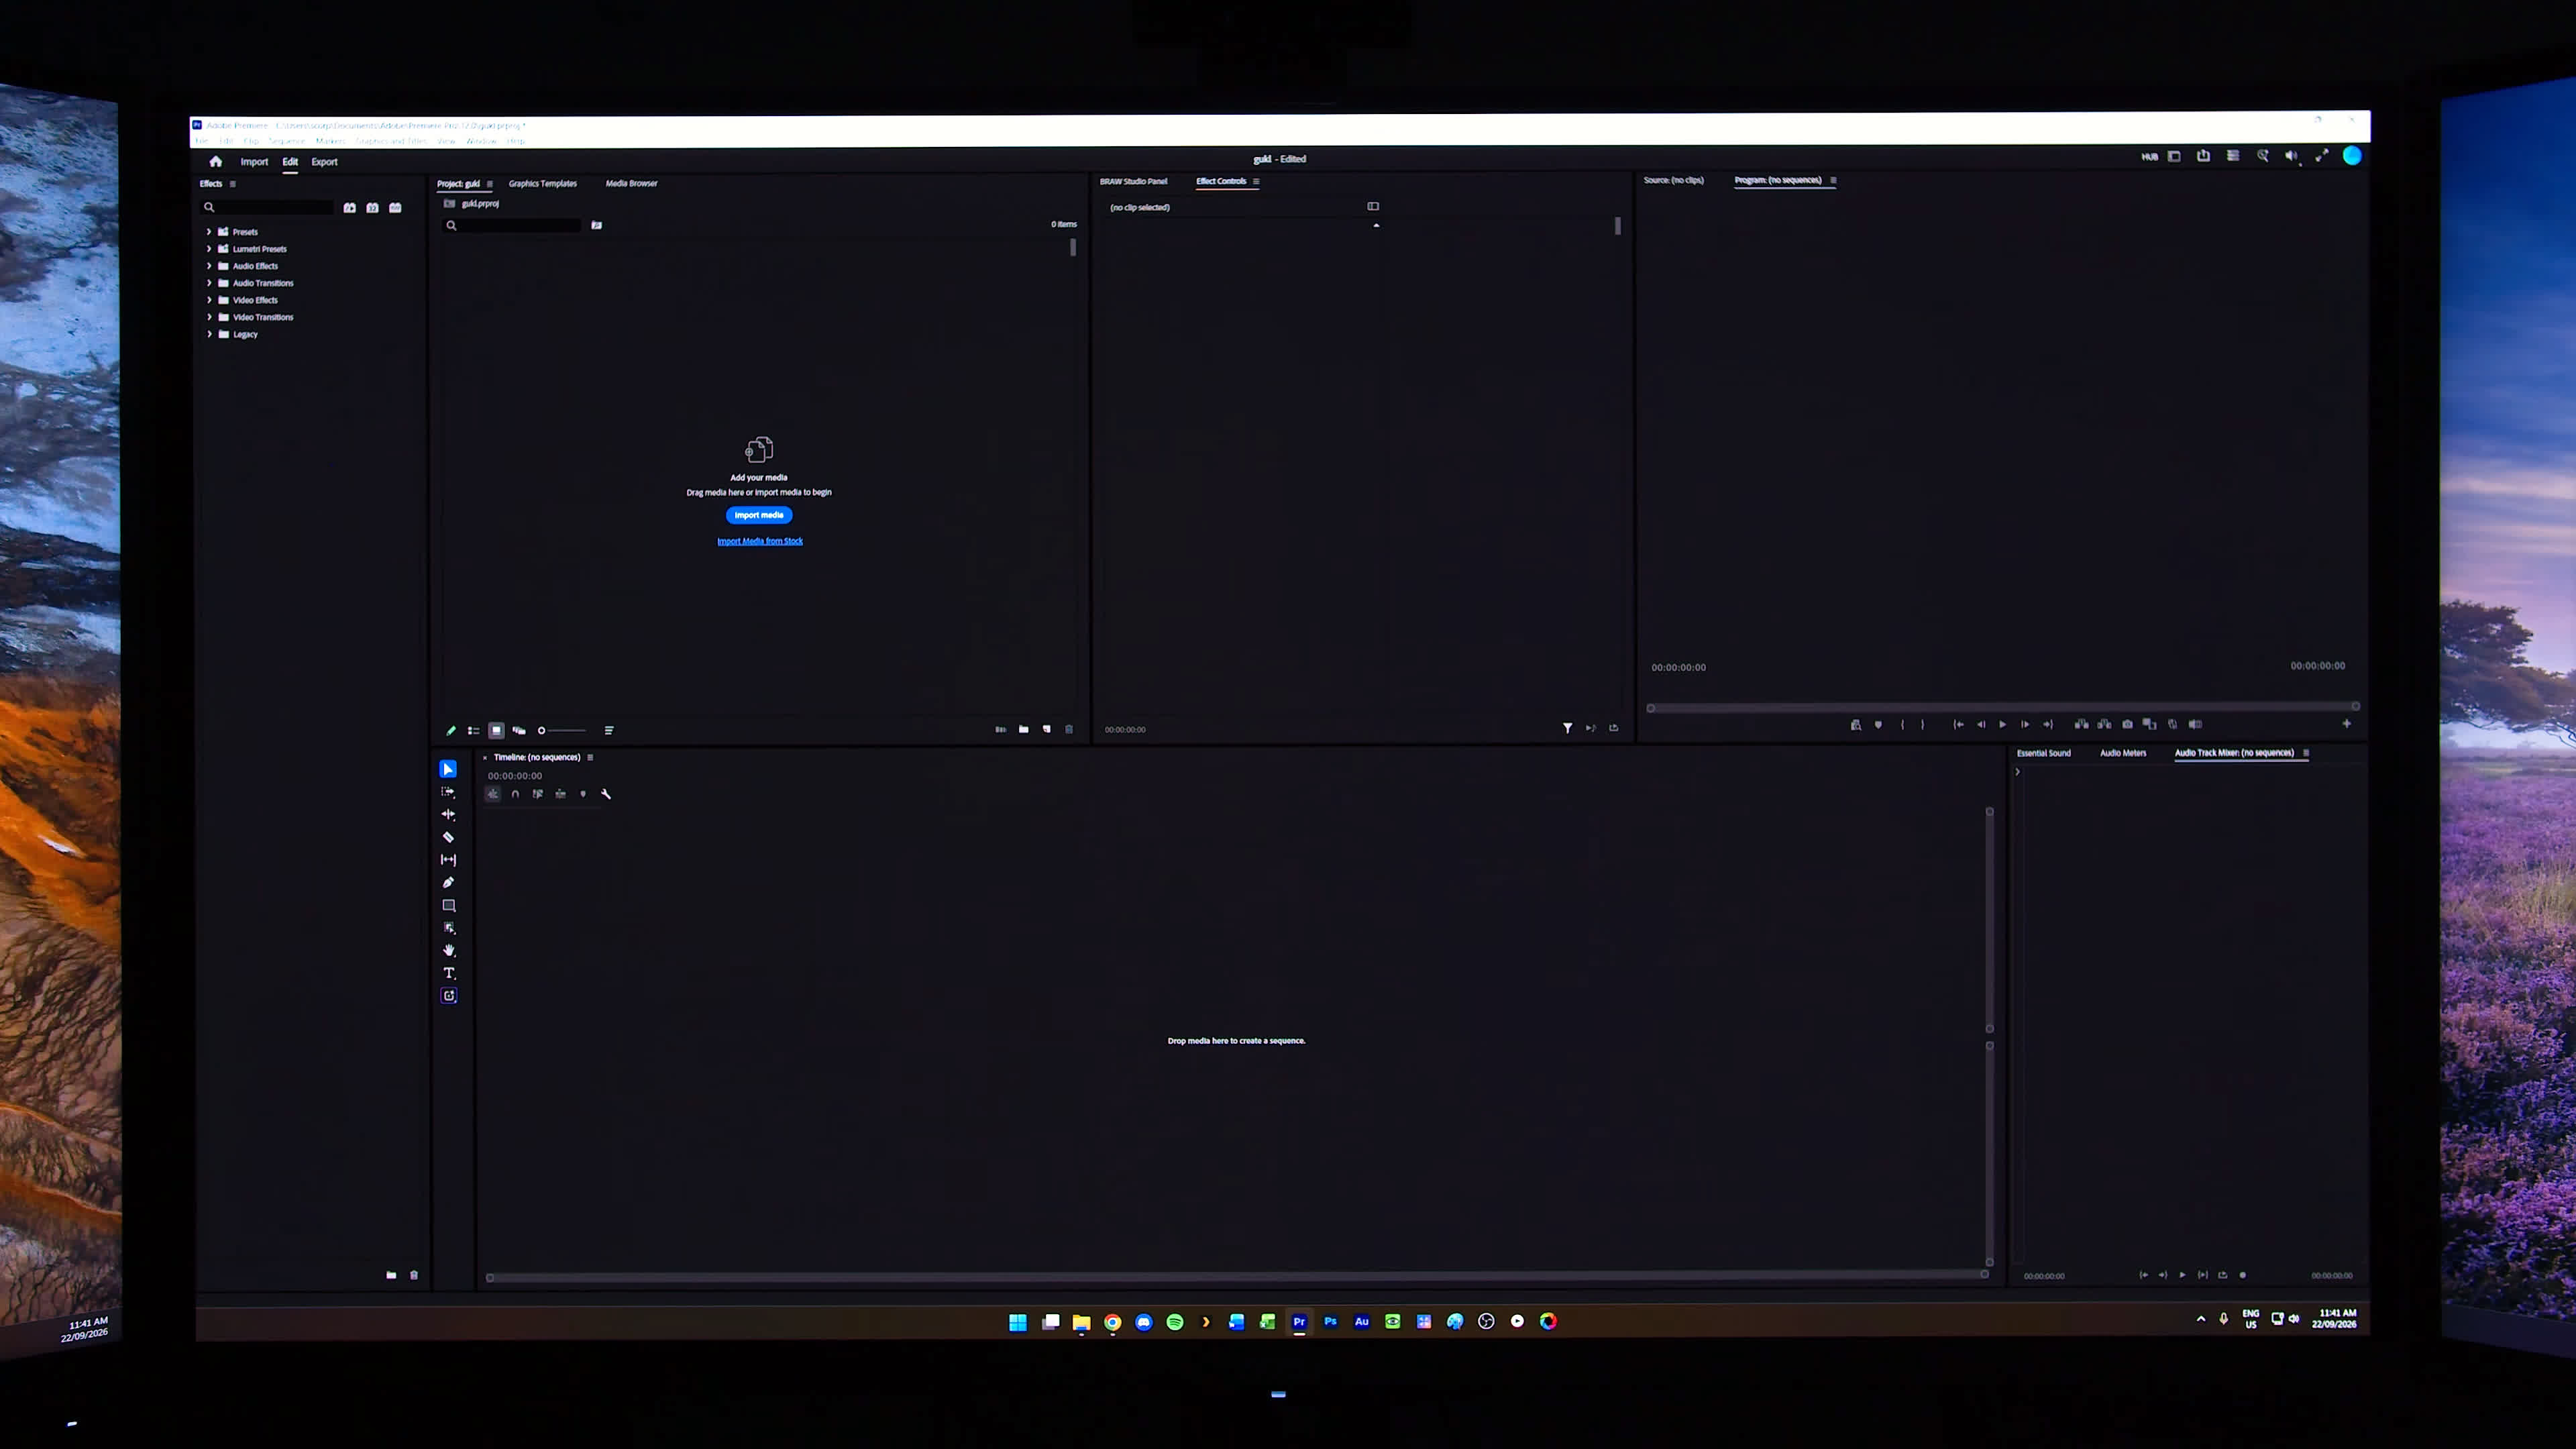
First up are the original, unenhanced examples as captured directly by the camera. These roughly reflect what the burn-in looks like in real life, though in some situations the artifacts are more visible in person than they appear here. Initially, after just a few months of testing, burn-in was quite difficult to spot in the unenhanced examples. Over time, however, it has become more noticeable, particularly when viewing dark to mid-dark uniform gray content.
The main artifact we've focused on throughout this series is the line running down the center of the screen. This is the most noticeable artifact in real-world use, and it corresponds to the border between applications when using a side-by-side layout.
Technically, this is inverse burn-in. It's actually the brighter application windows on either side of the line that are degrading the display. The line itself remains darker during normal use, so that portion of the panel hasn't degraded as much. As a result, it appears lighter than the surrounding areas in these burn-in examples.
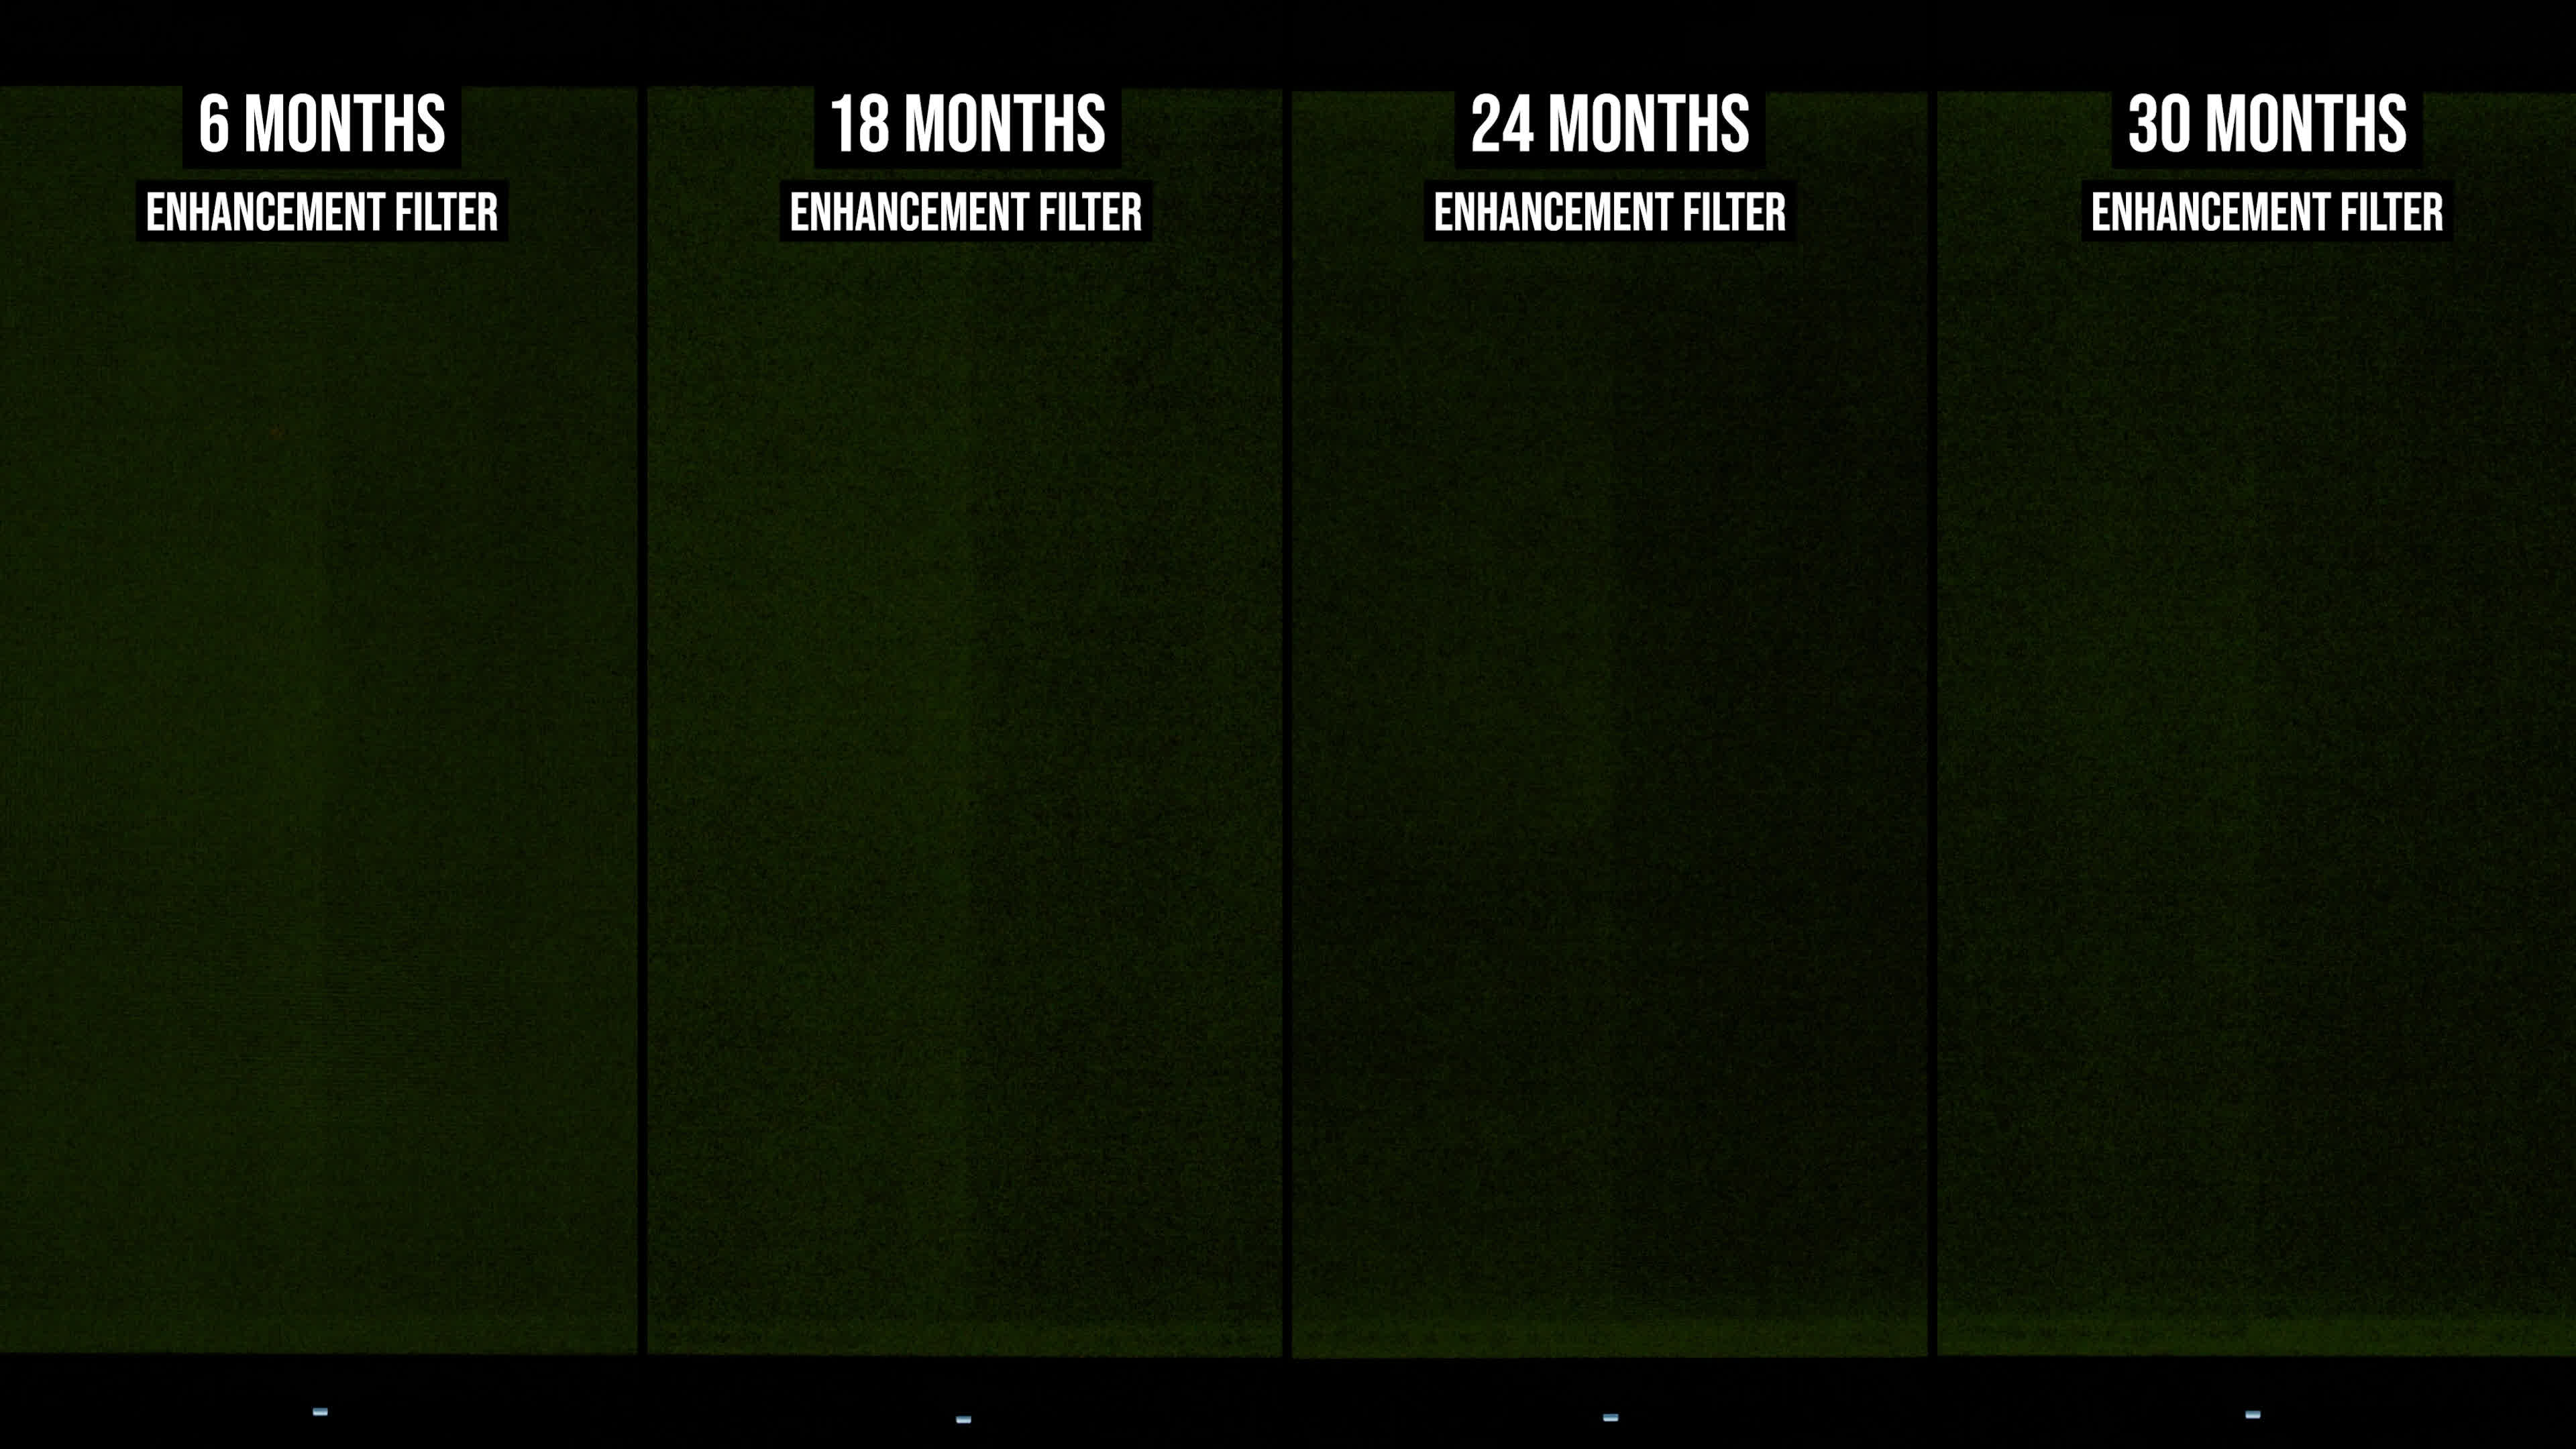
After 30 months, the line is clearly visible. On uniform dark gray content in real-world use, such as the background of some productivity applications, we can clearly see it, and it's mildly annoying.
However, the burn-in does not appear to be accelerating over time. The line has steadily become more visible with each six-month interval, so the results at 30 months are slightly worse than at 24 months, which were slightly worse than at 18 months. All of these images have had their brightness normalized, so what we're seeing is the burned-in areas becoming progressively darker over time relative to the inverse-burned-in line.
The other major artifact is the taskbar, which has also experienced inverse burn-in. We use a dark taskbar with light-mode applications, so the brighter application windows have degraded that area of the screen faster than the taskbar itself.
After 30 months, this taskbar burn-in is more noticeable than ever, though it's still somewhat faint. It's certainly not as though this part of the screen has been completely destroyed, despite the taskbar being permanently visible for pretty much all 8,000 hours of use.
Enhanced Burn In Results
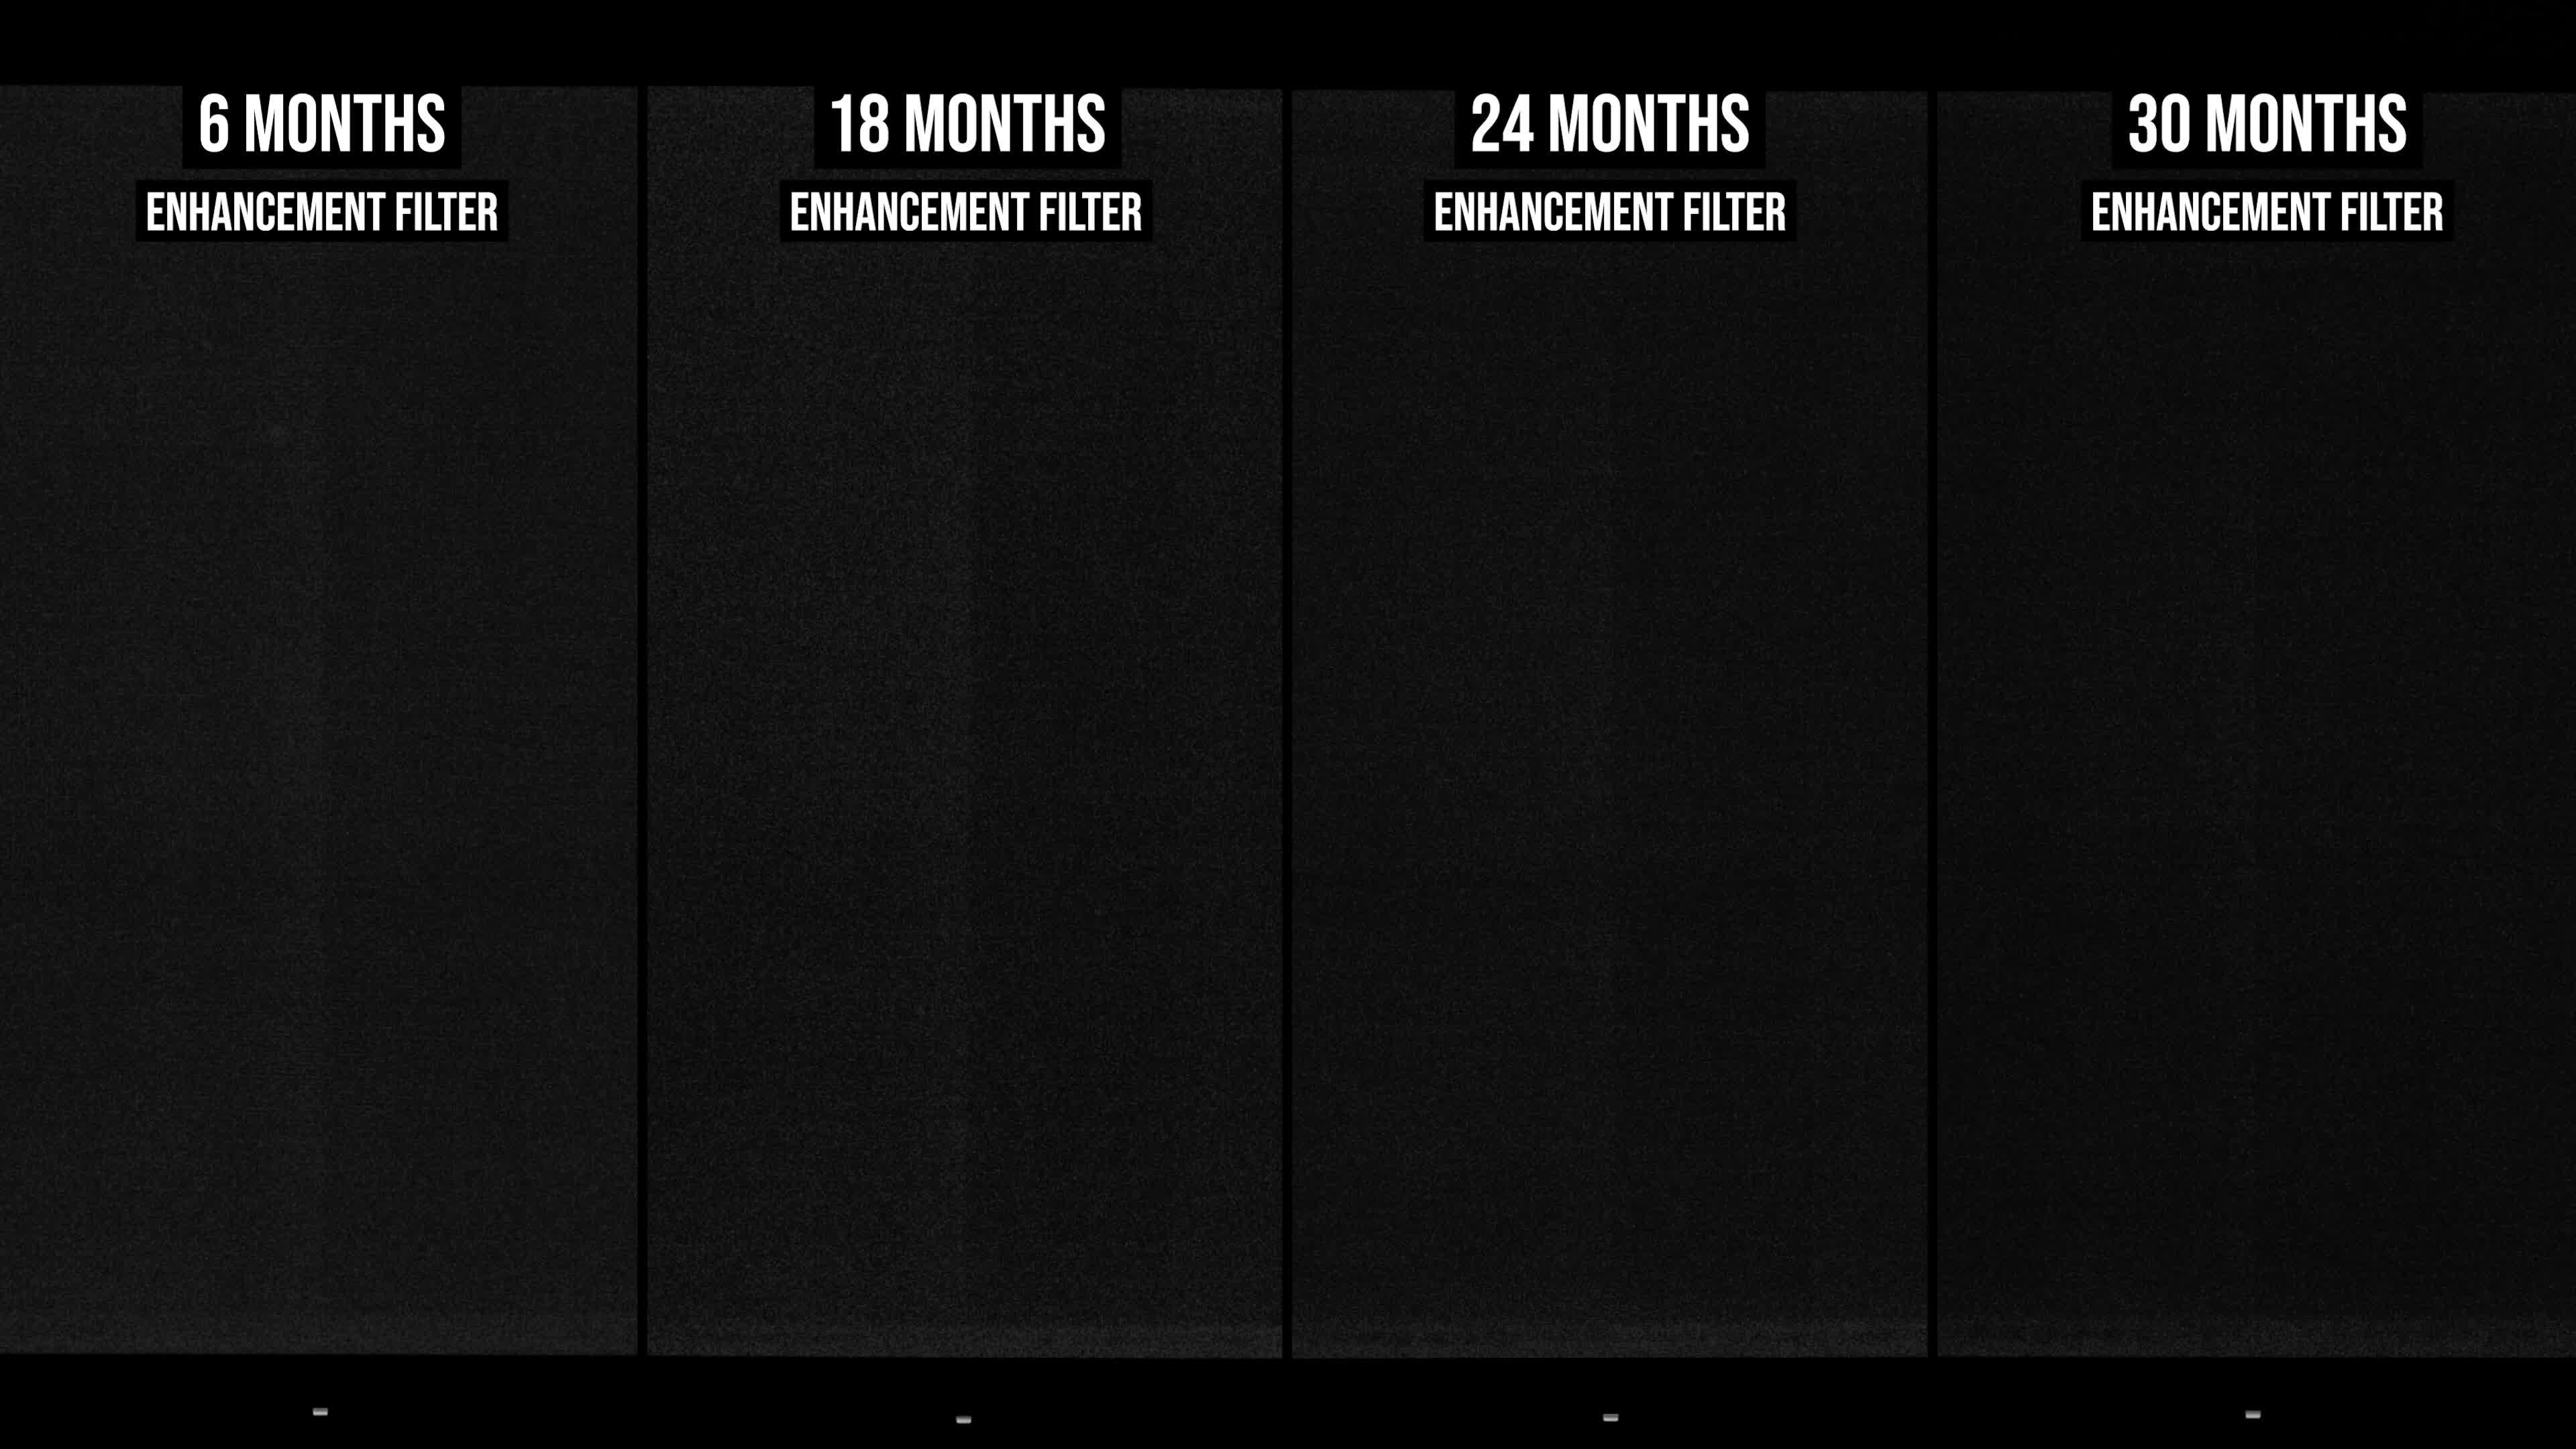
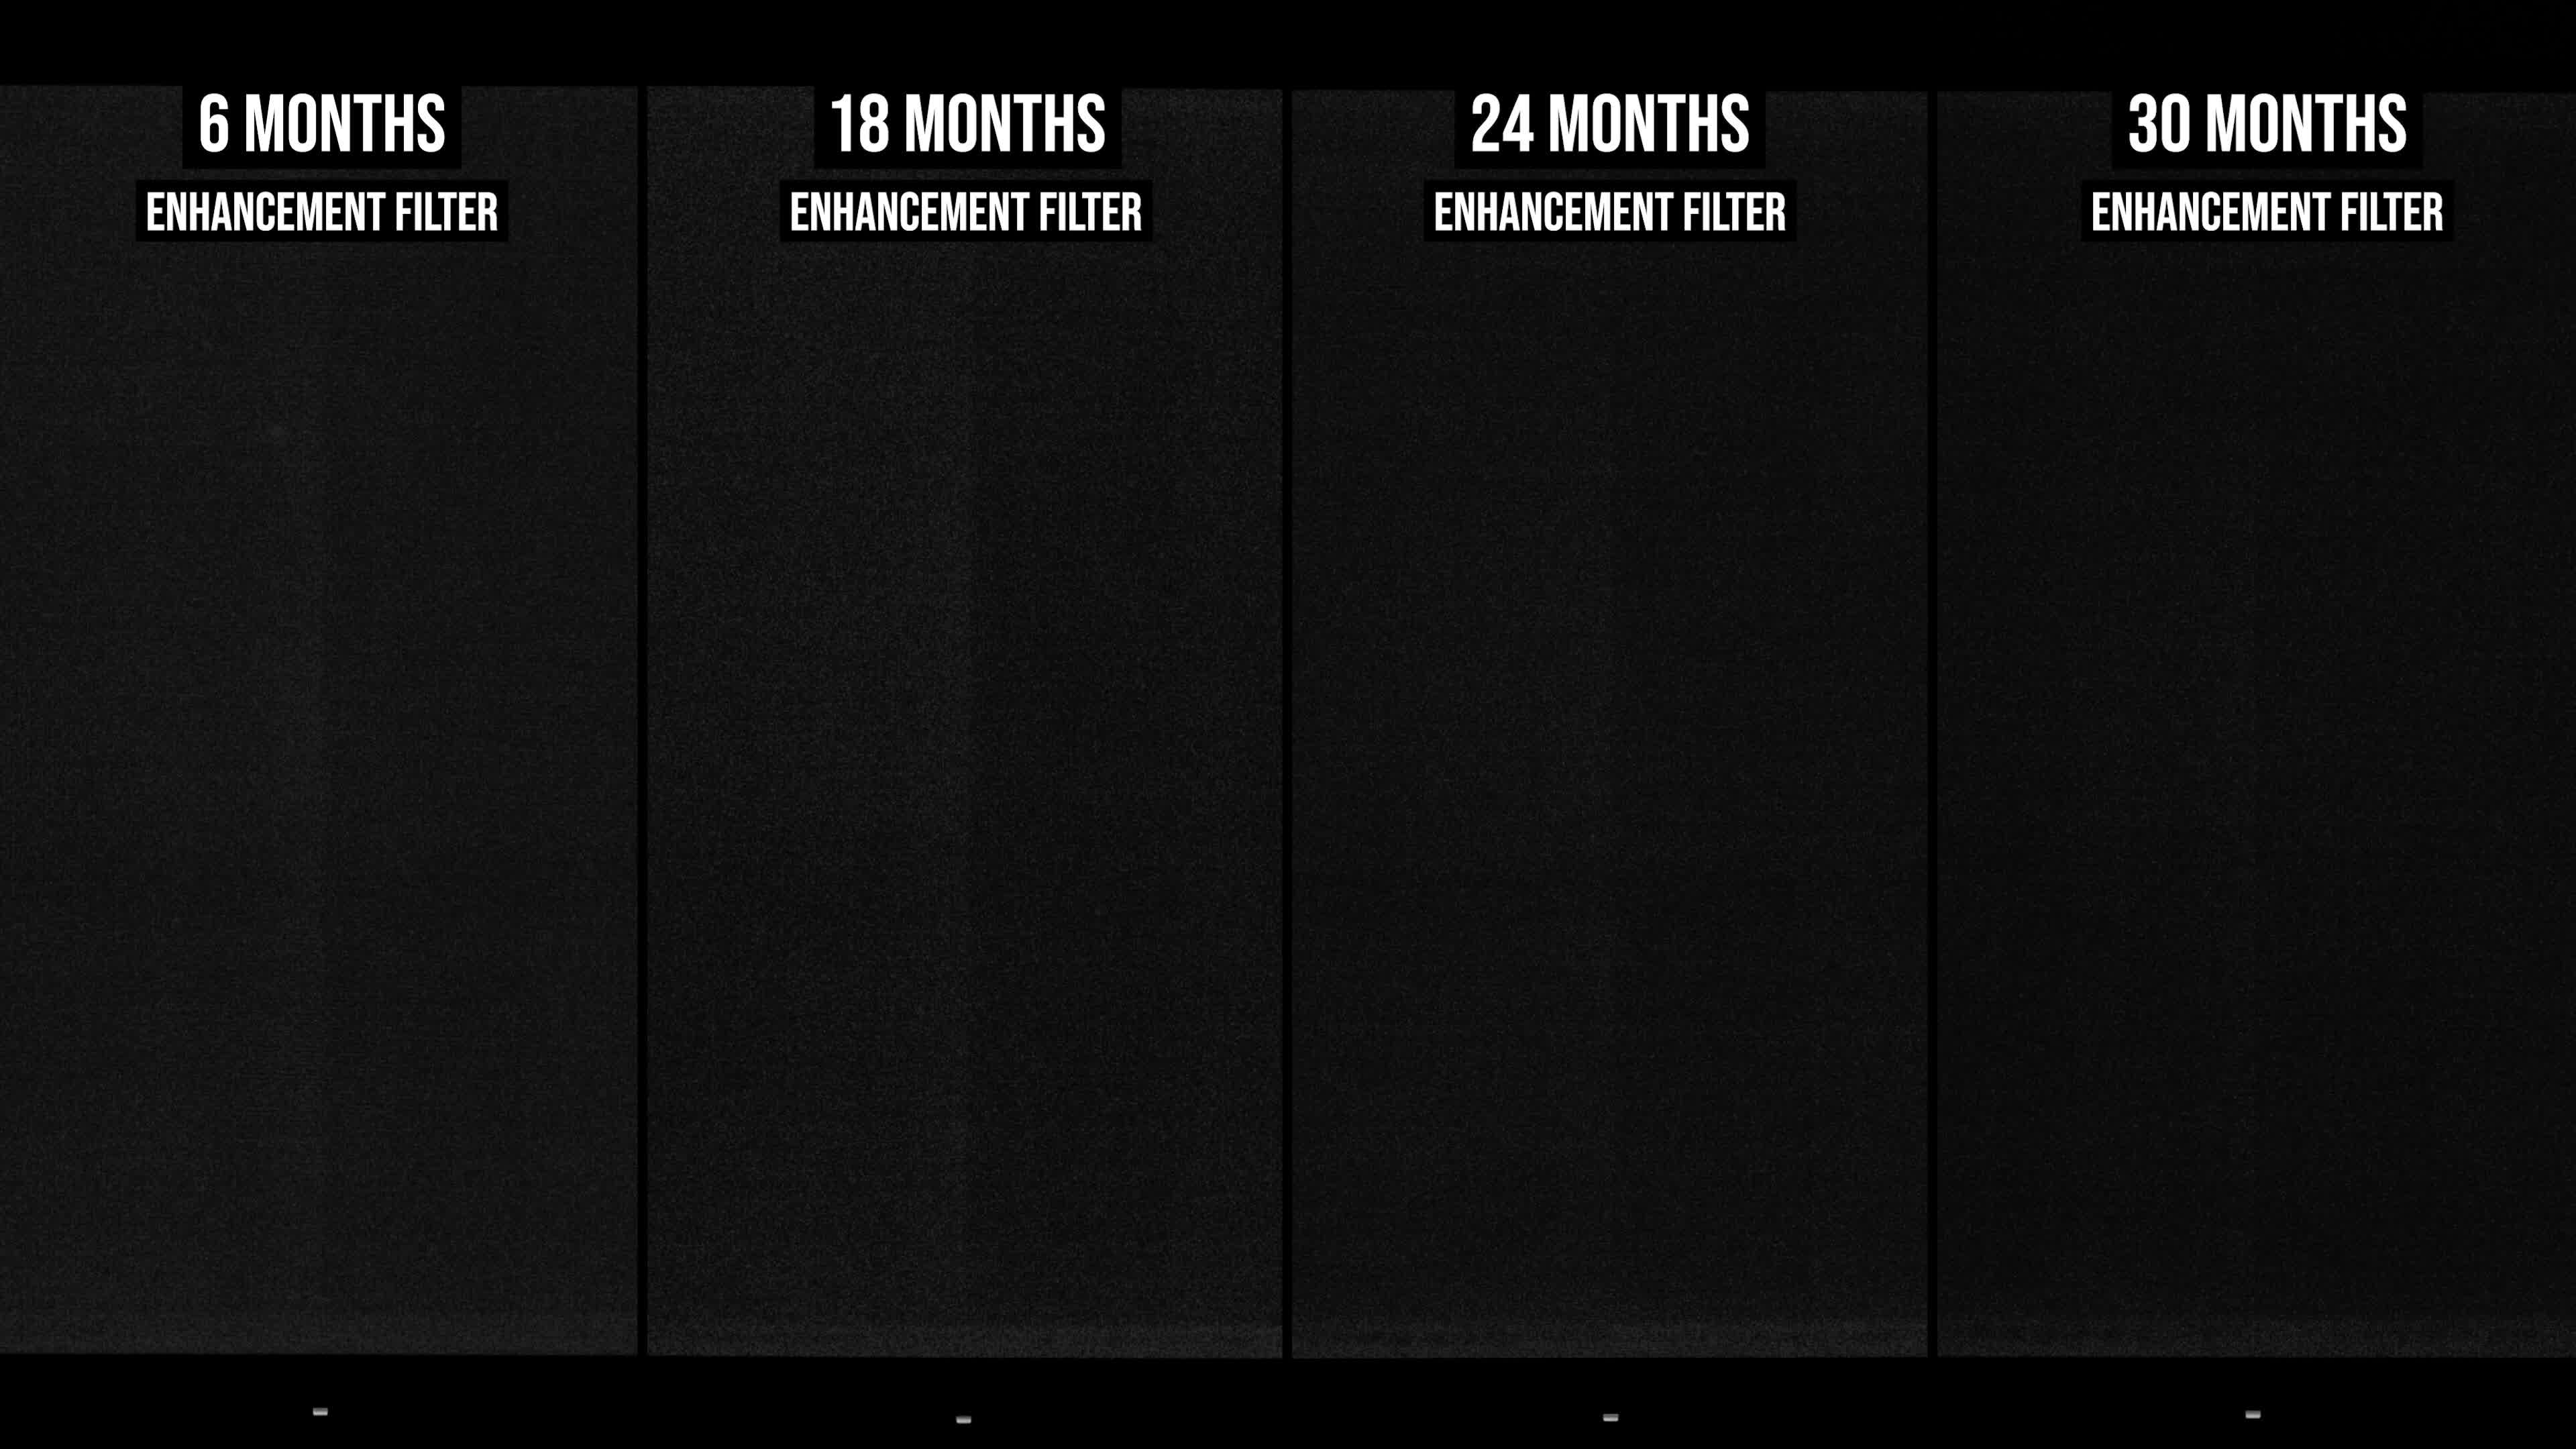
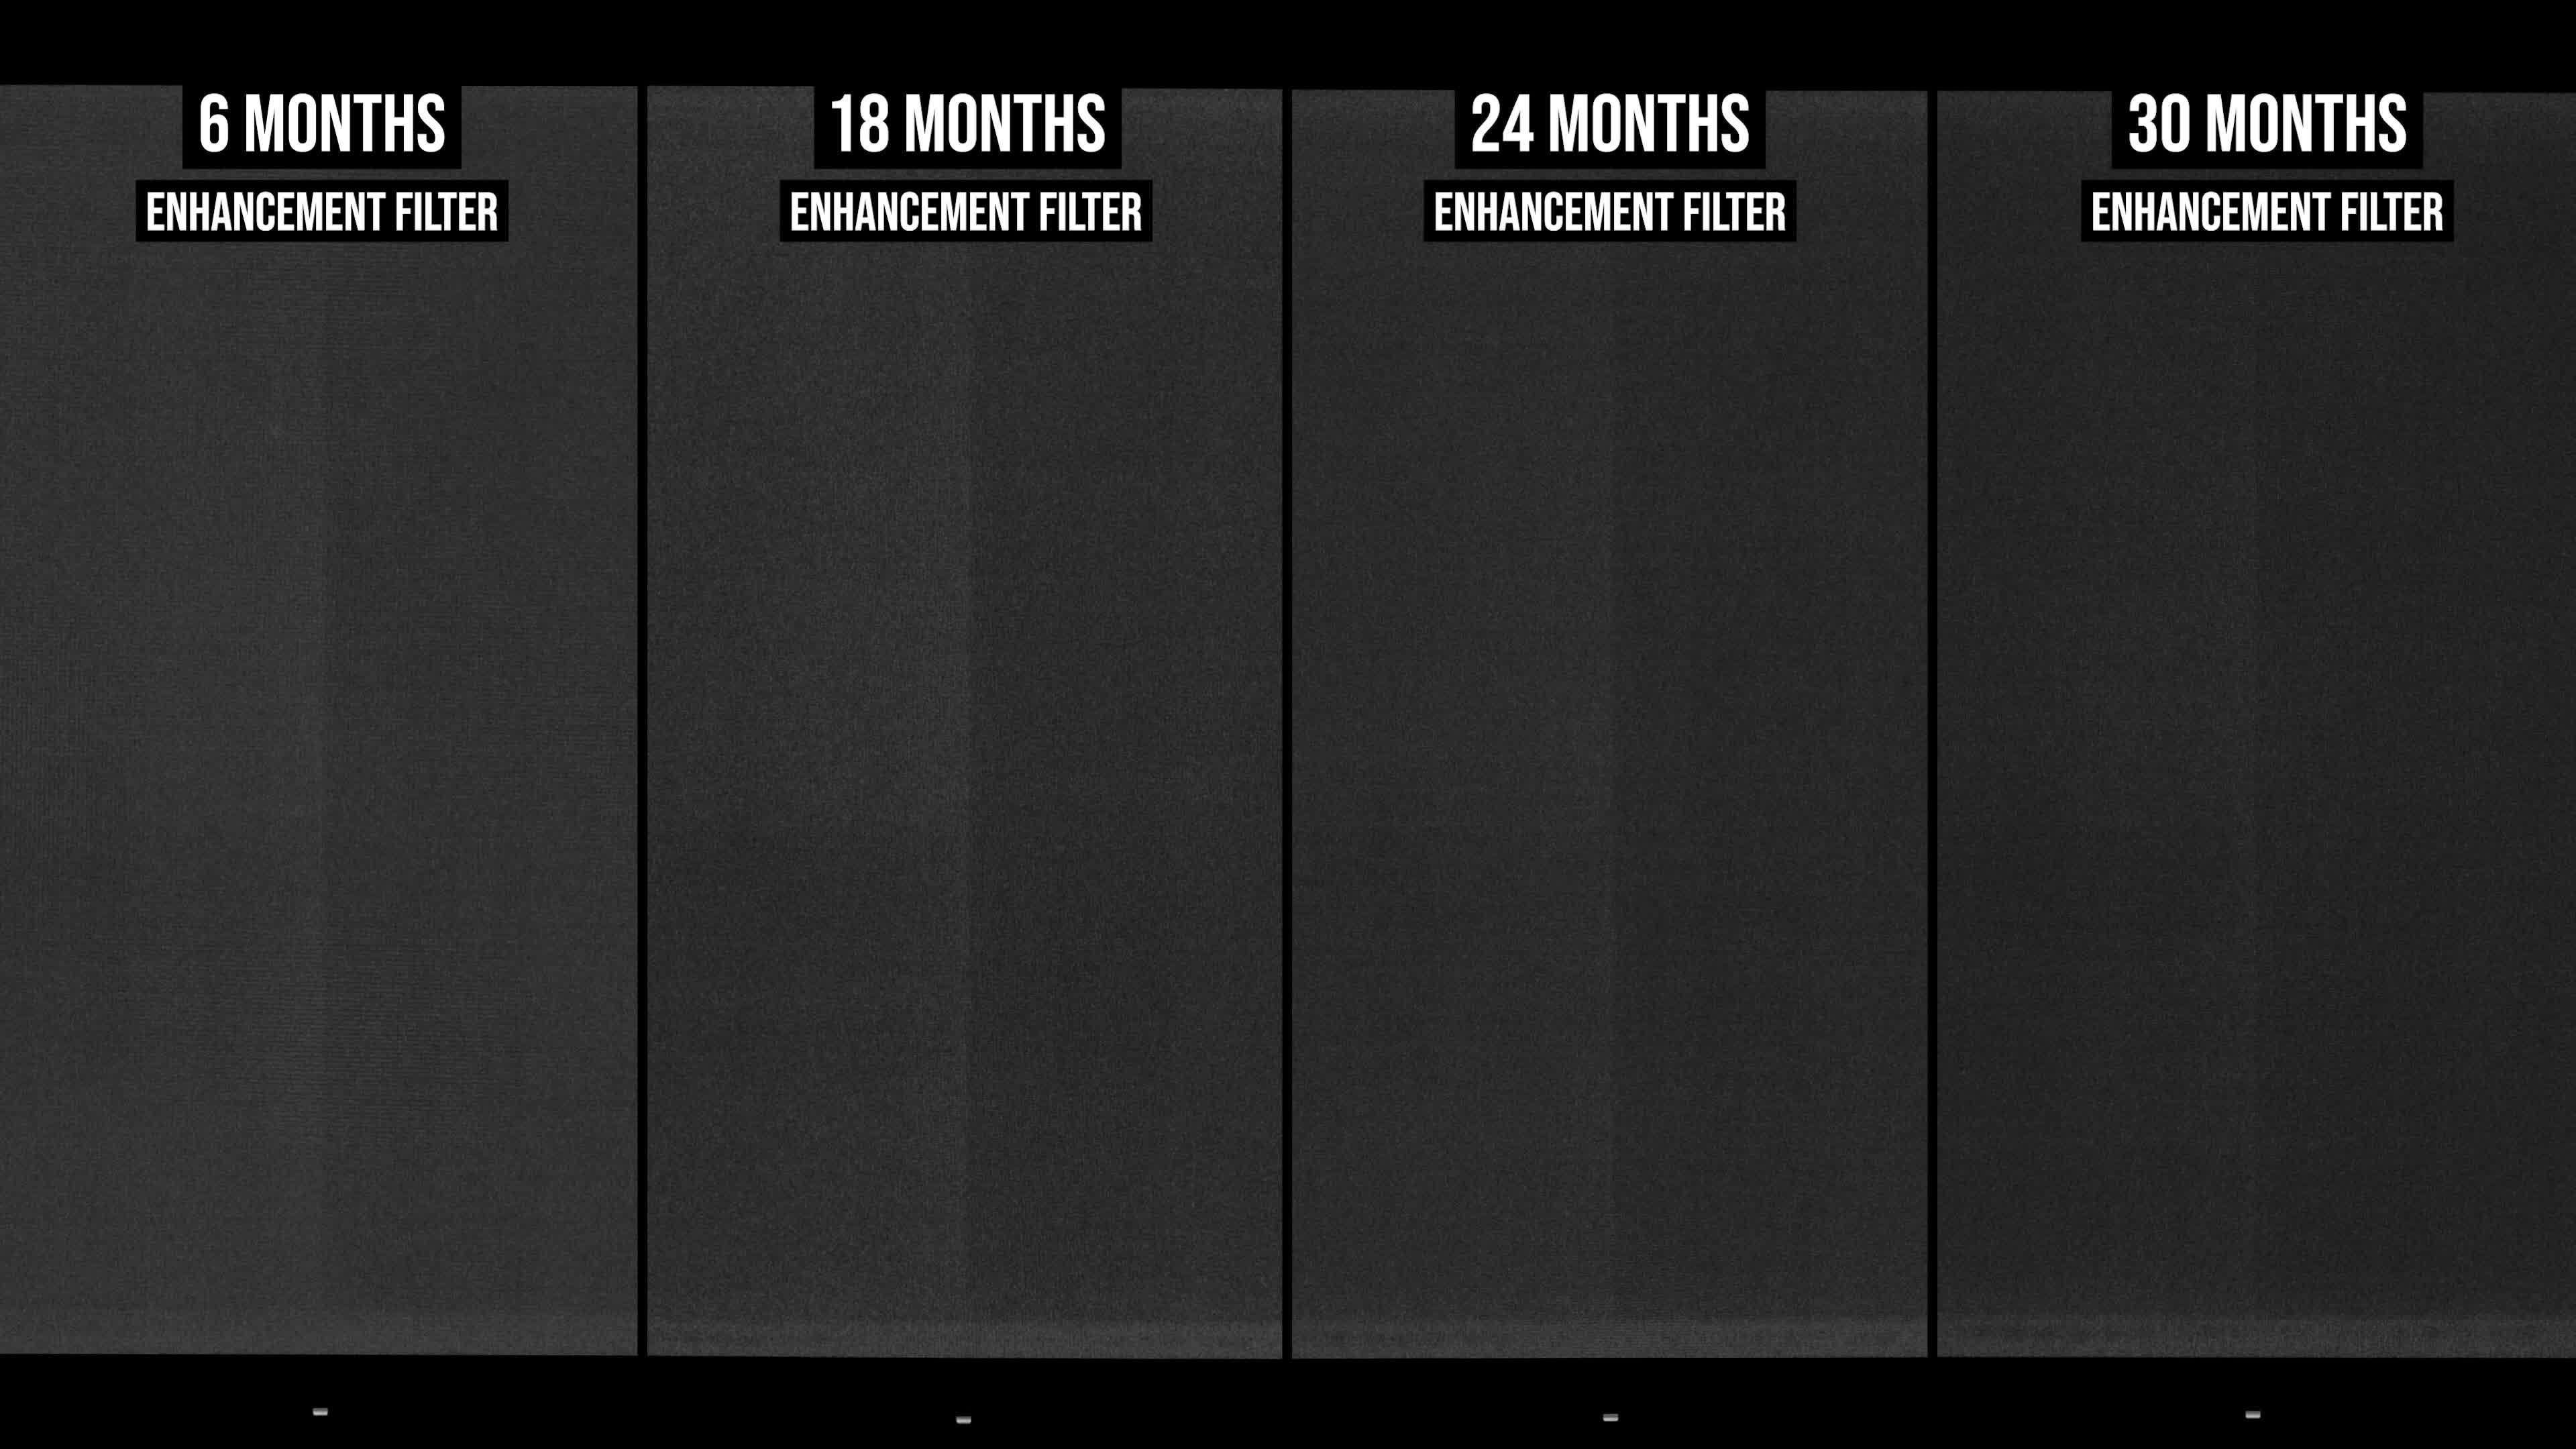
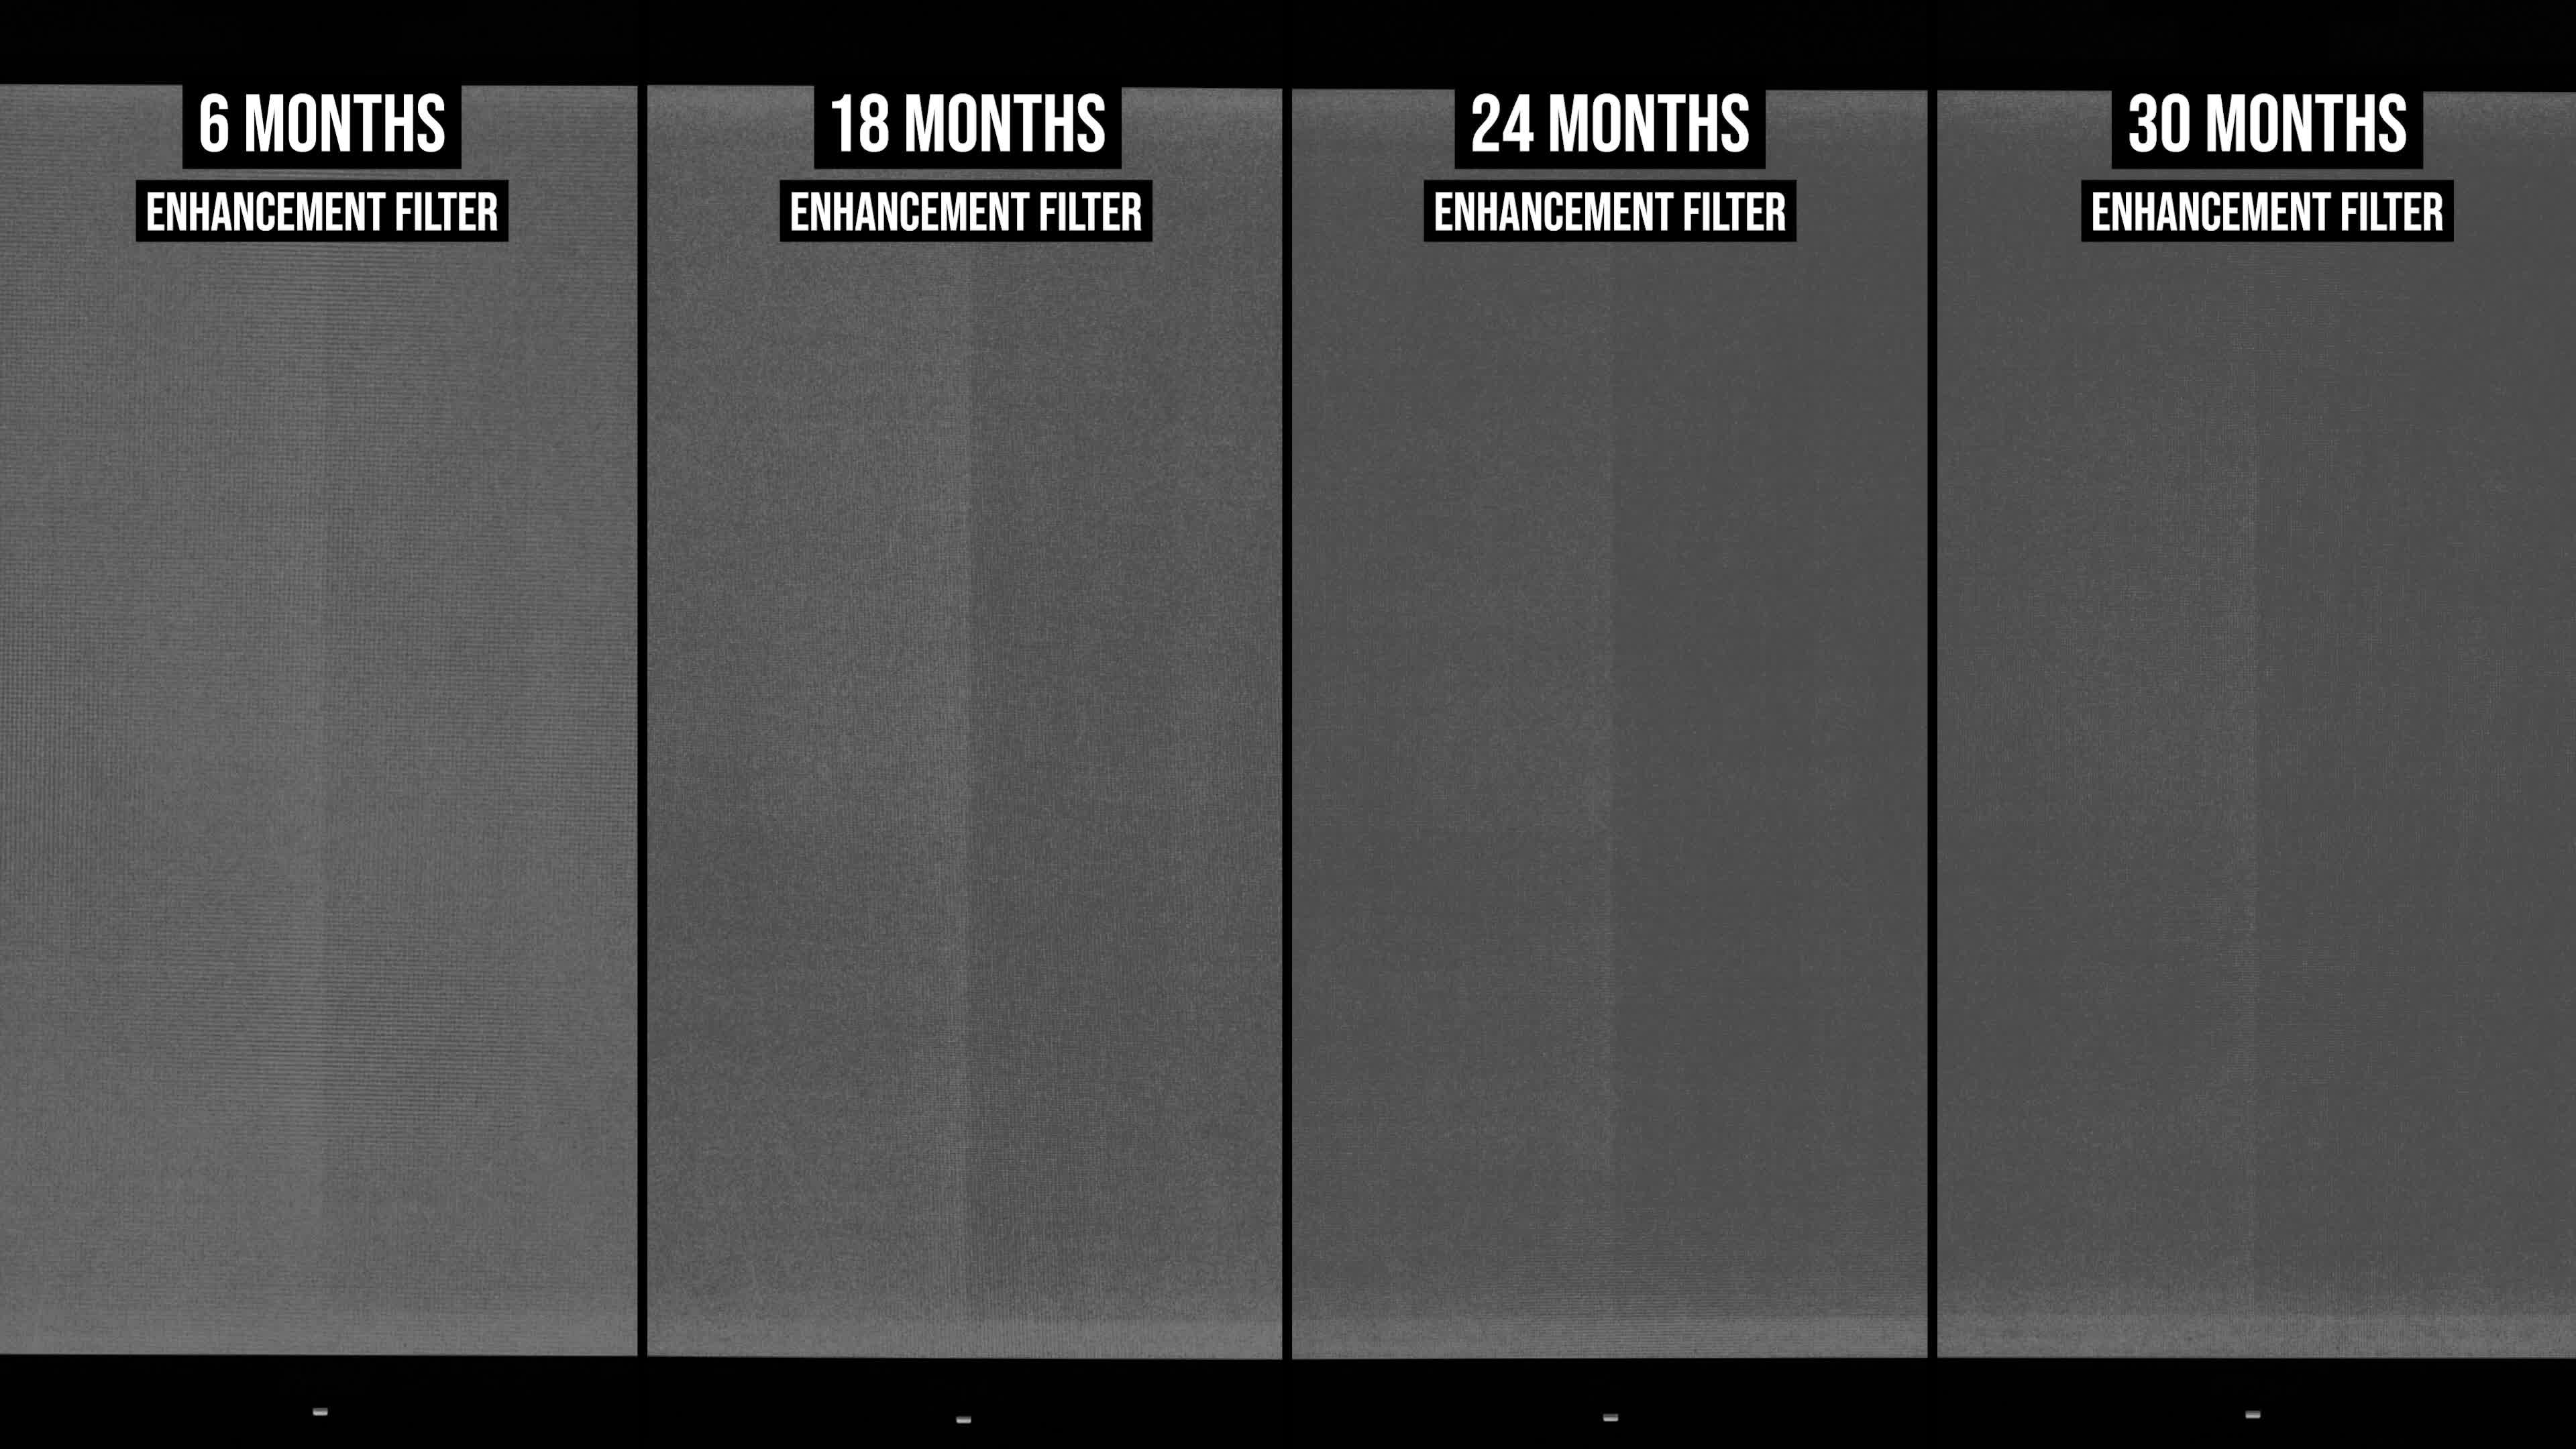
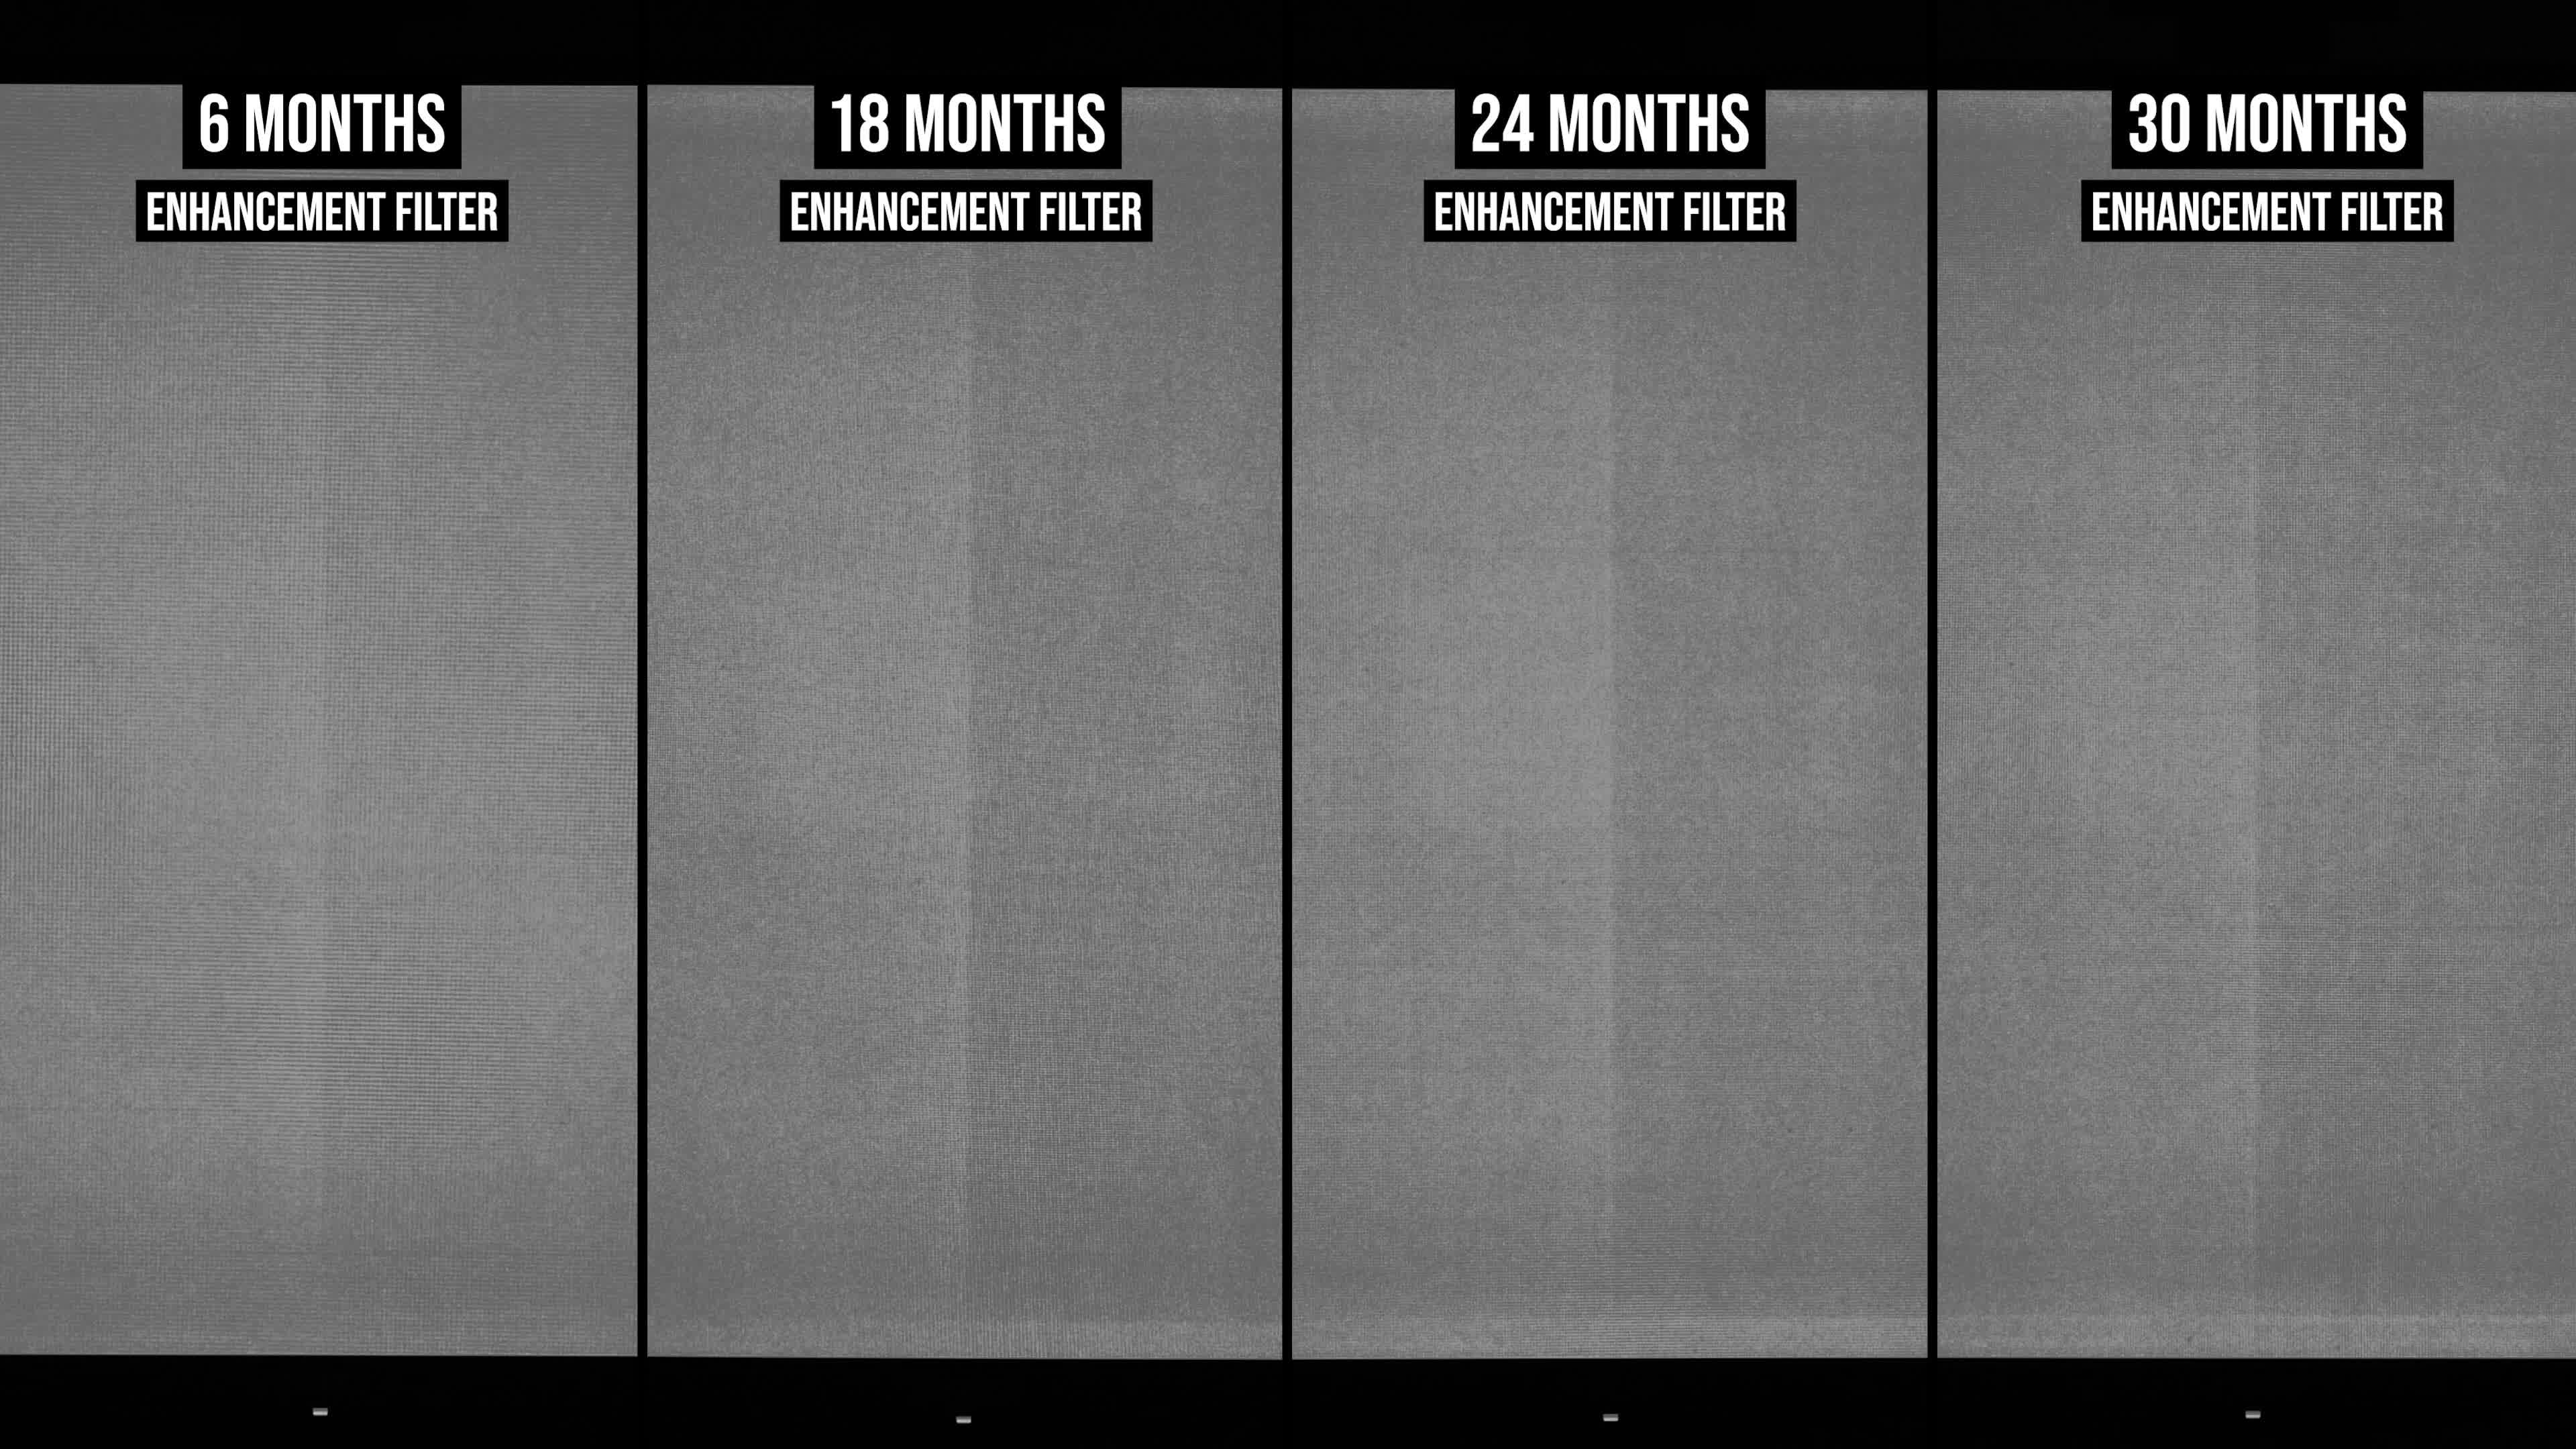
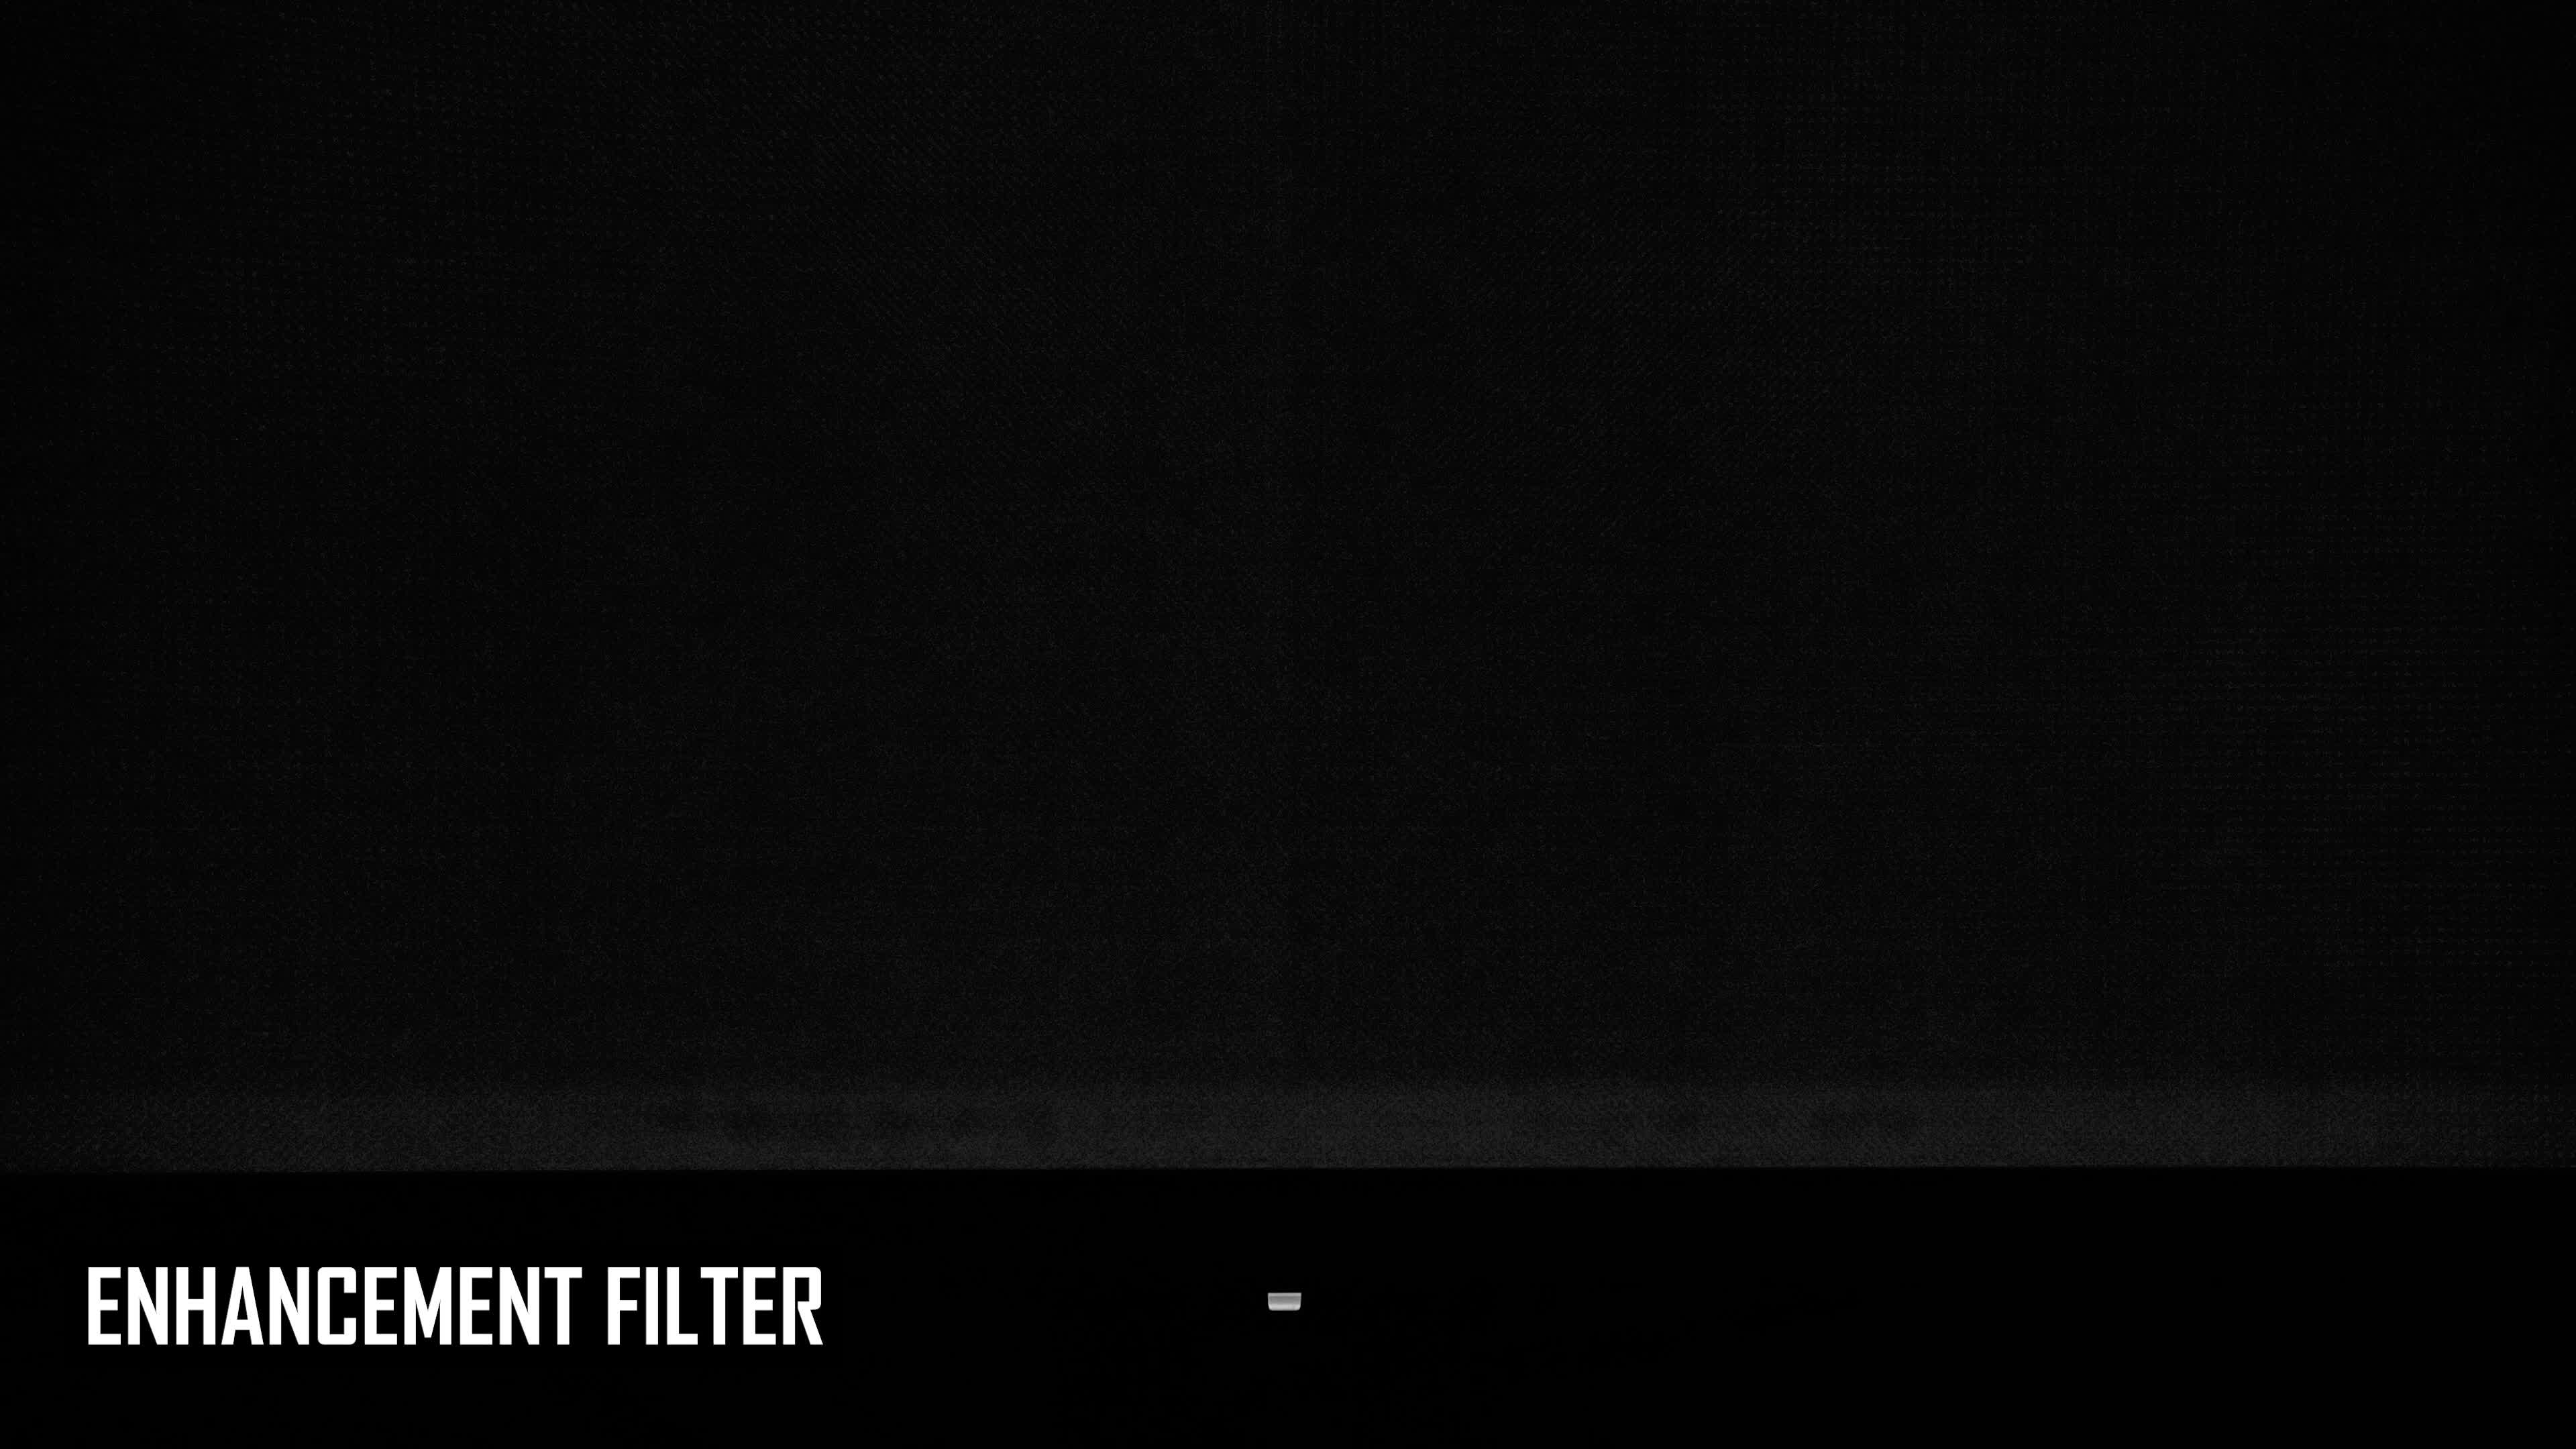
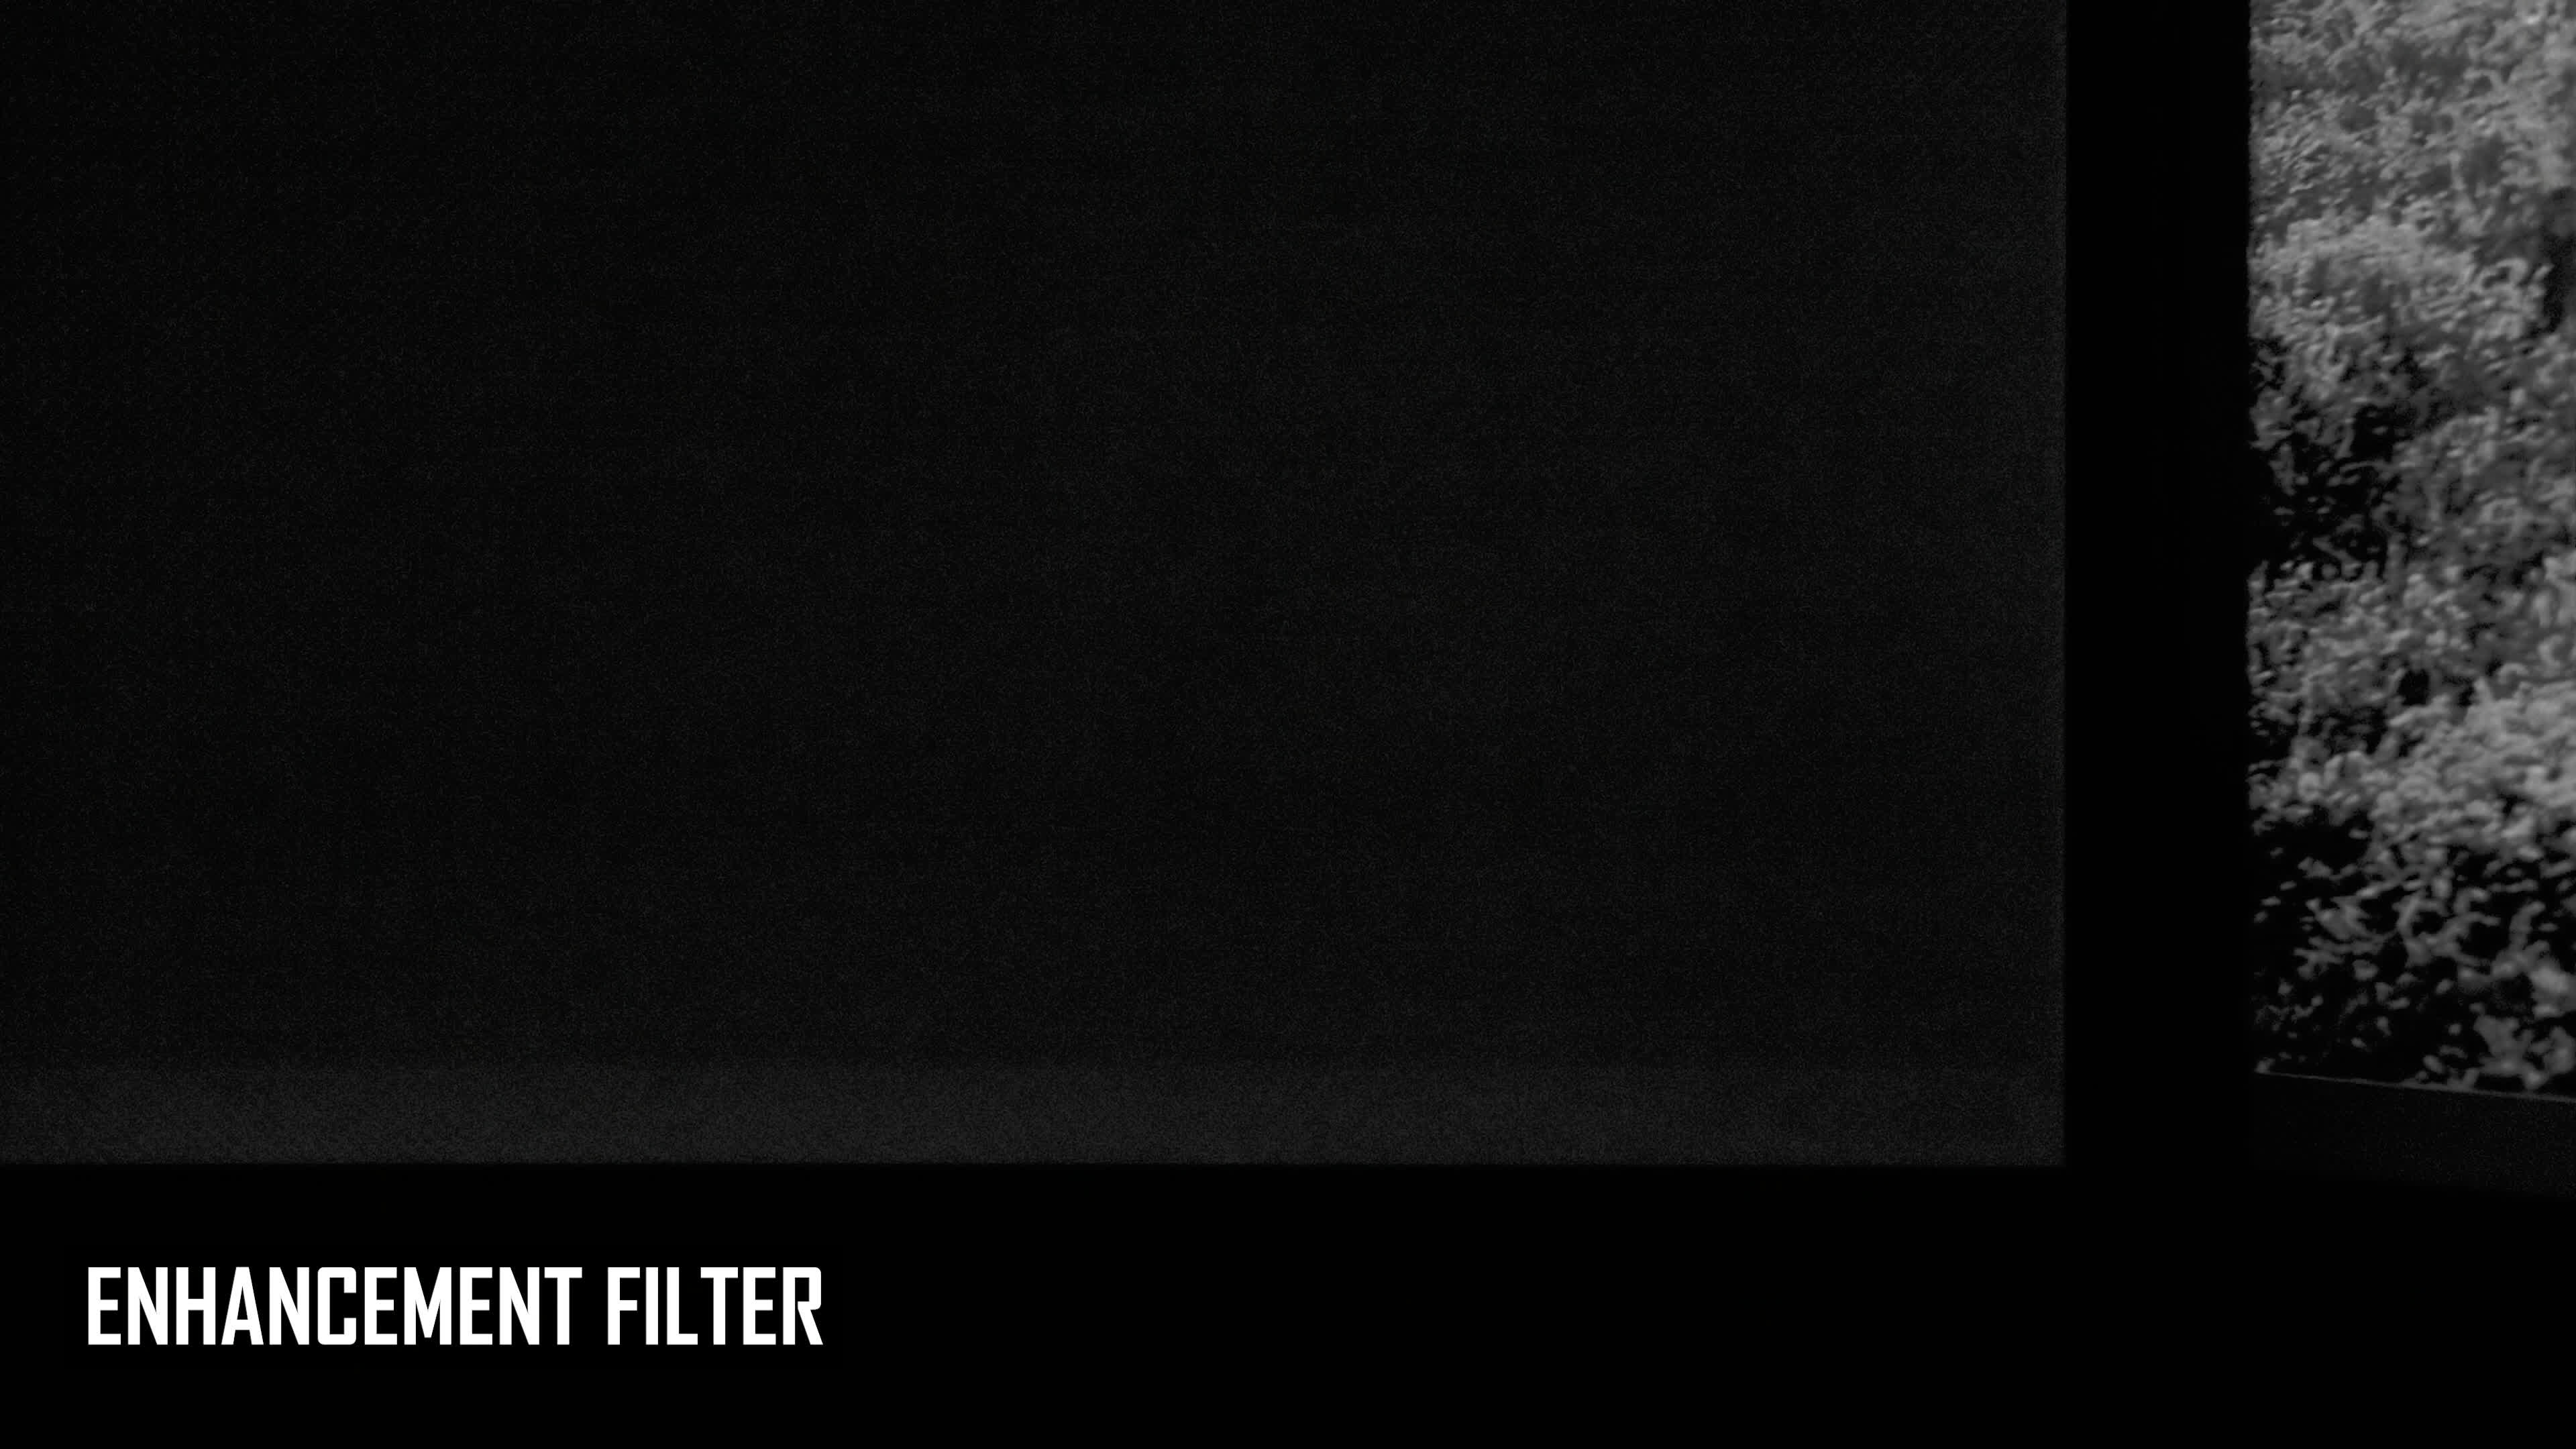
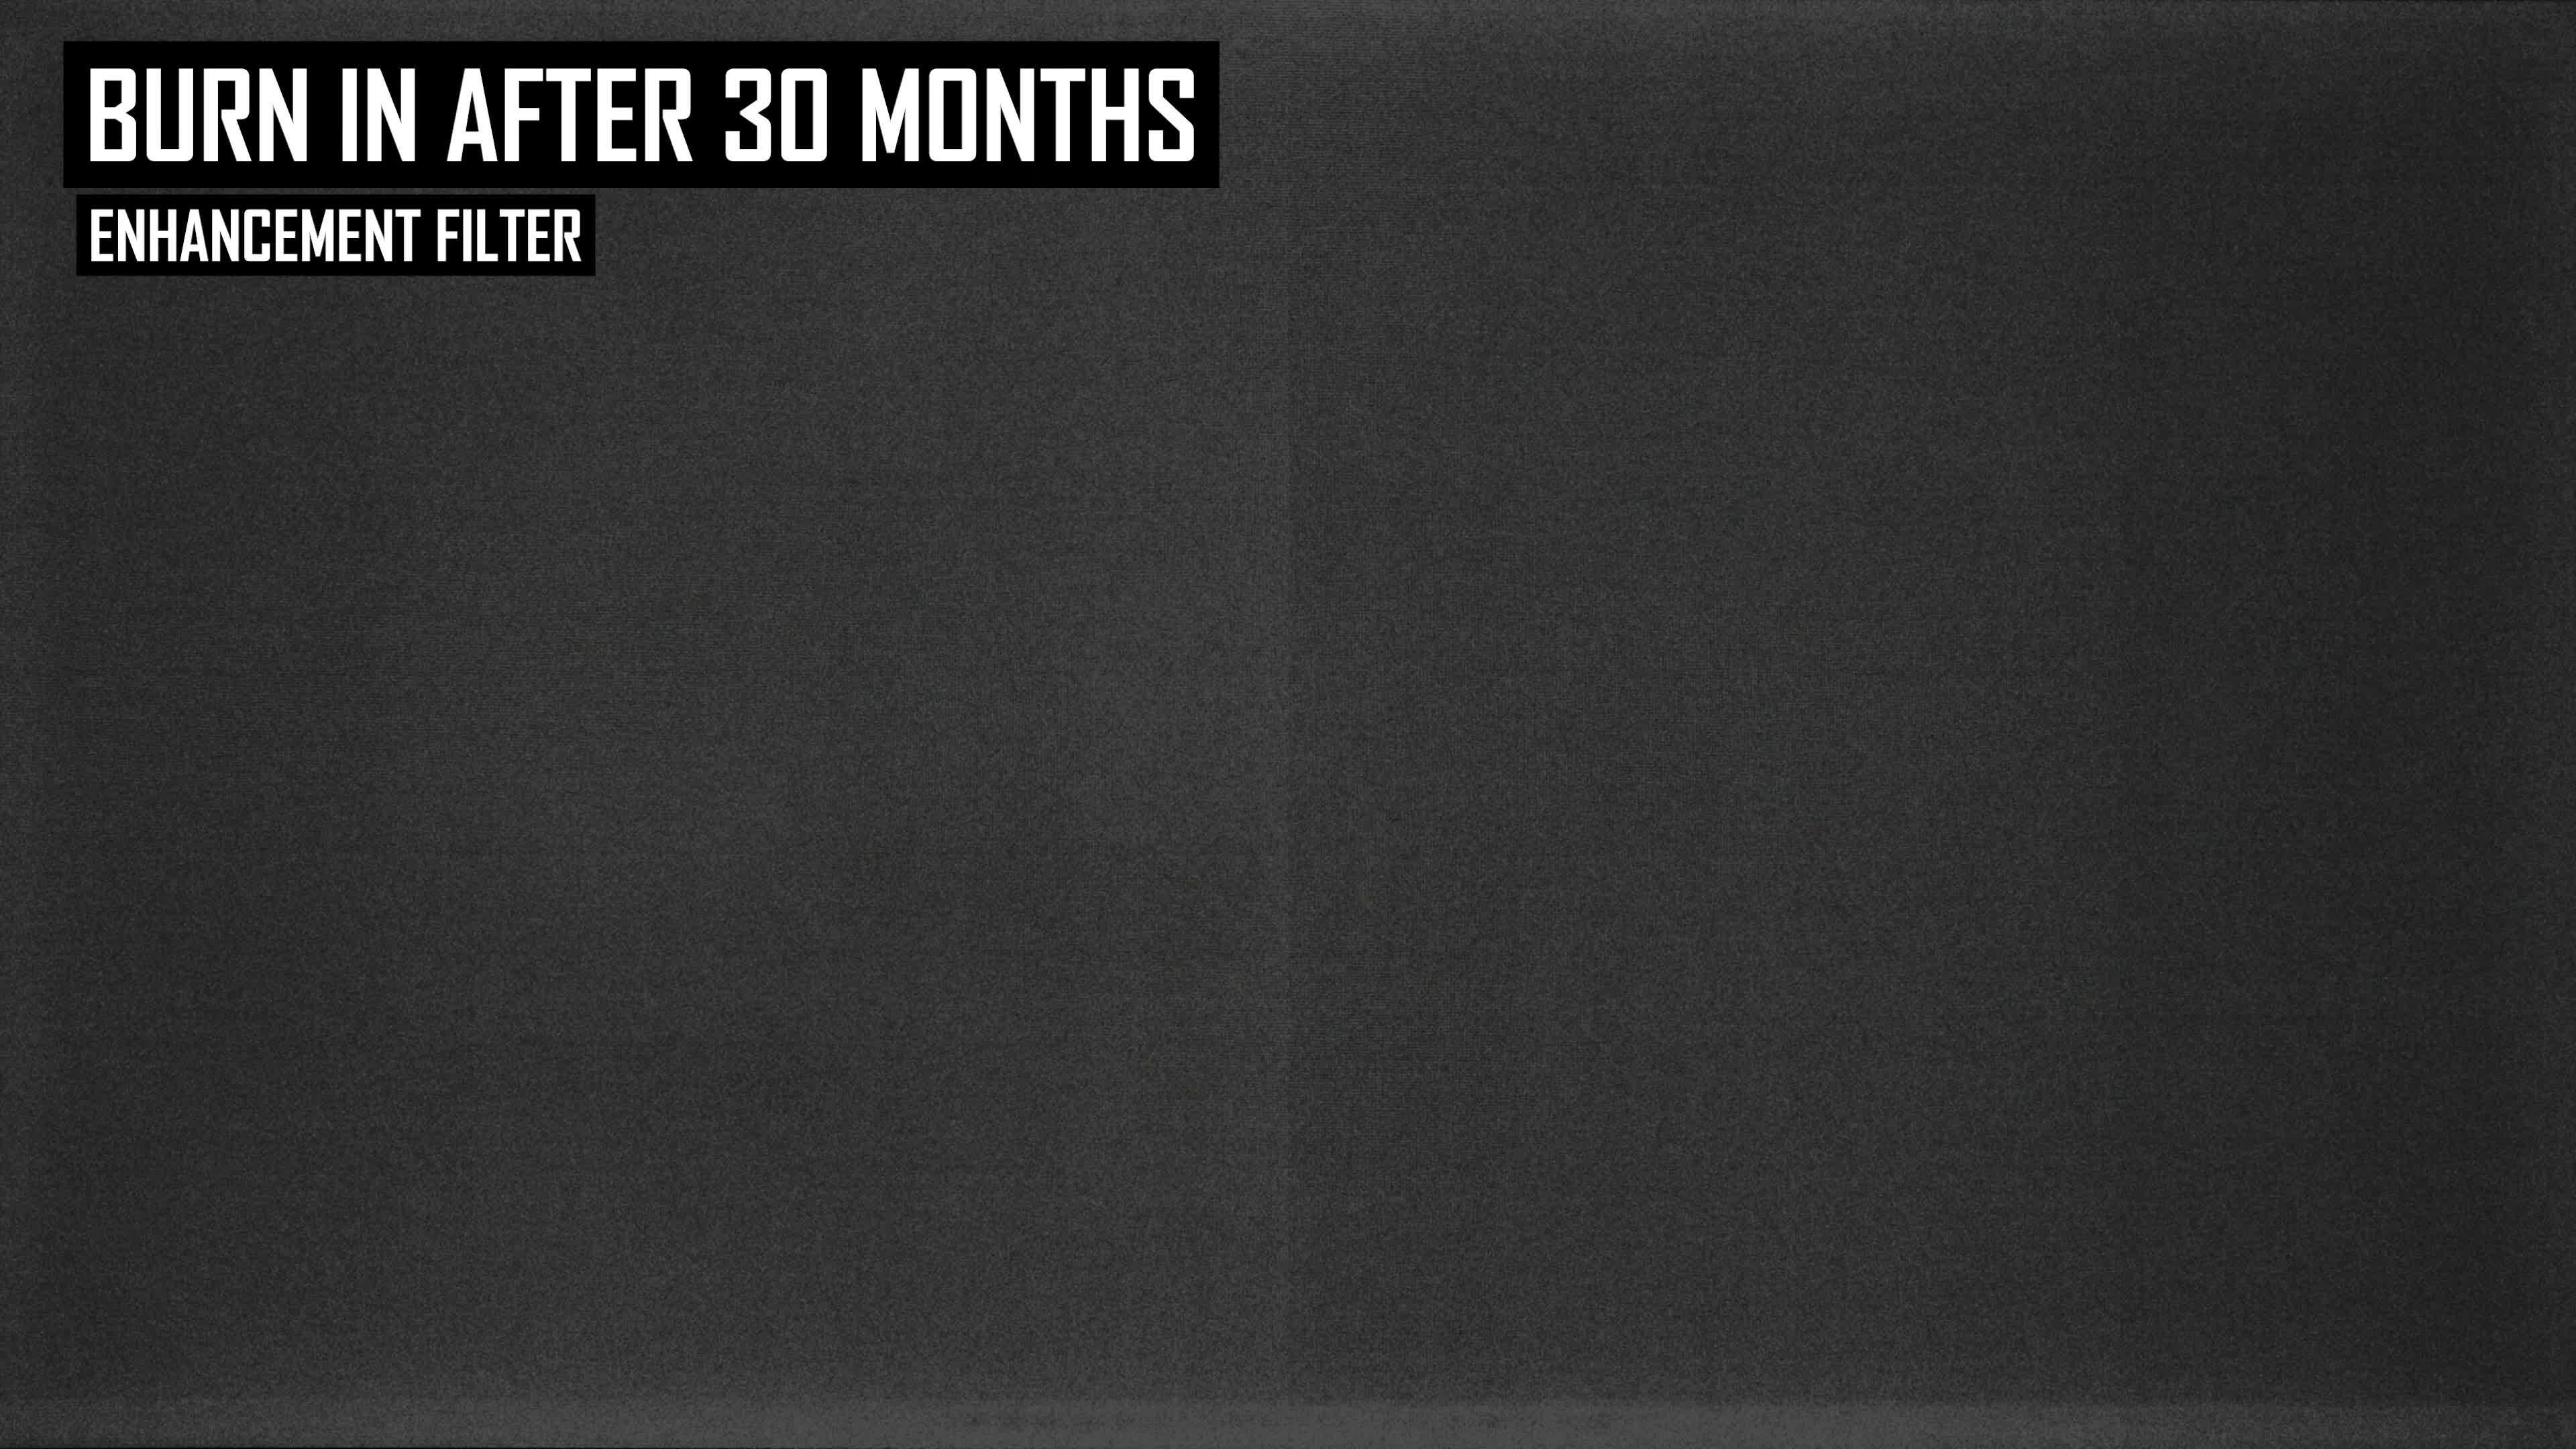
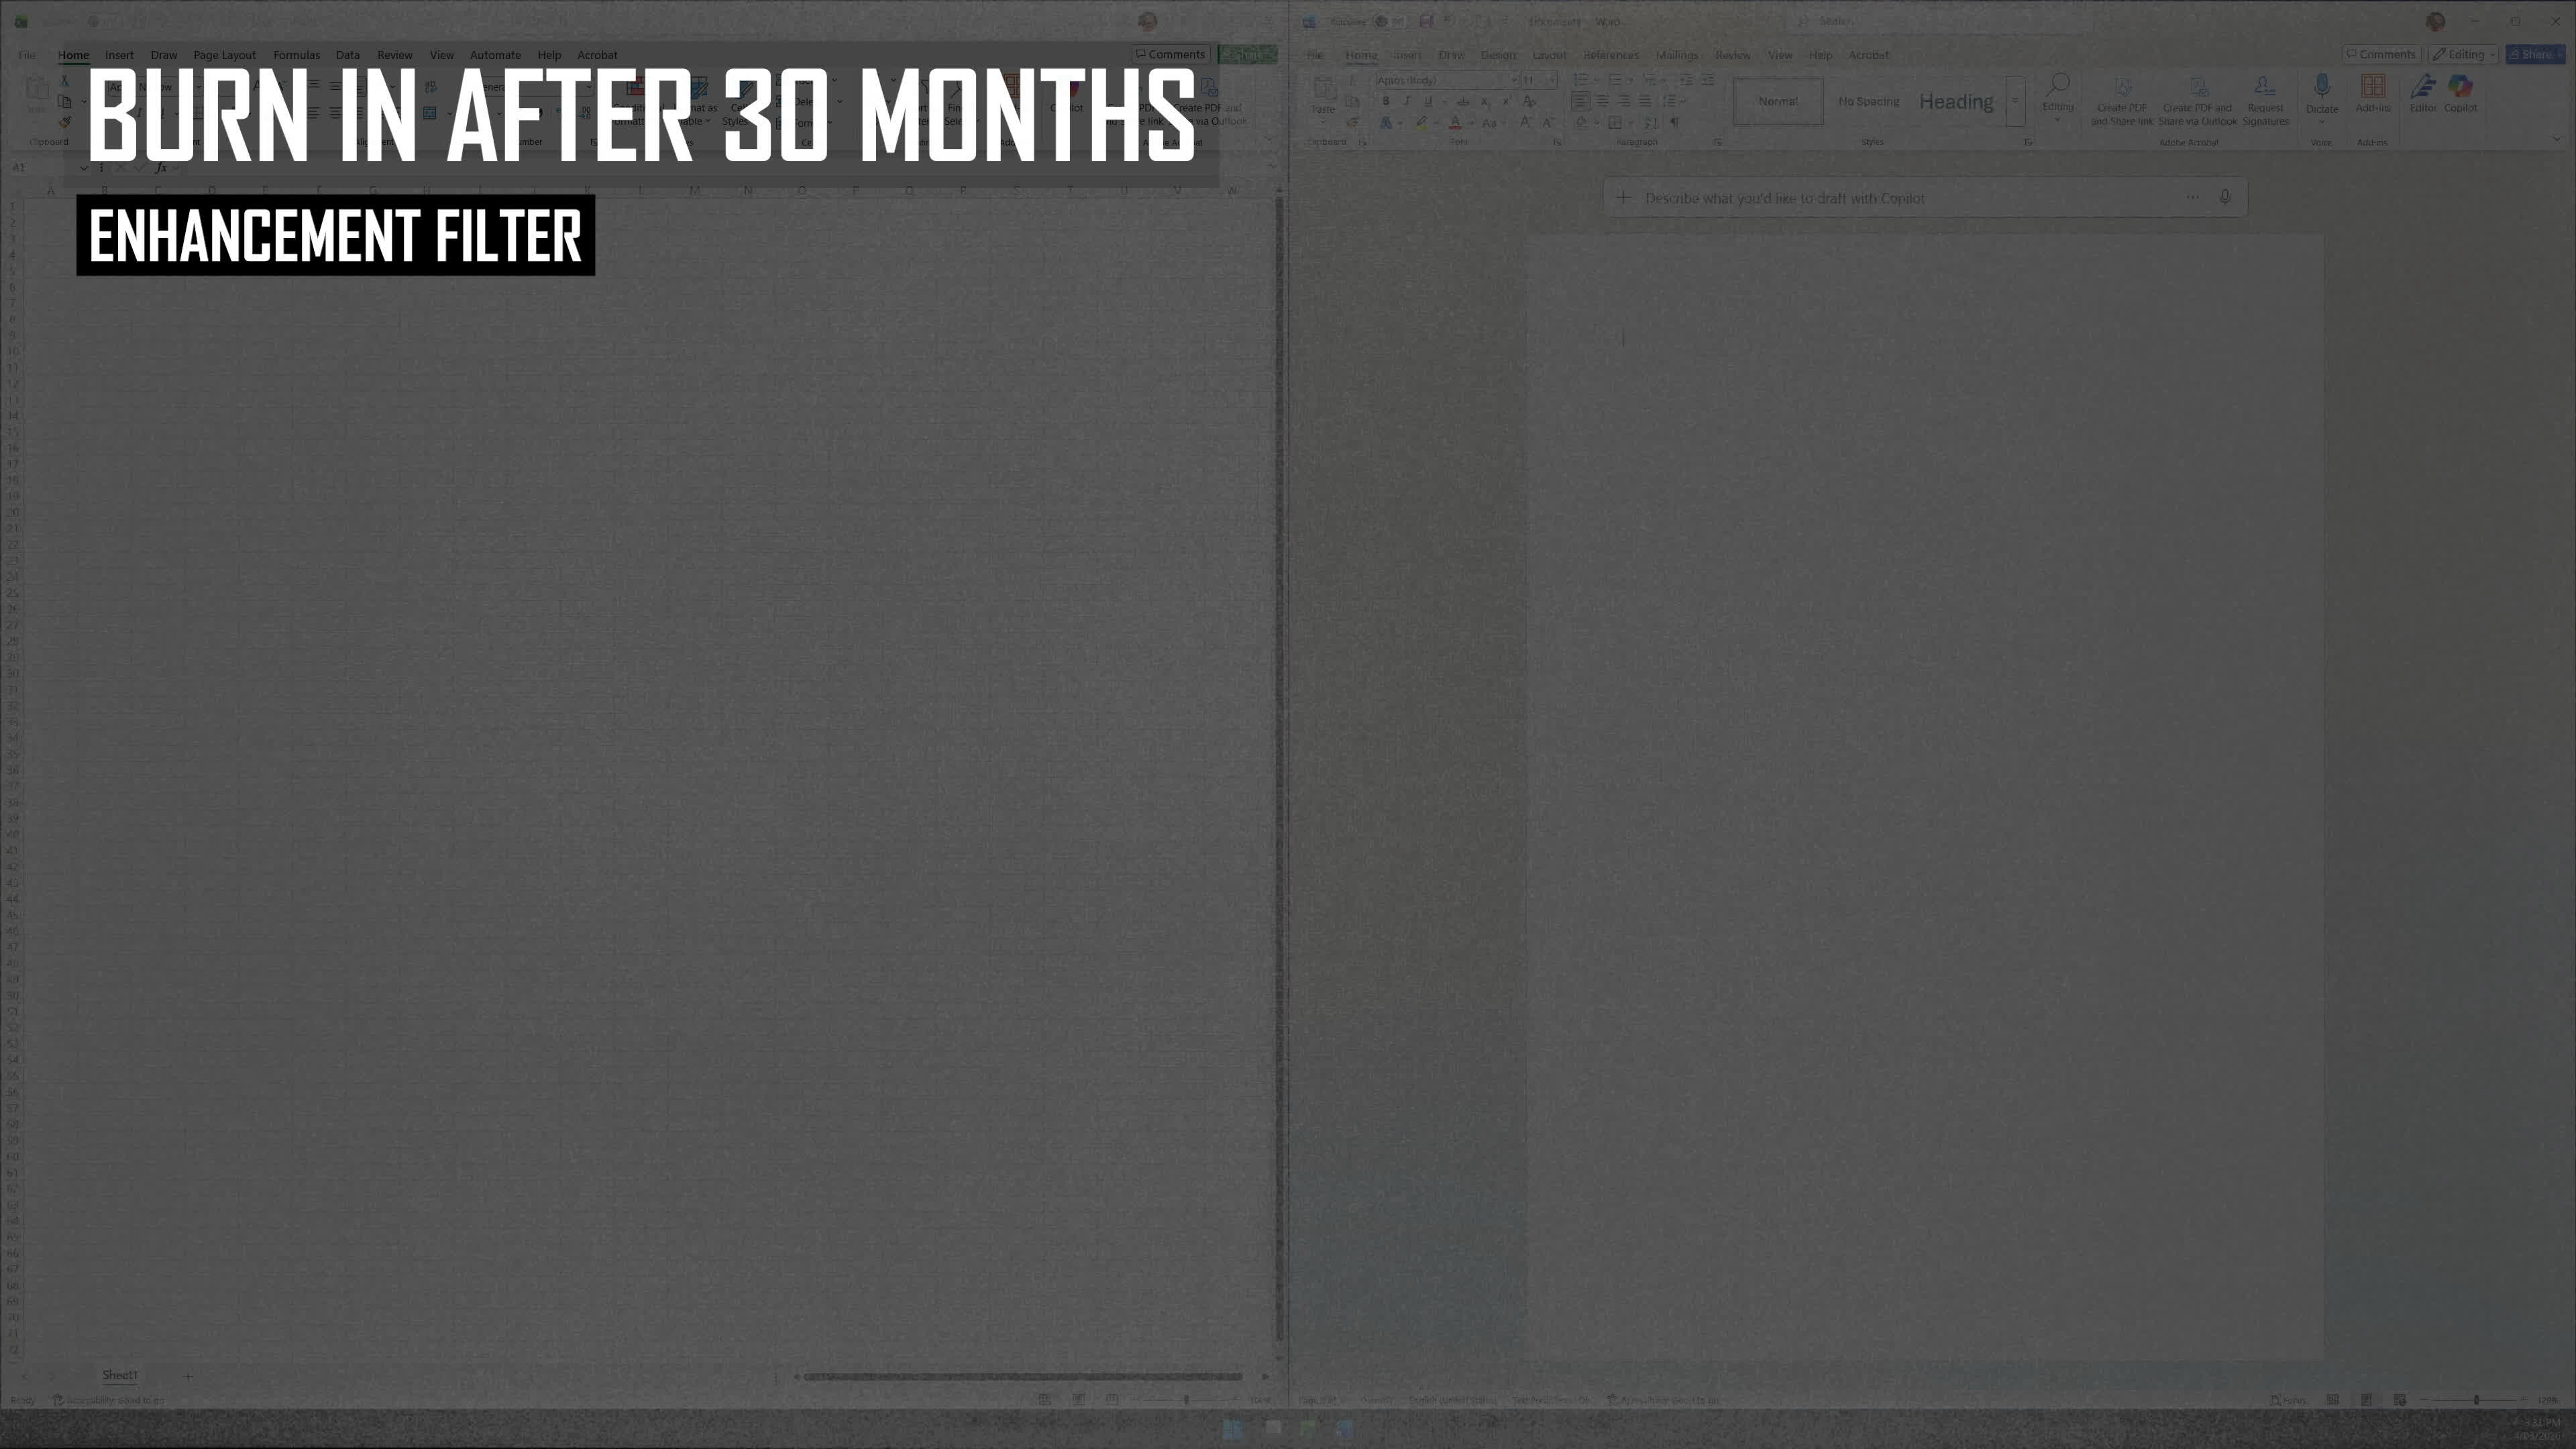
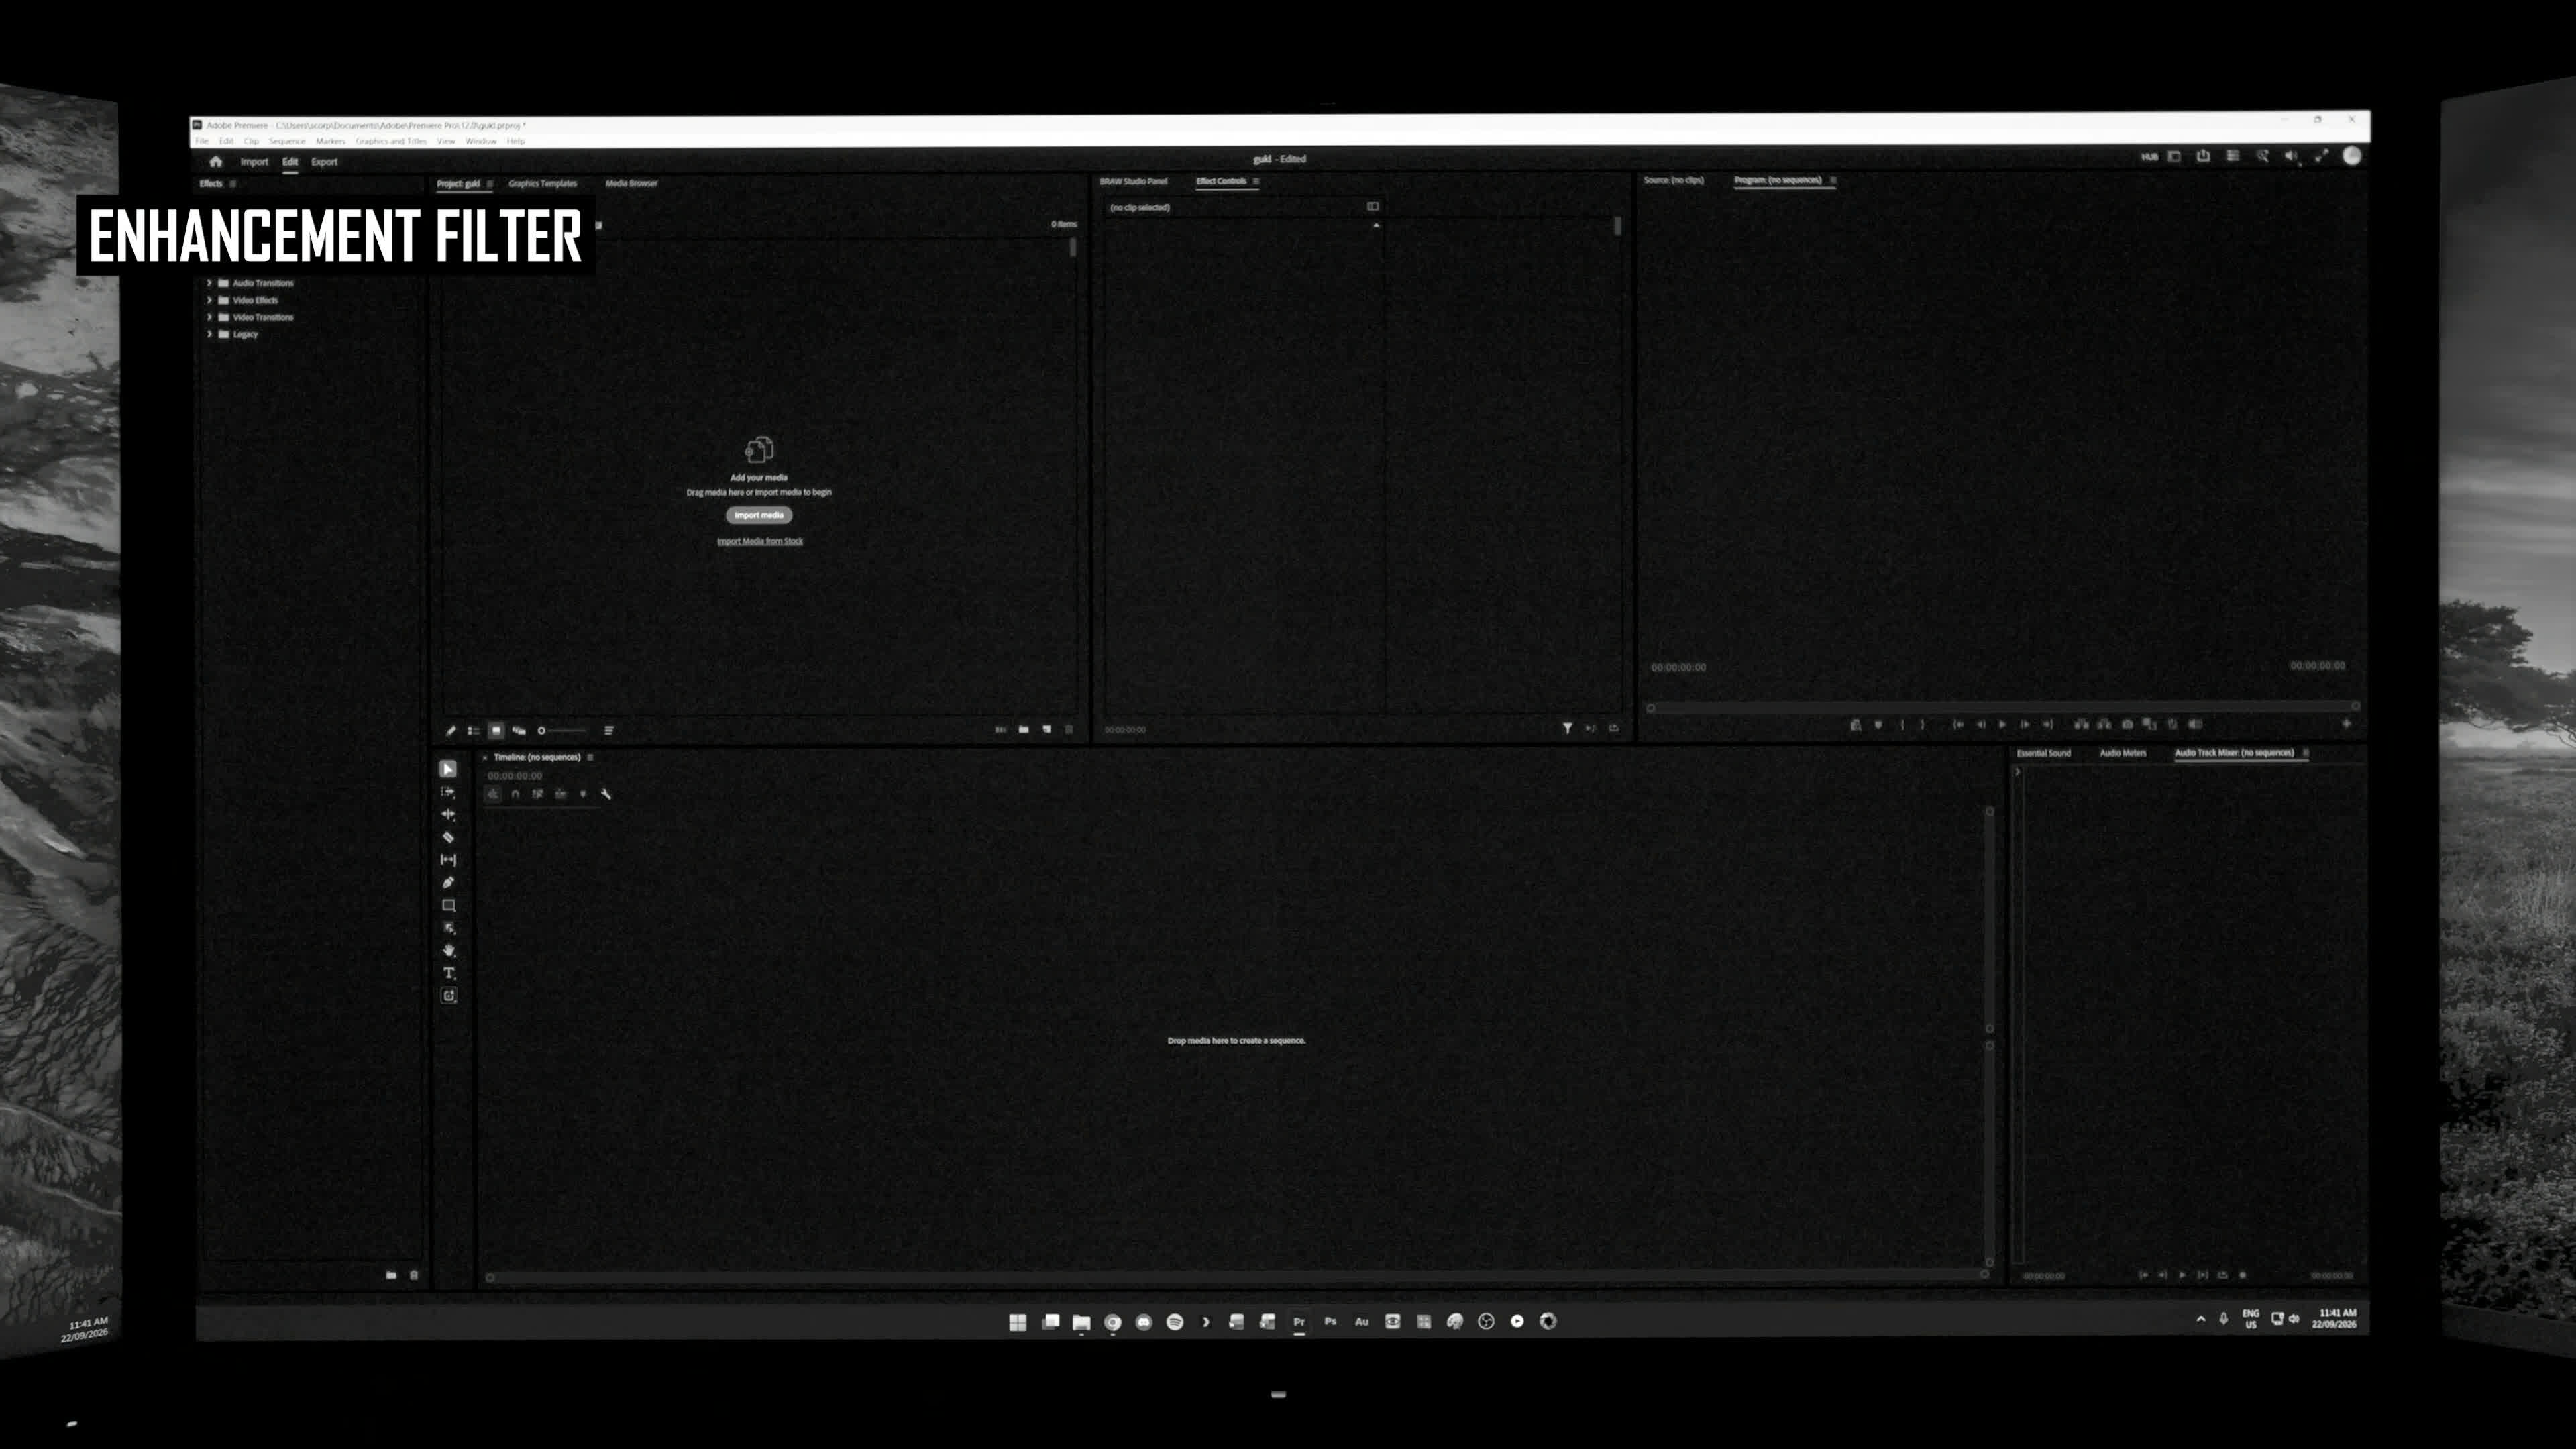
When we enable the burn-in enhancement filter, these artifacts become much more obvious. To be clear, these are digitally enhanced images of the screen that deliberately exaggerate the small differences in uniformity captured by the camera. This is not how the panel looks in real life. The enhancement is simply designed to make changes in burn-in easier to observe.
With the enhancement filter enabled, the line down the center of the screen remains clearly visible, but what we noticed is that the left and right sides have degraded more evenly after 30 months than in some of the earlier examples. This was particularly noticeable at 18 months, when the right side was clearly more degraded than the left. The right side has continued to degrade, but the left side has now caught up to some extent, creating a more uniform burn-in appearance across the panel.
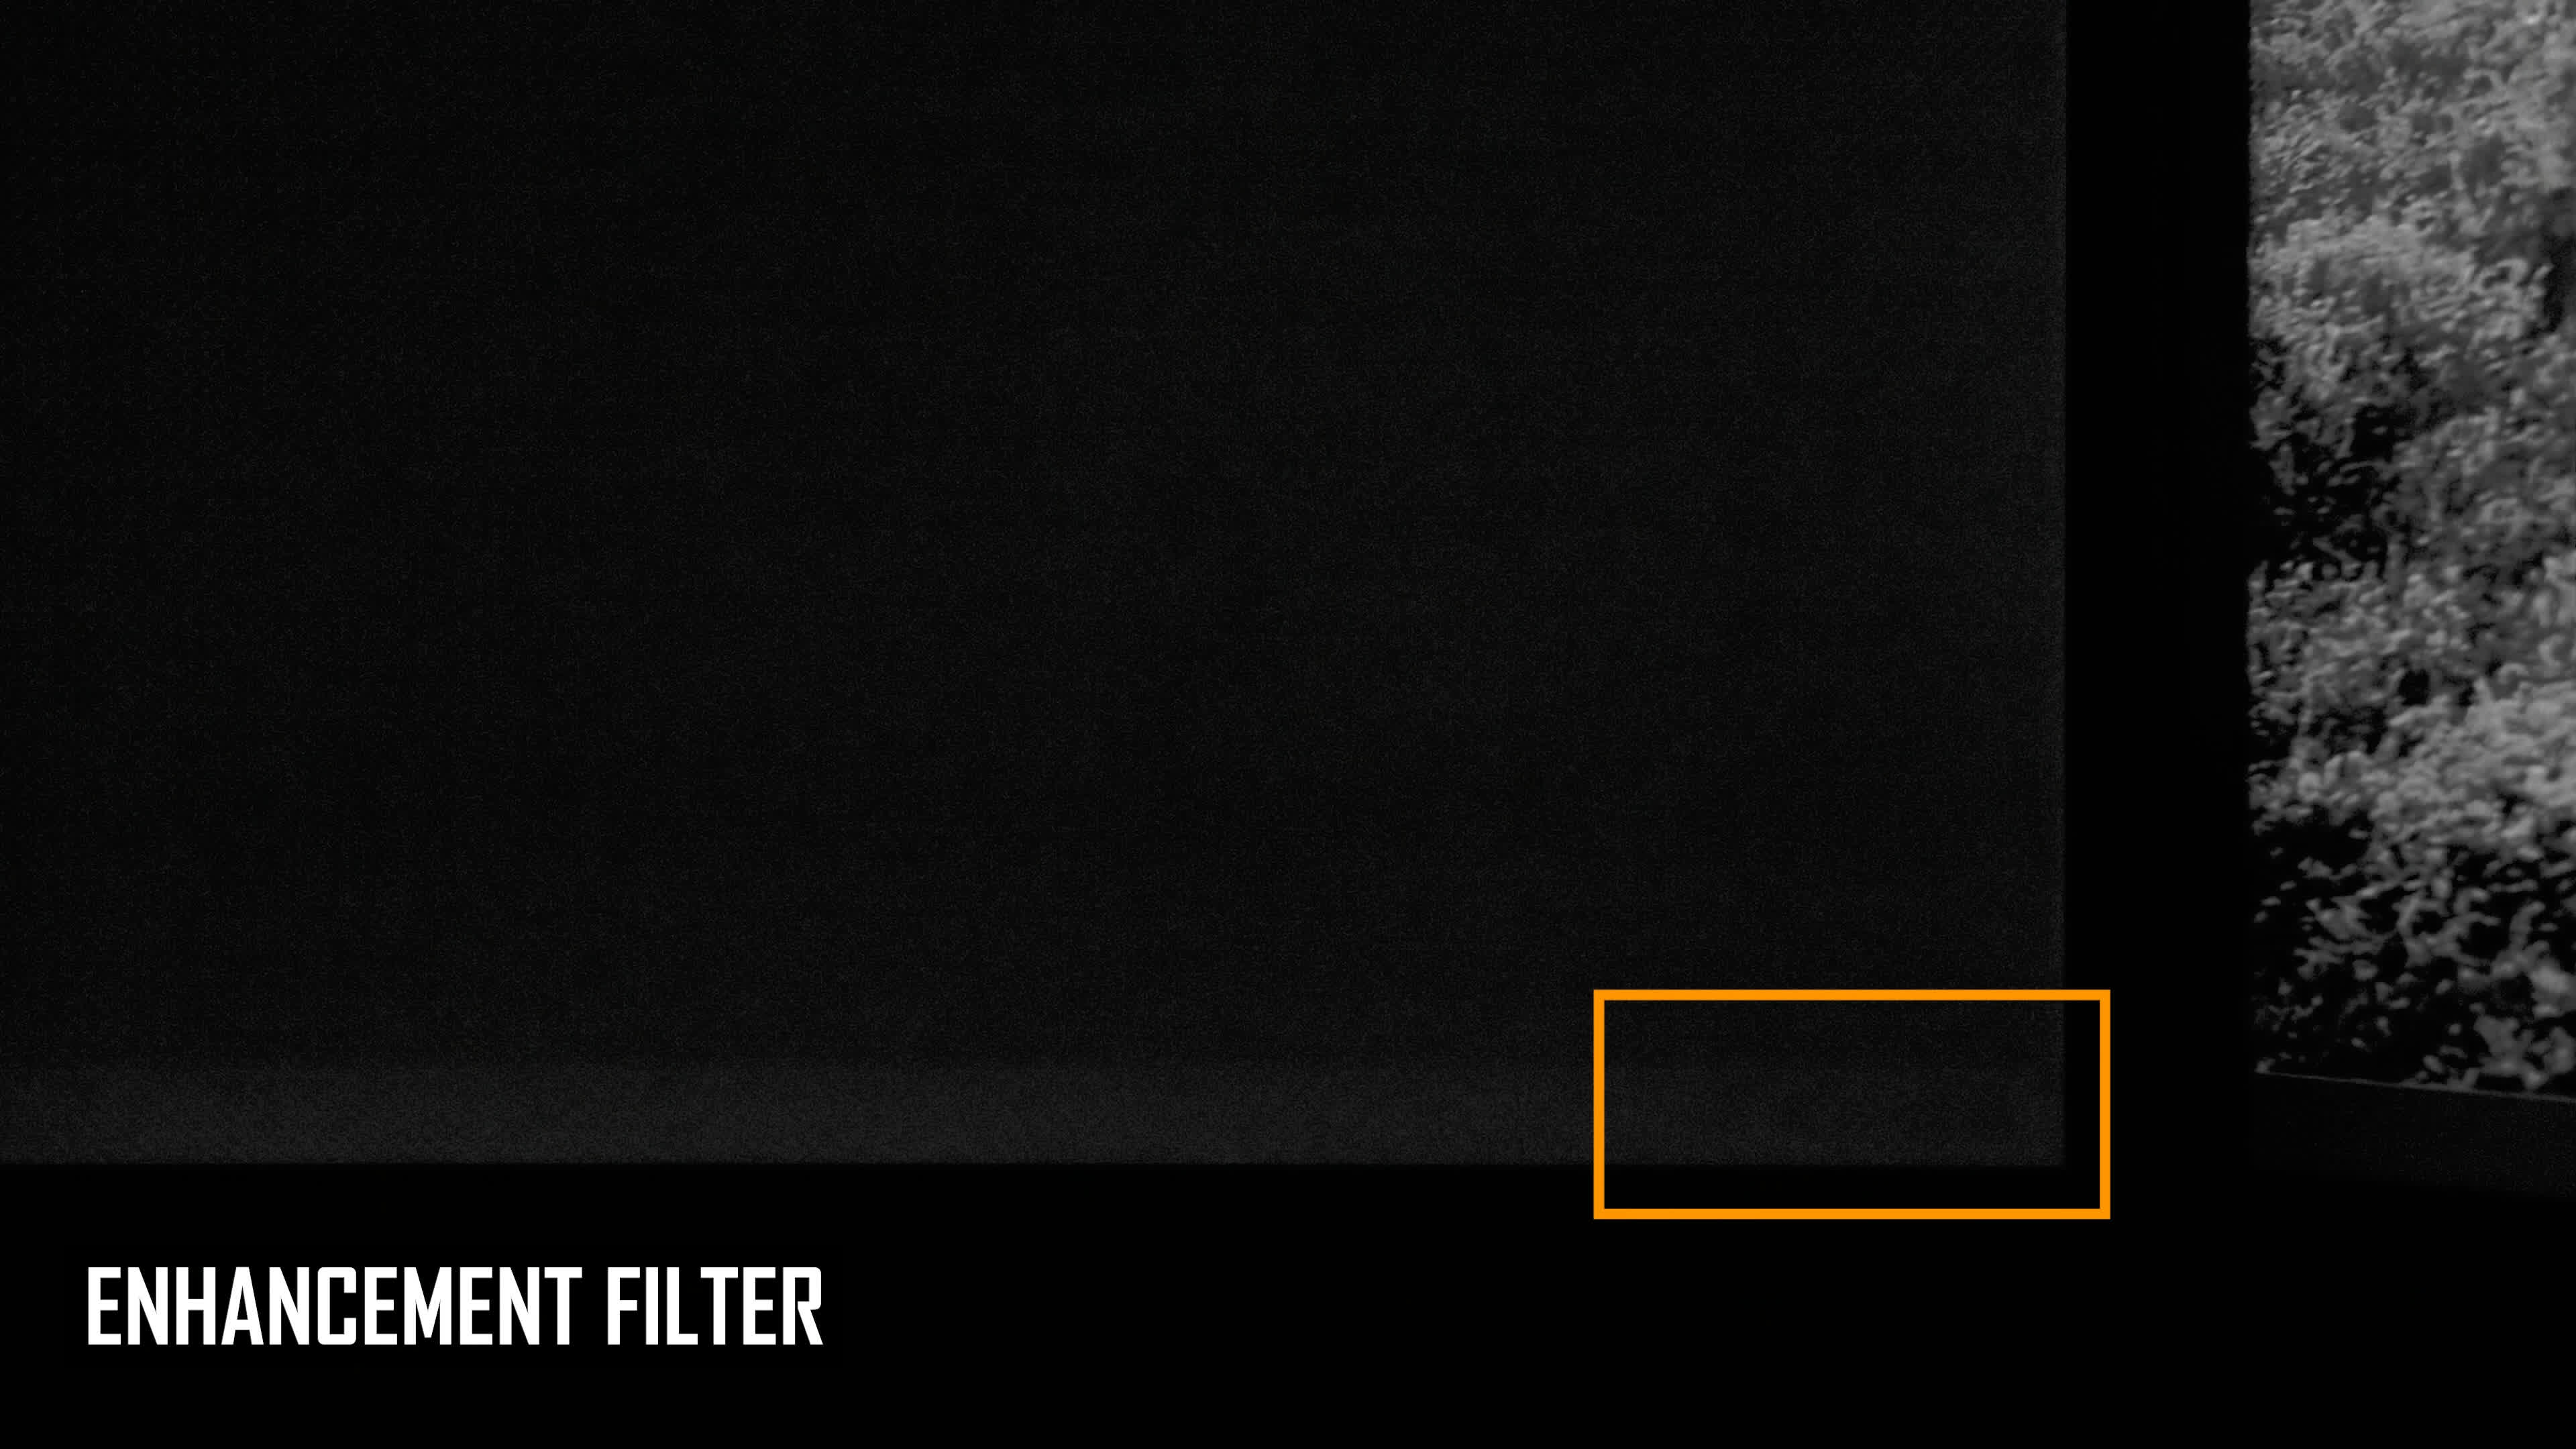
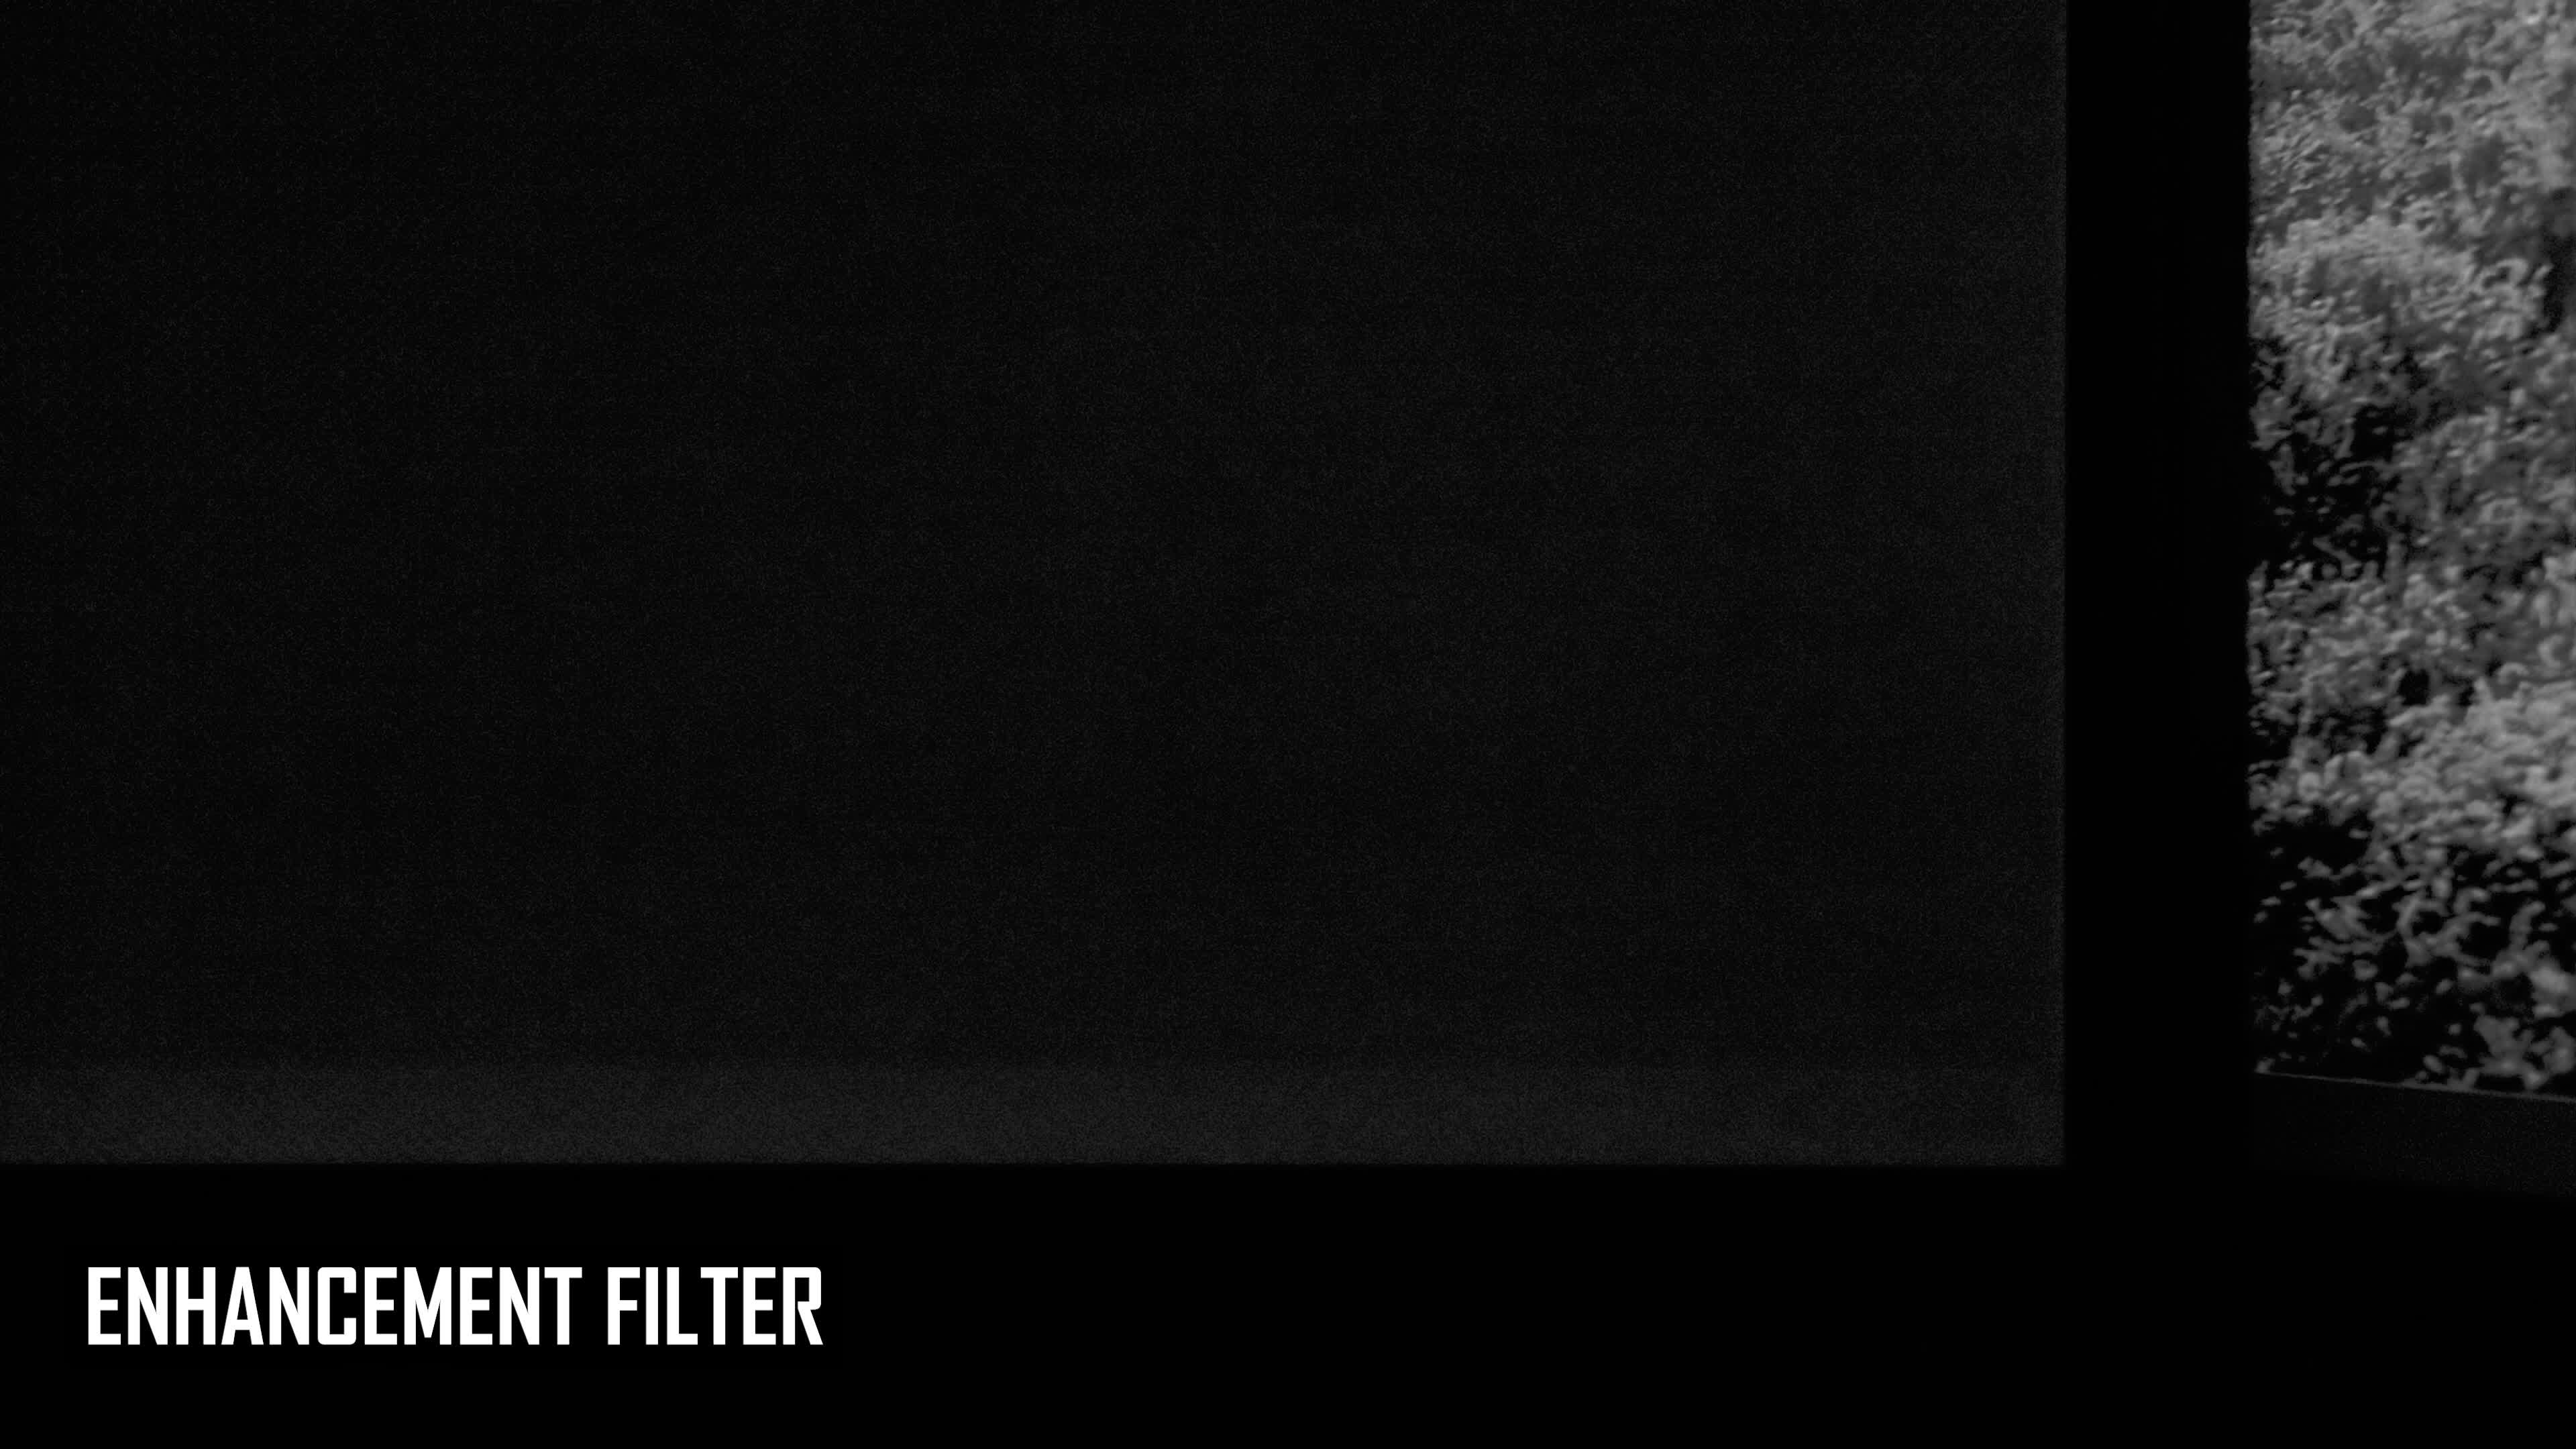
Unfortunately, the continued degradation of the main application areas has also made the taskbar inverse burn-in more prominent. In some of these images, there's now quite a significant difference between the taskbar area and the main portion of the screen, with the largest difference visible after 30 months, as expected.
In the last update, we also started to notice clear burn-in from the application icons within the taskbar. This has continued at 30 months and is now even more obvious, as we haven't changed the icon layout at all during the past six months.
When zooming in on the taskbar area, the regions where application icons are burning in become easier to see, especially with the enhancement filter enabled. What's interesting about taskbar burn-in on a monitor used largely for productivity is that it isn't noticeable at all during regular usage because the taskbar itself is always visible. The burn-in occurs in an area that continues to display the same content, effectively hiding the damage while simultaneously causing more of it.
We can only see this taskbar burn-in when viewing full-screen content, and even then, the content needs to be reasonably uniform for the line along the bottom edge to become visible. That's a relatively rare situation. So, in real-world usage, the vertical line caused by our side-by-side application layout is still the most annoying issue for me.
The taskbar doesn't just show burn-in around the application icons. There's also visible degradation in the bottom-right corner, where Windows places the time, date, and status icons. With a dark taskbar, this text is bright and remains permanently in the same position, so burn-in is creating a shadow in that area.
Pixel shifting appears to be helping prevent sharply defined lines from forming, so what we're seeing is more of a general shadowy blur. Regardless, it became visible in these examples after 24 months and has worsened at the 30-month mark.
Subpixel Degradation and Color Shift
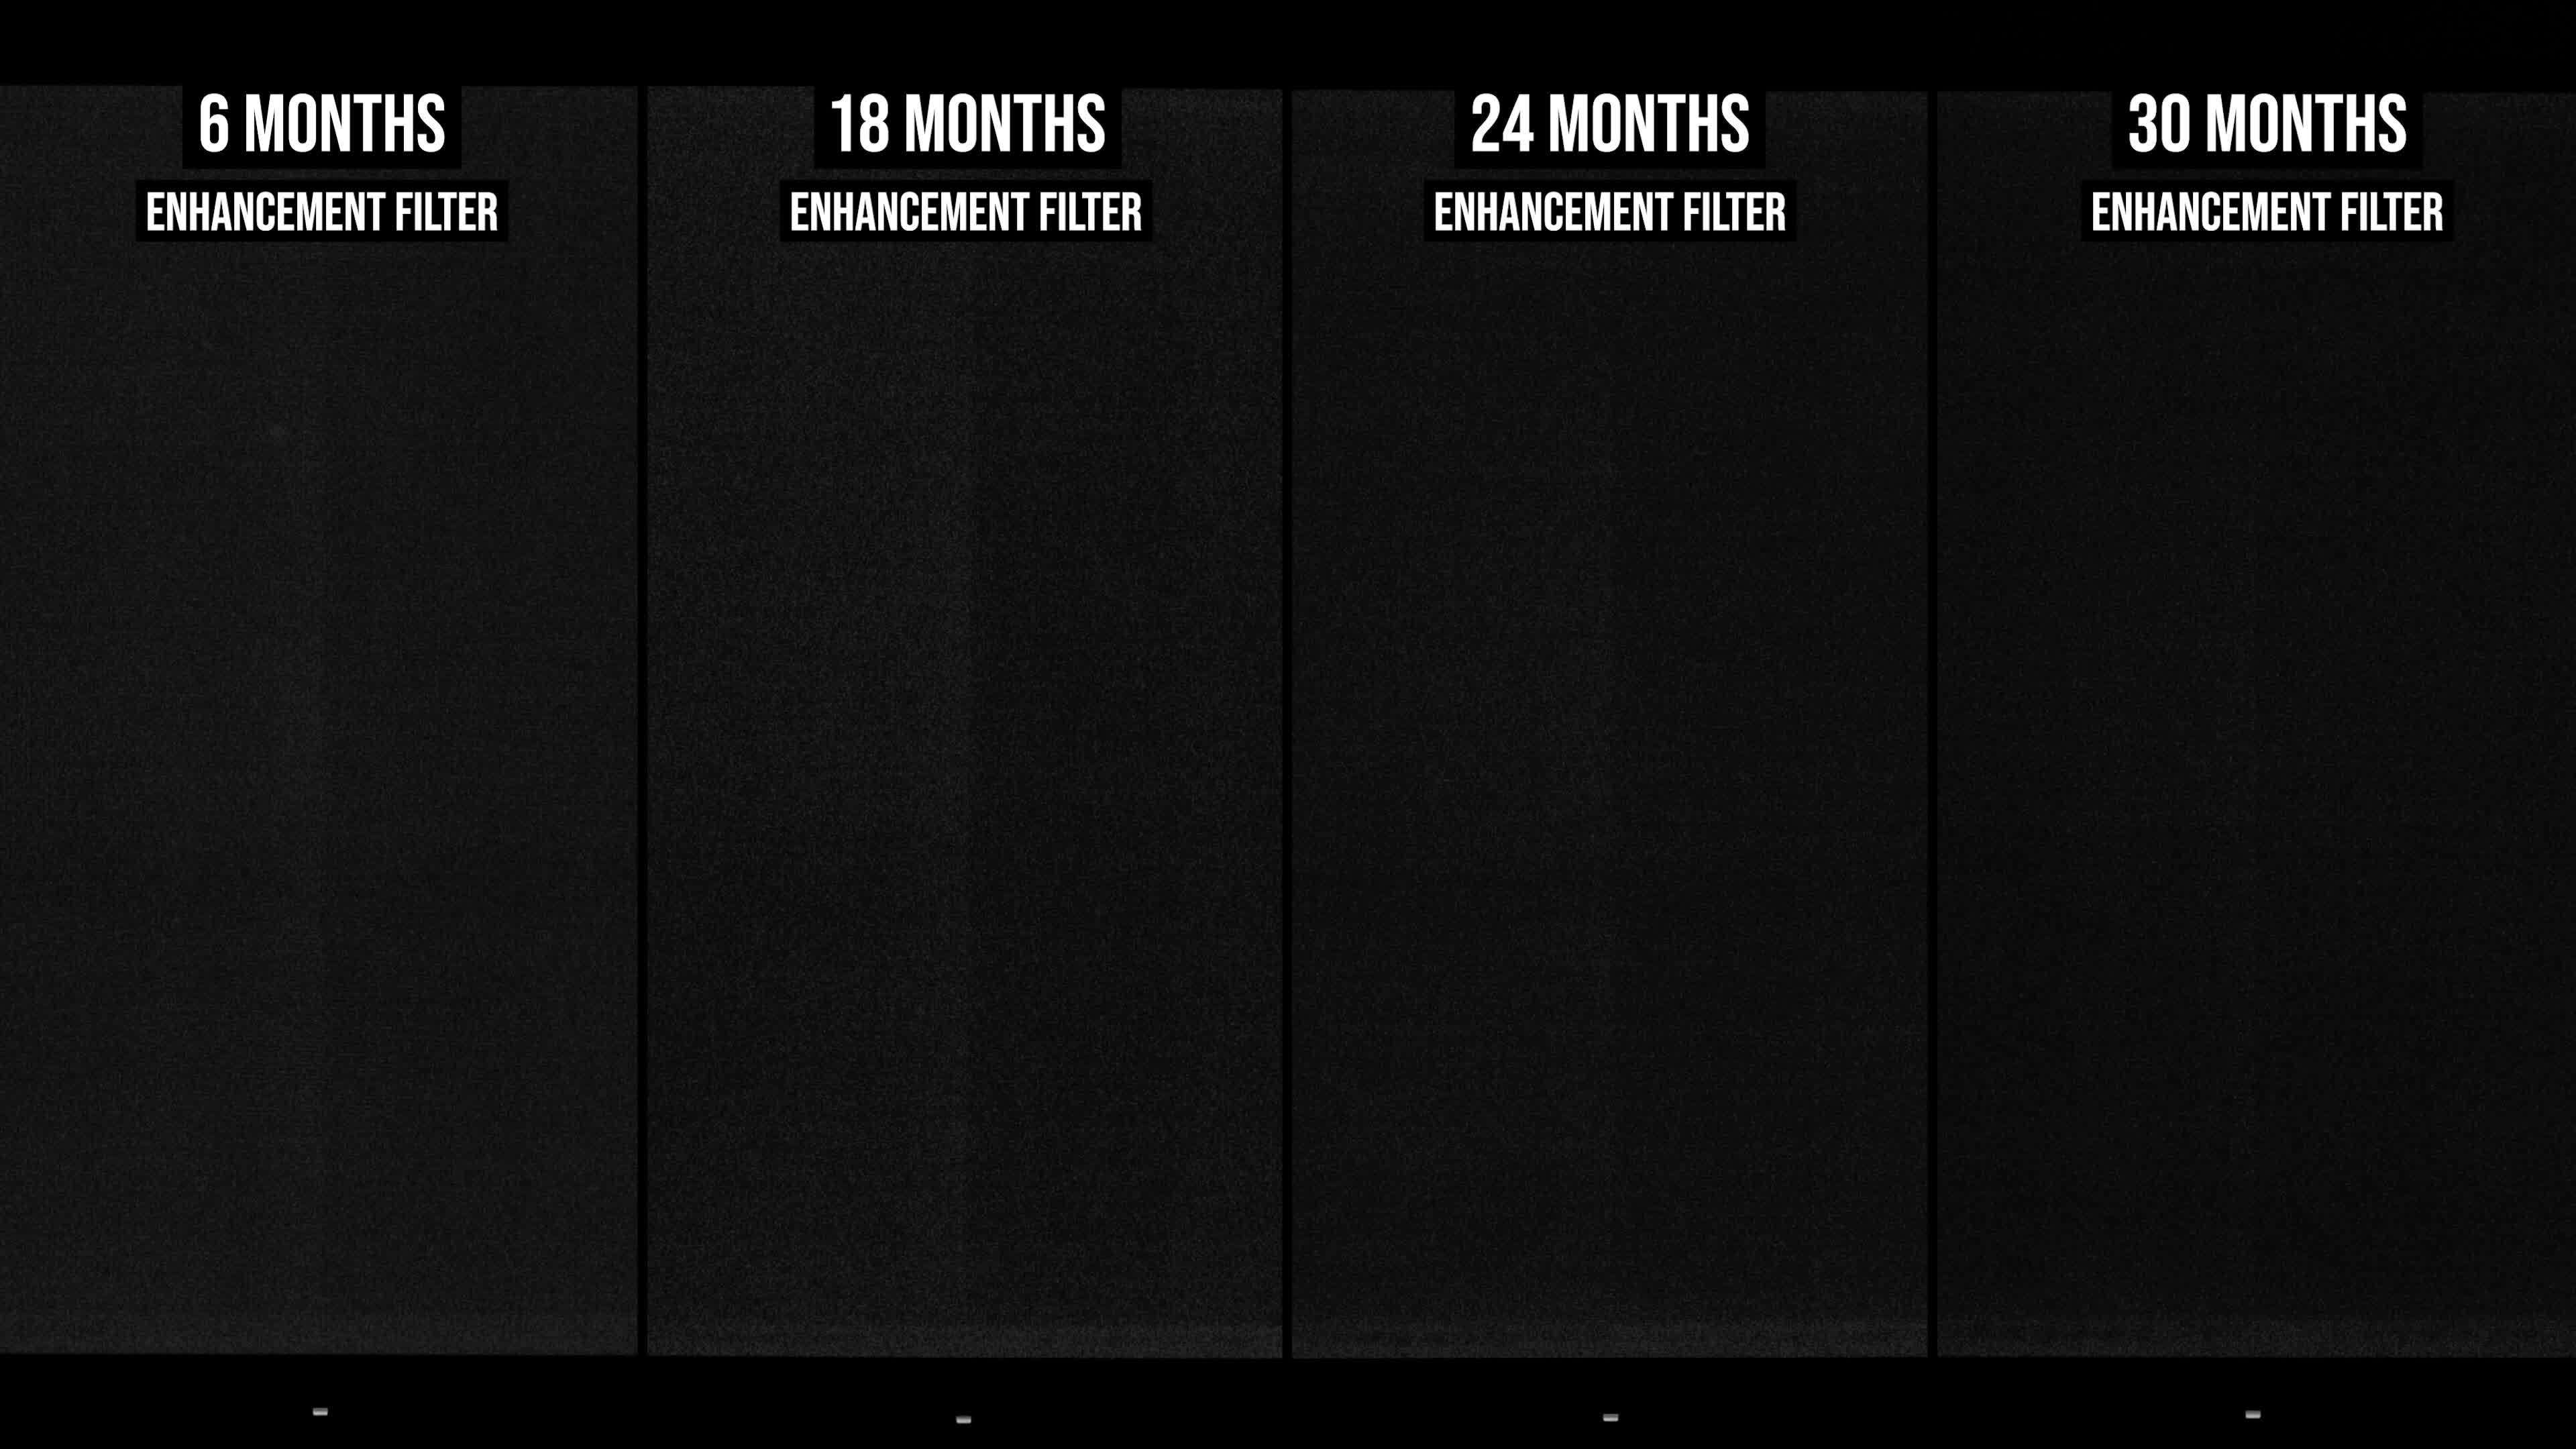
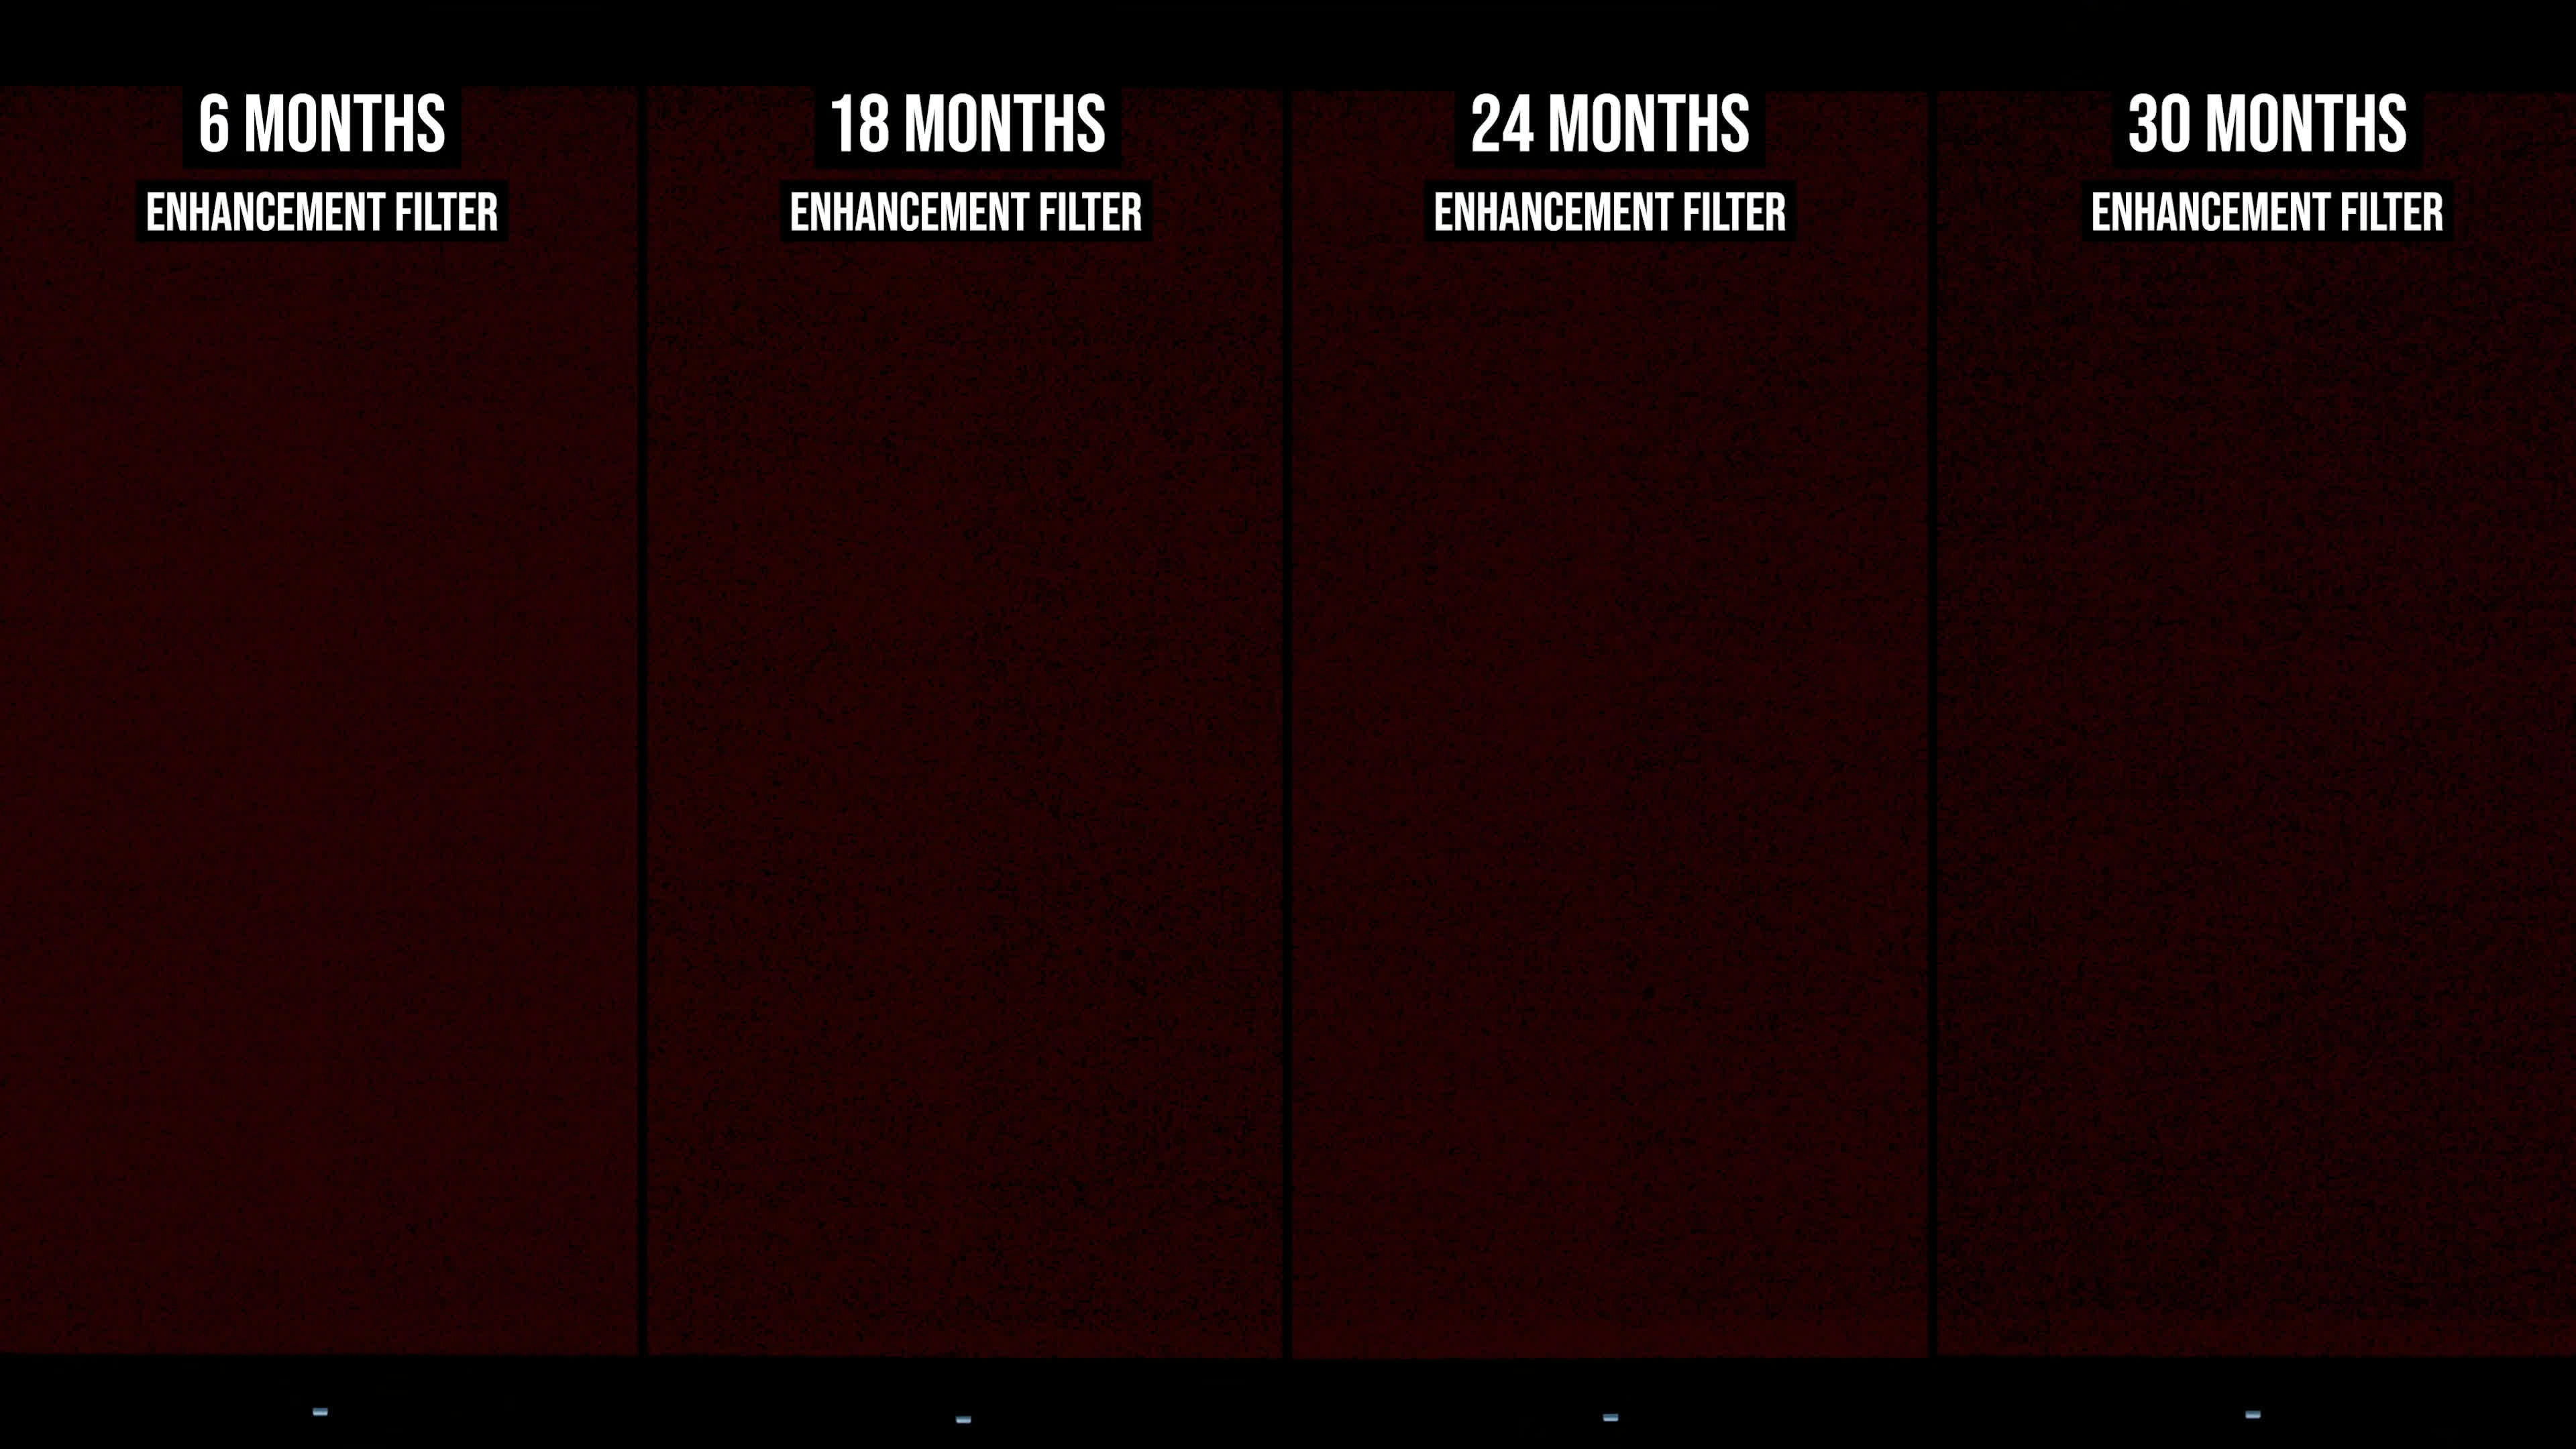
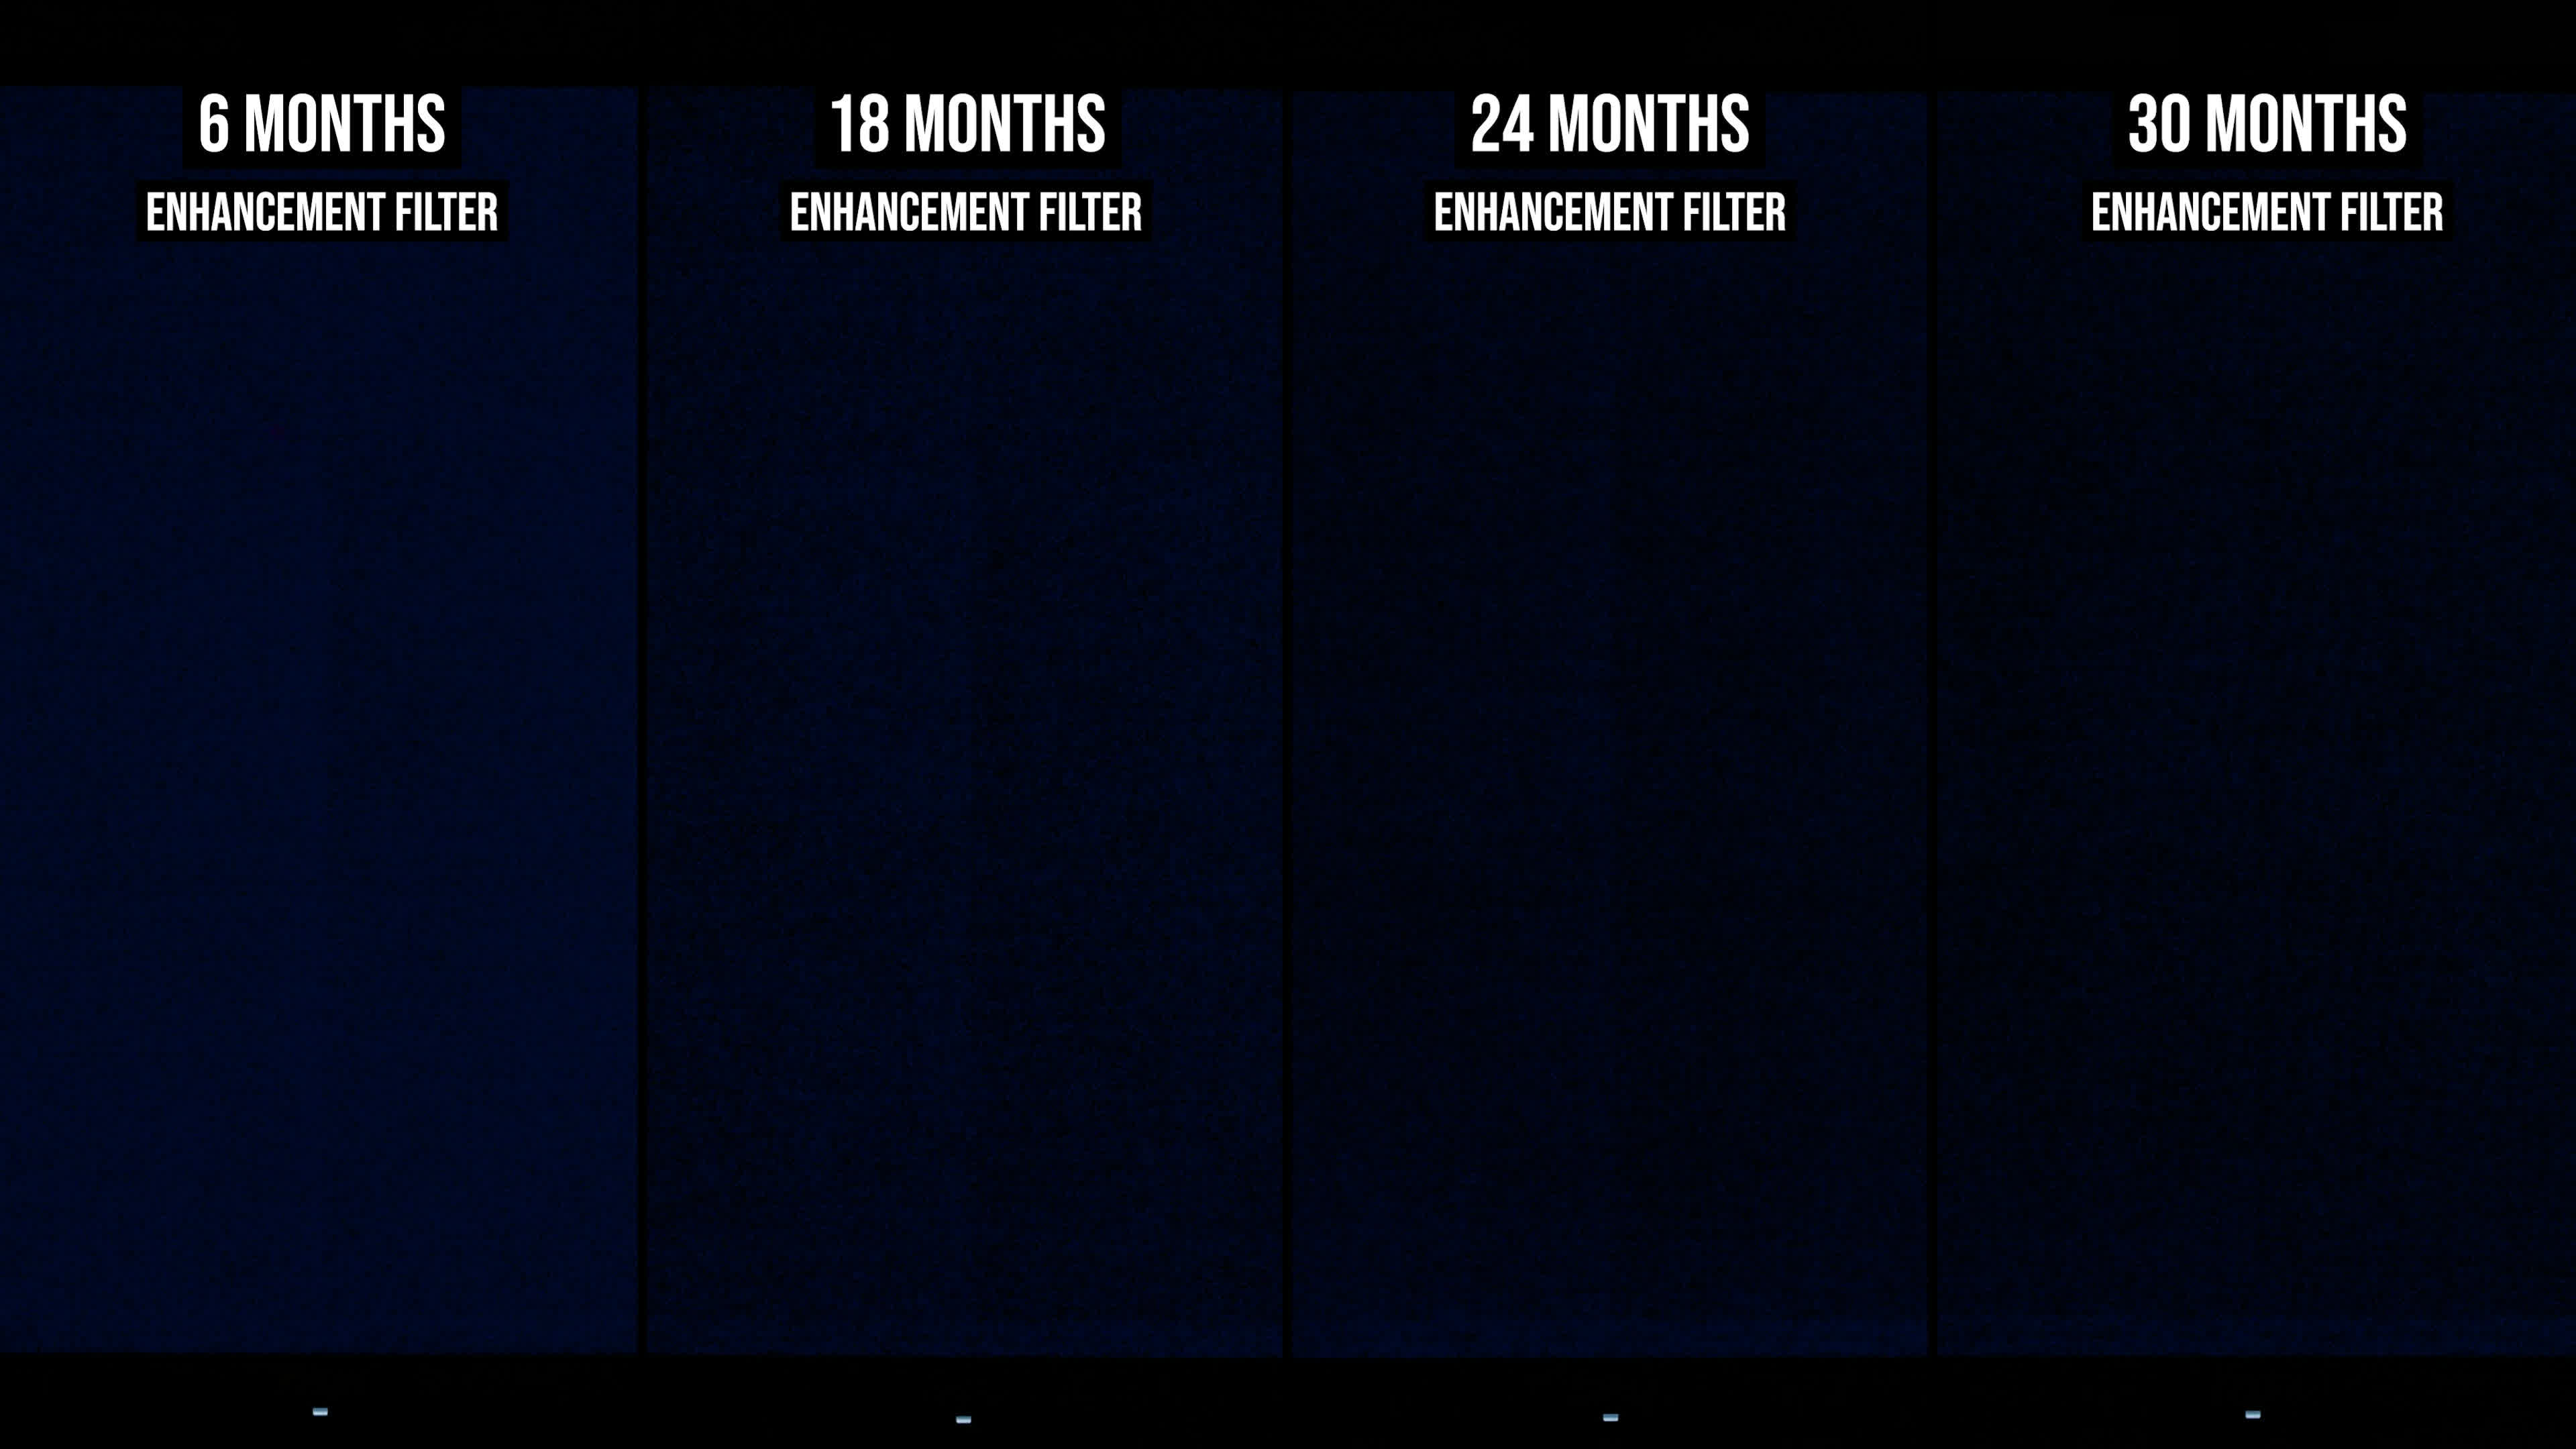
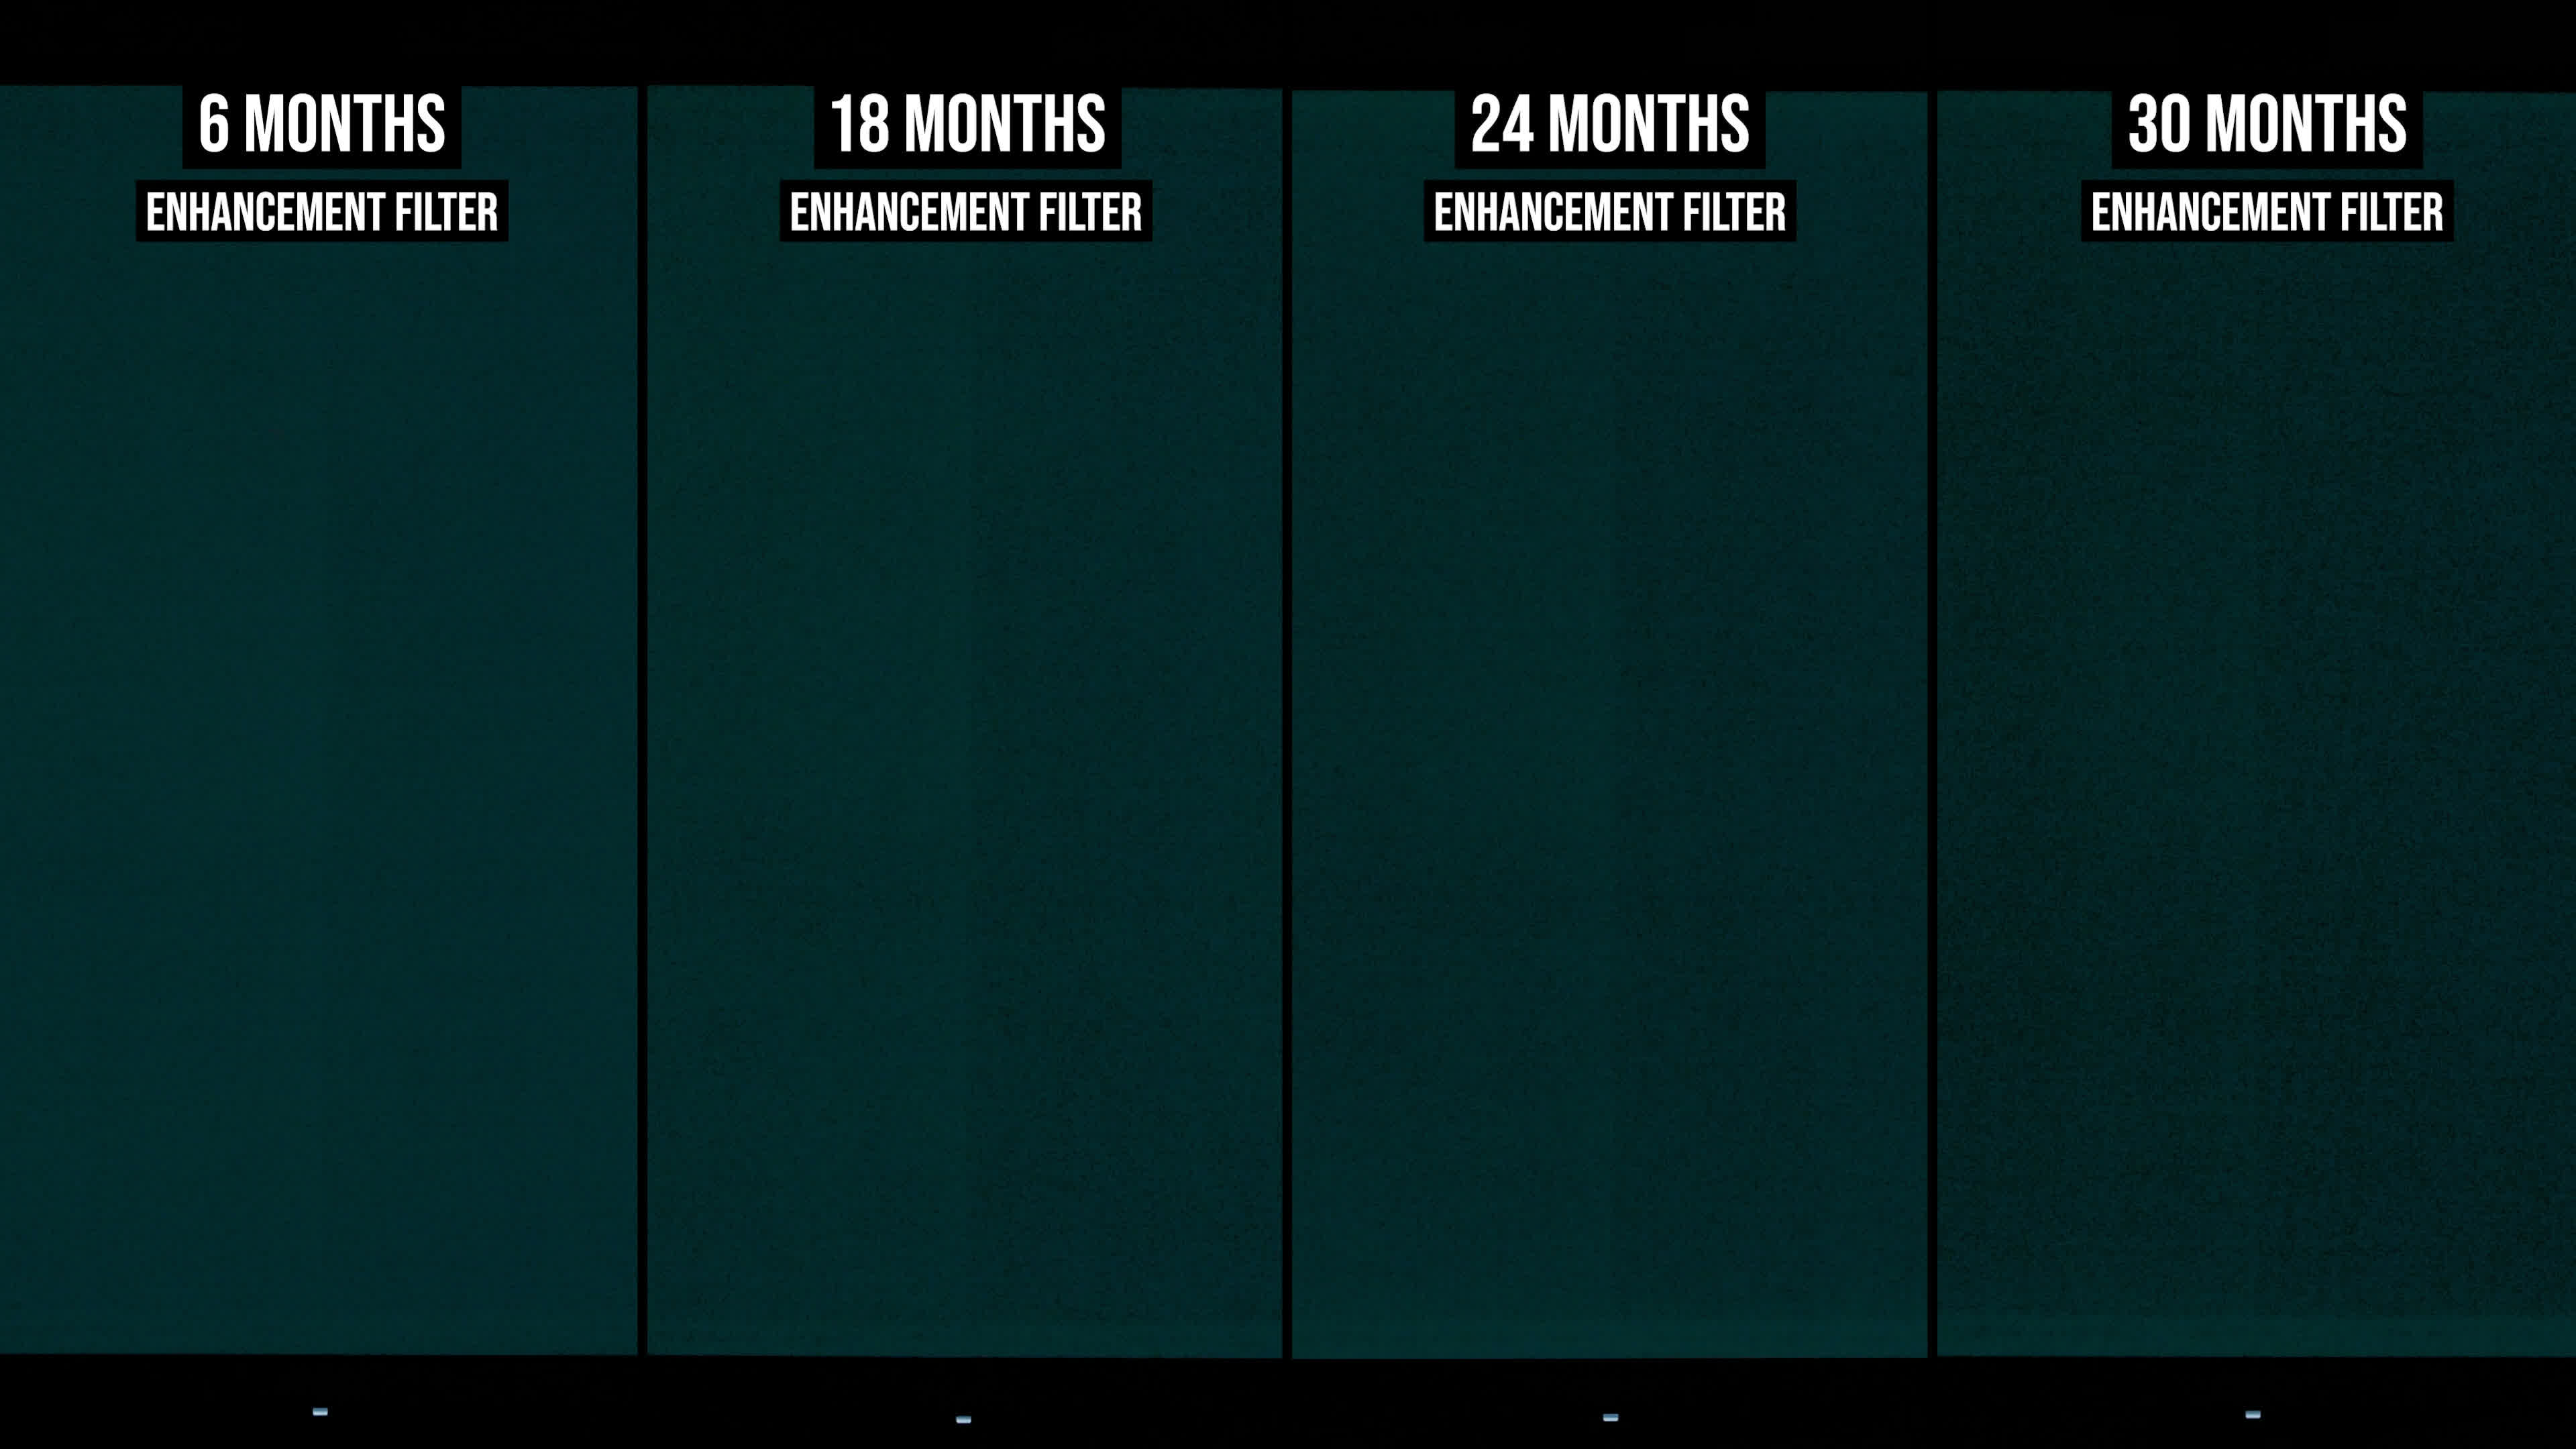
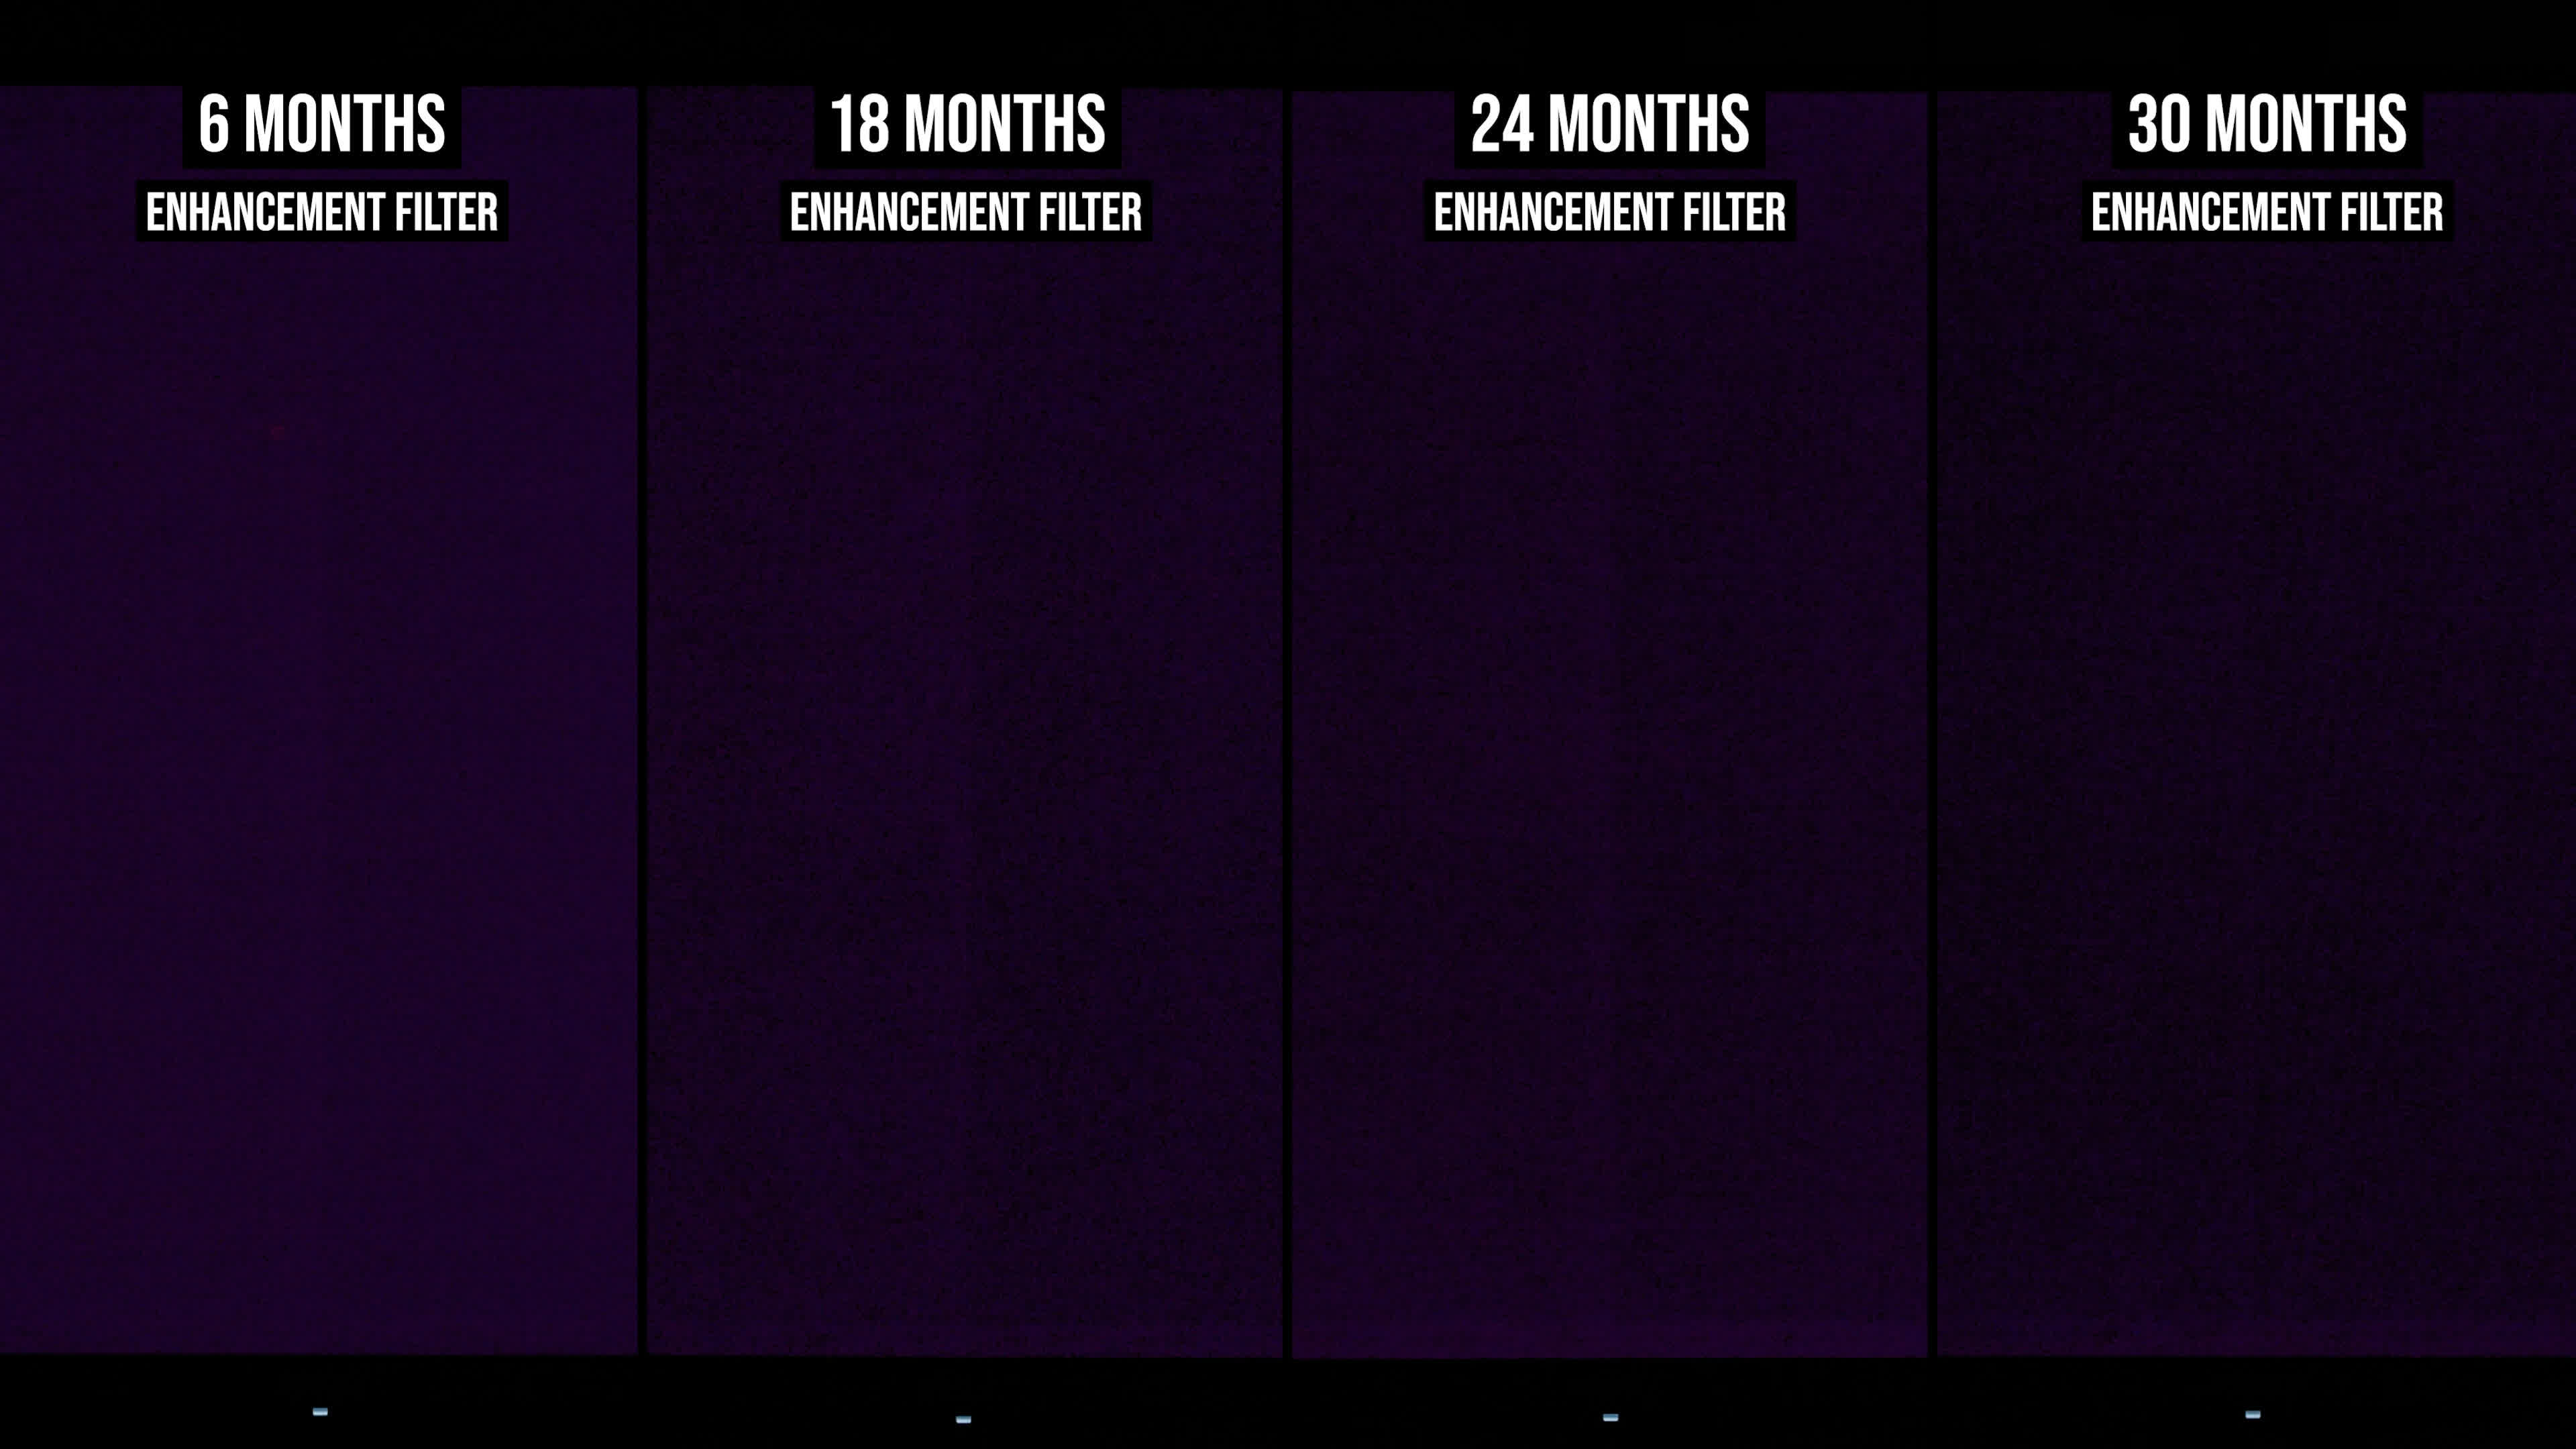
Next up are the color examples, which give us a better look at how the individual subpixels are degrading. The red subpixel has degraded the least. We can spot some issues at 30 months compared with the six-month results, with burn-in first becoming visible at around 15 months into the test. The blue subpixel is the second most degraded, and there's now a fairly clear reduction in output compared with the earlier stages of testing.
Then we have the green subpixel, which shows the most degradation, the most obvious burn-in, and also appears to be aging less evenly than the other subpixels. This specific subpixel seems to be contributing more heavily to the overall burn-in results than the others. As a result, composite colors that include green tend to show more burn-in, while colors that don't activate the green subpixel show noticeably less.
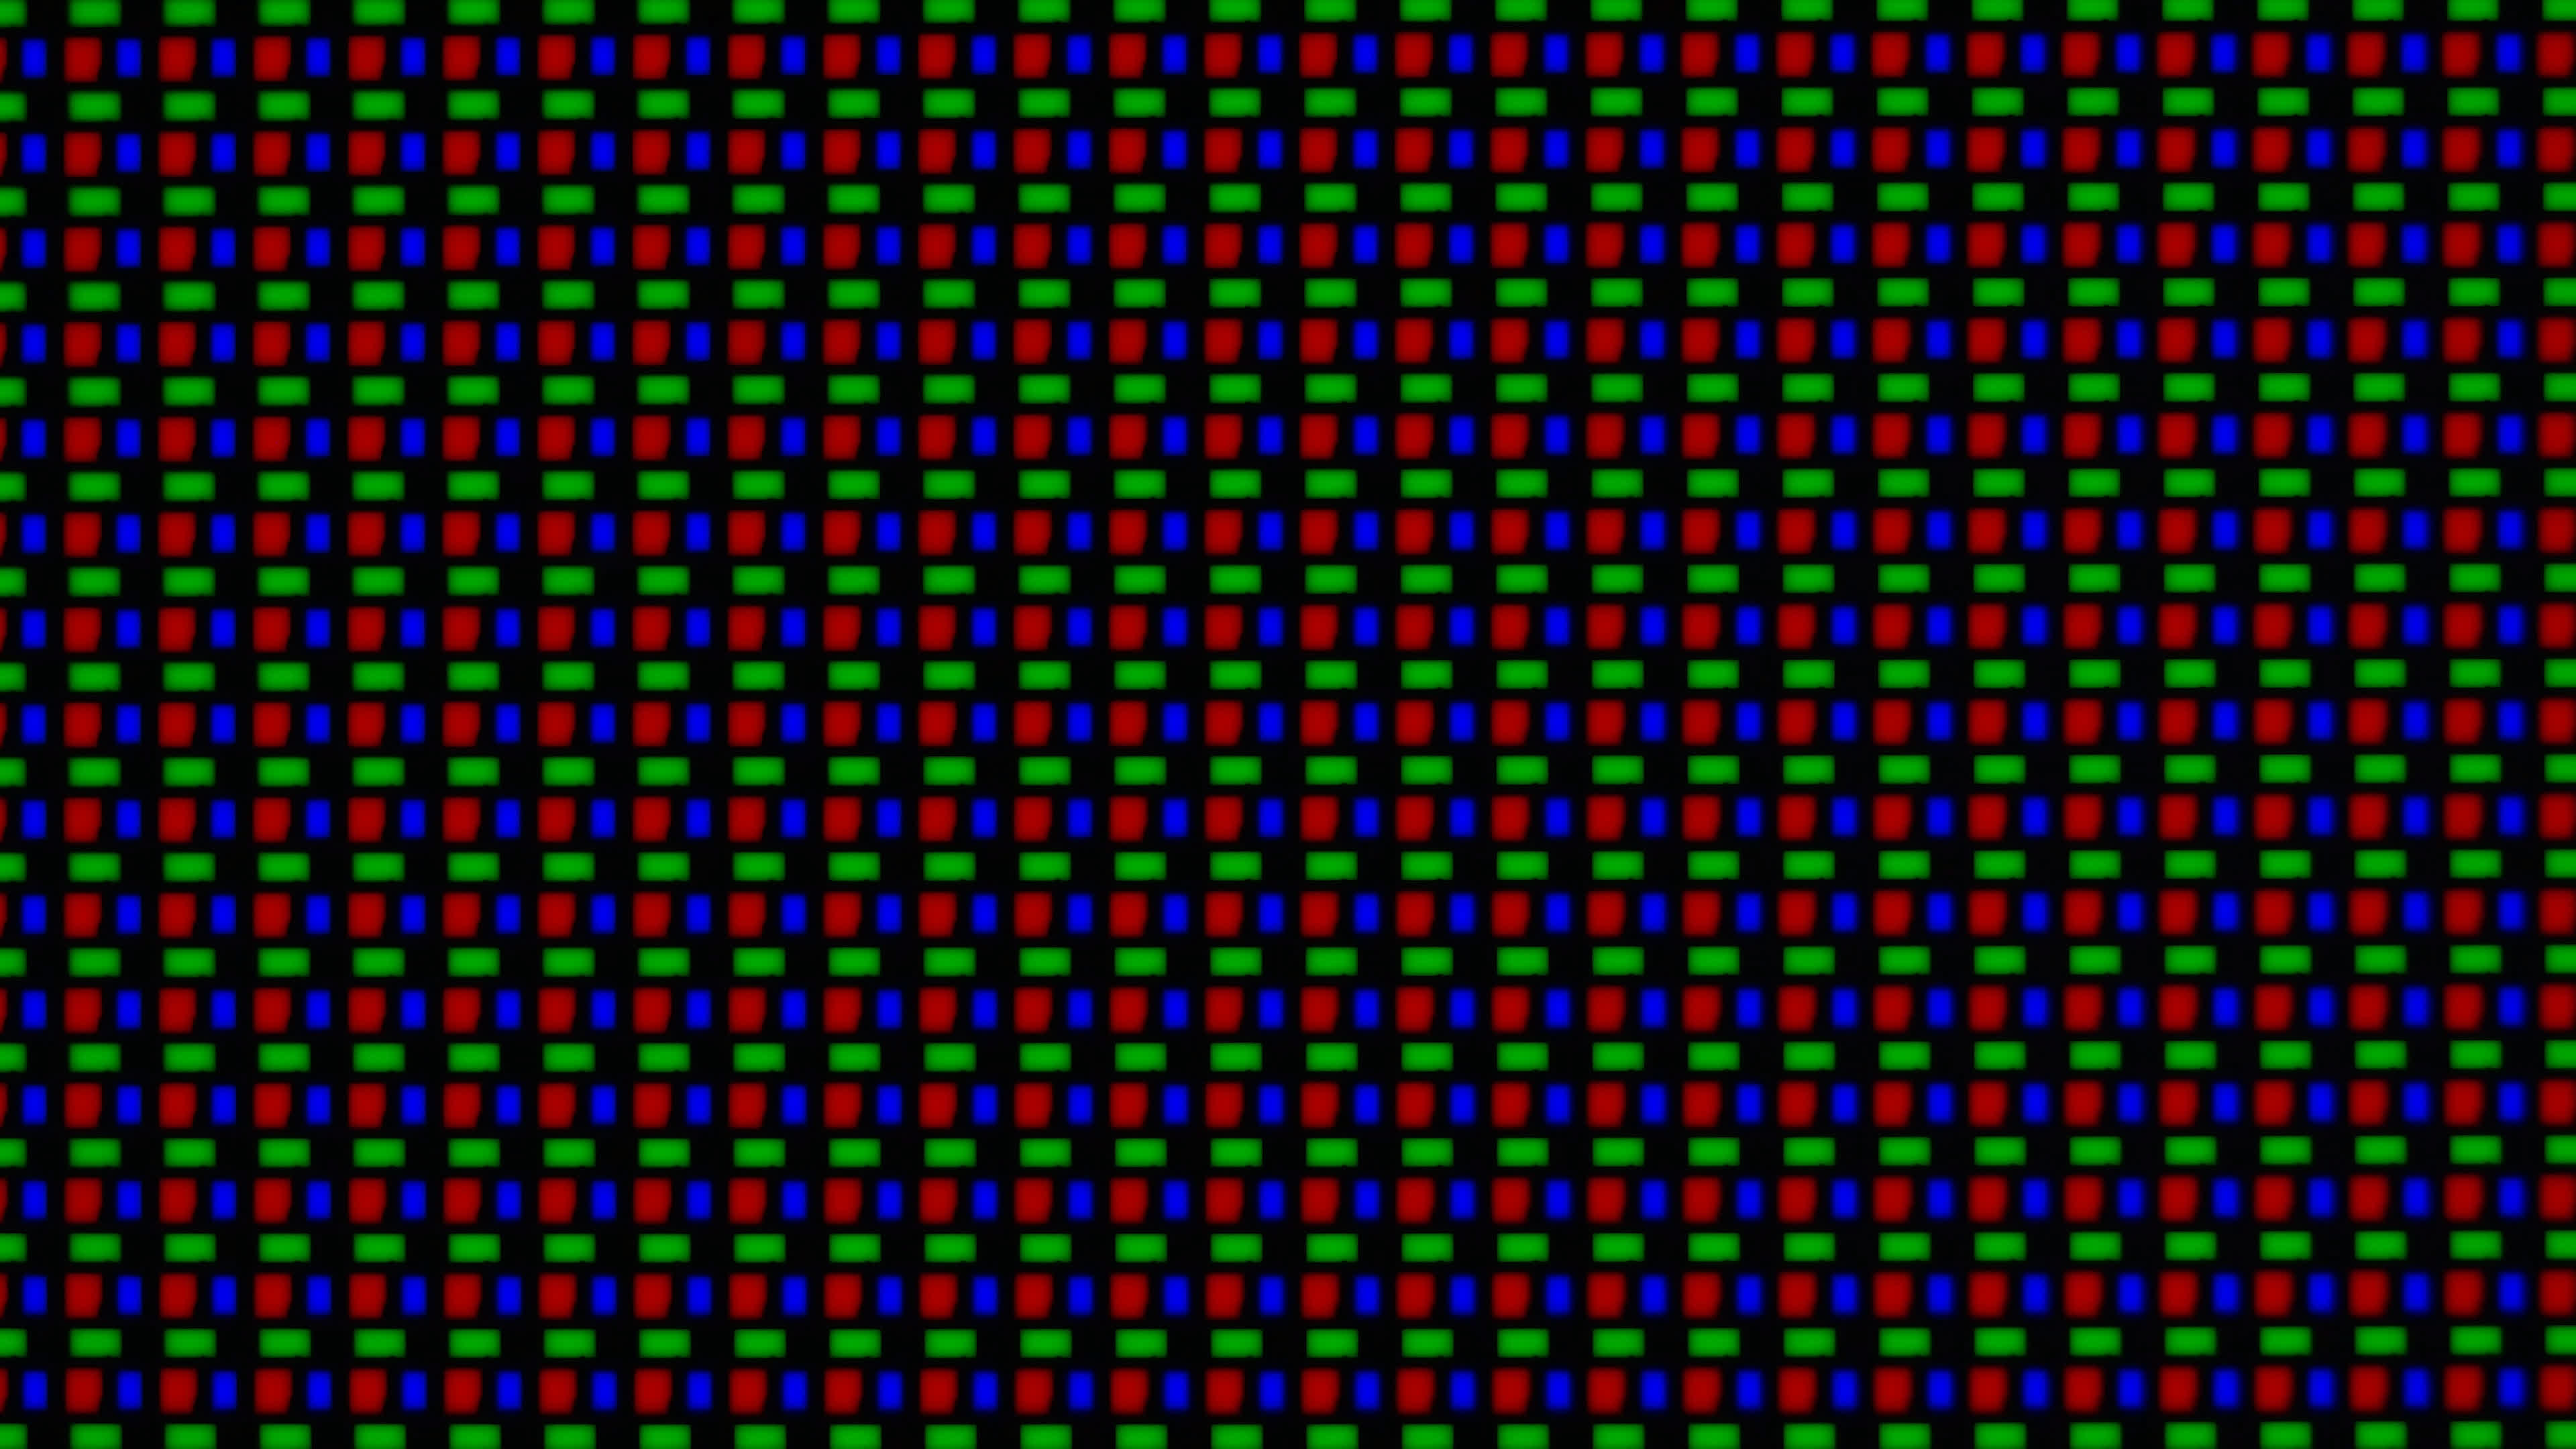
Looking at the physical subpixel layout and sizing, it's not immediately clear why the green subpixel would be degrading faster than the others. On QD-OLED, the emissive layer is the same for all three subpixels despite the sizing differences visible here, with a quantum dot conversion layer transforming blue light into green and red for their respective subpixels.
Uneven aging of the subpixels can also cause the display's color temperature to shift over time, and that's something we've observed throughout this test.
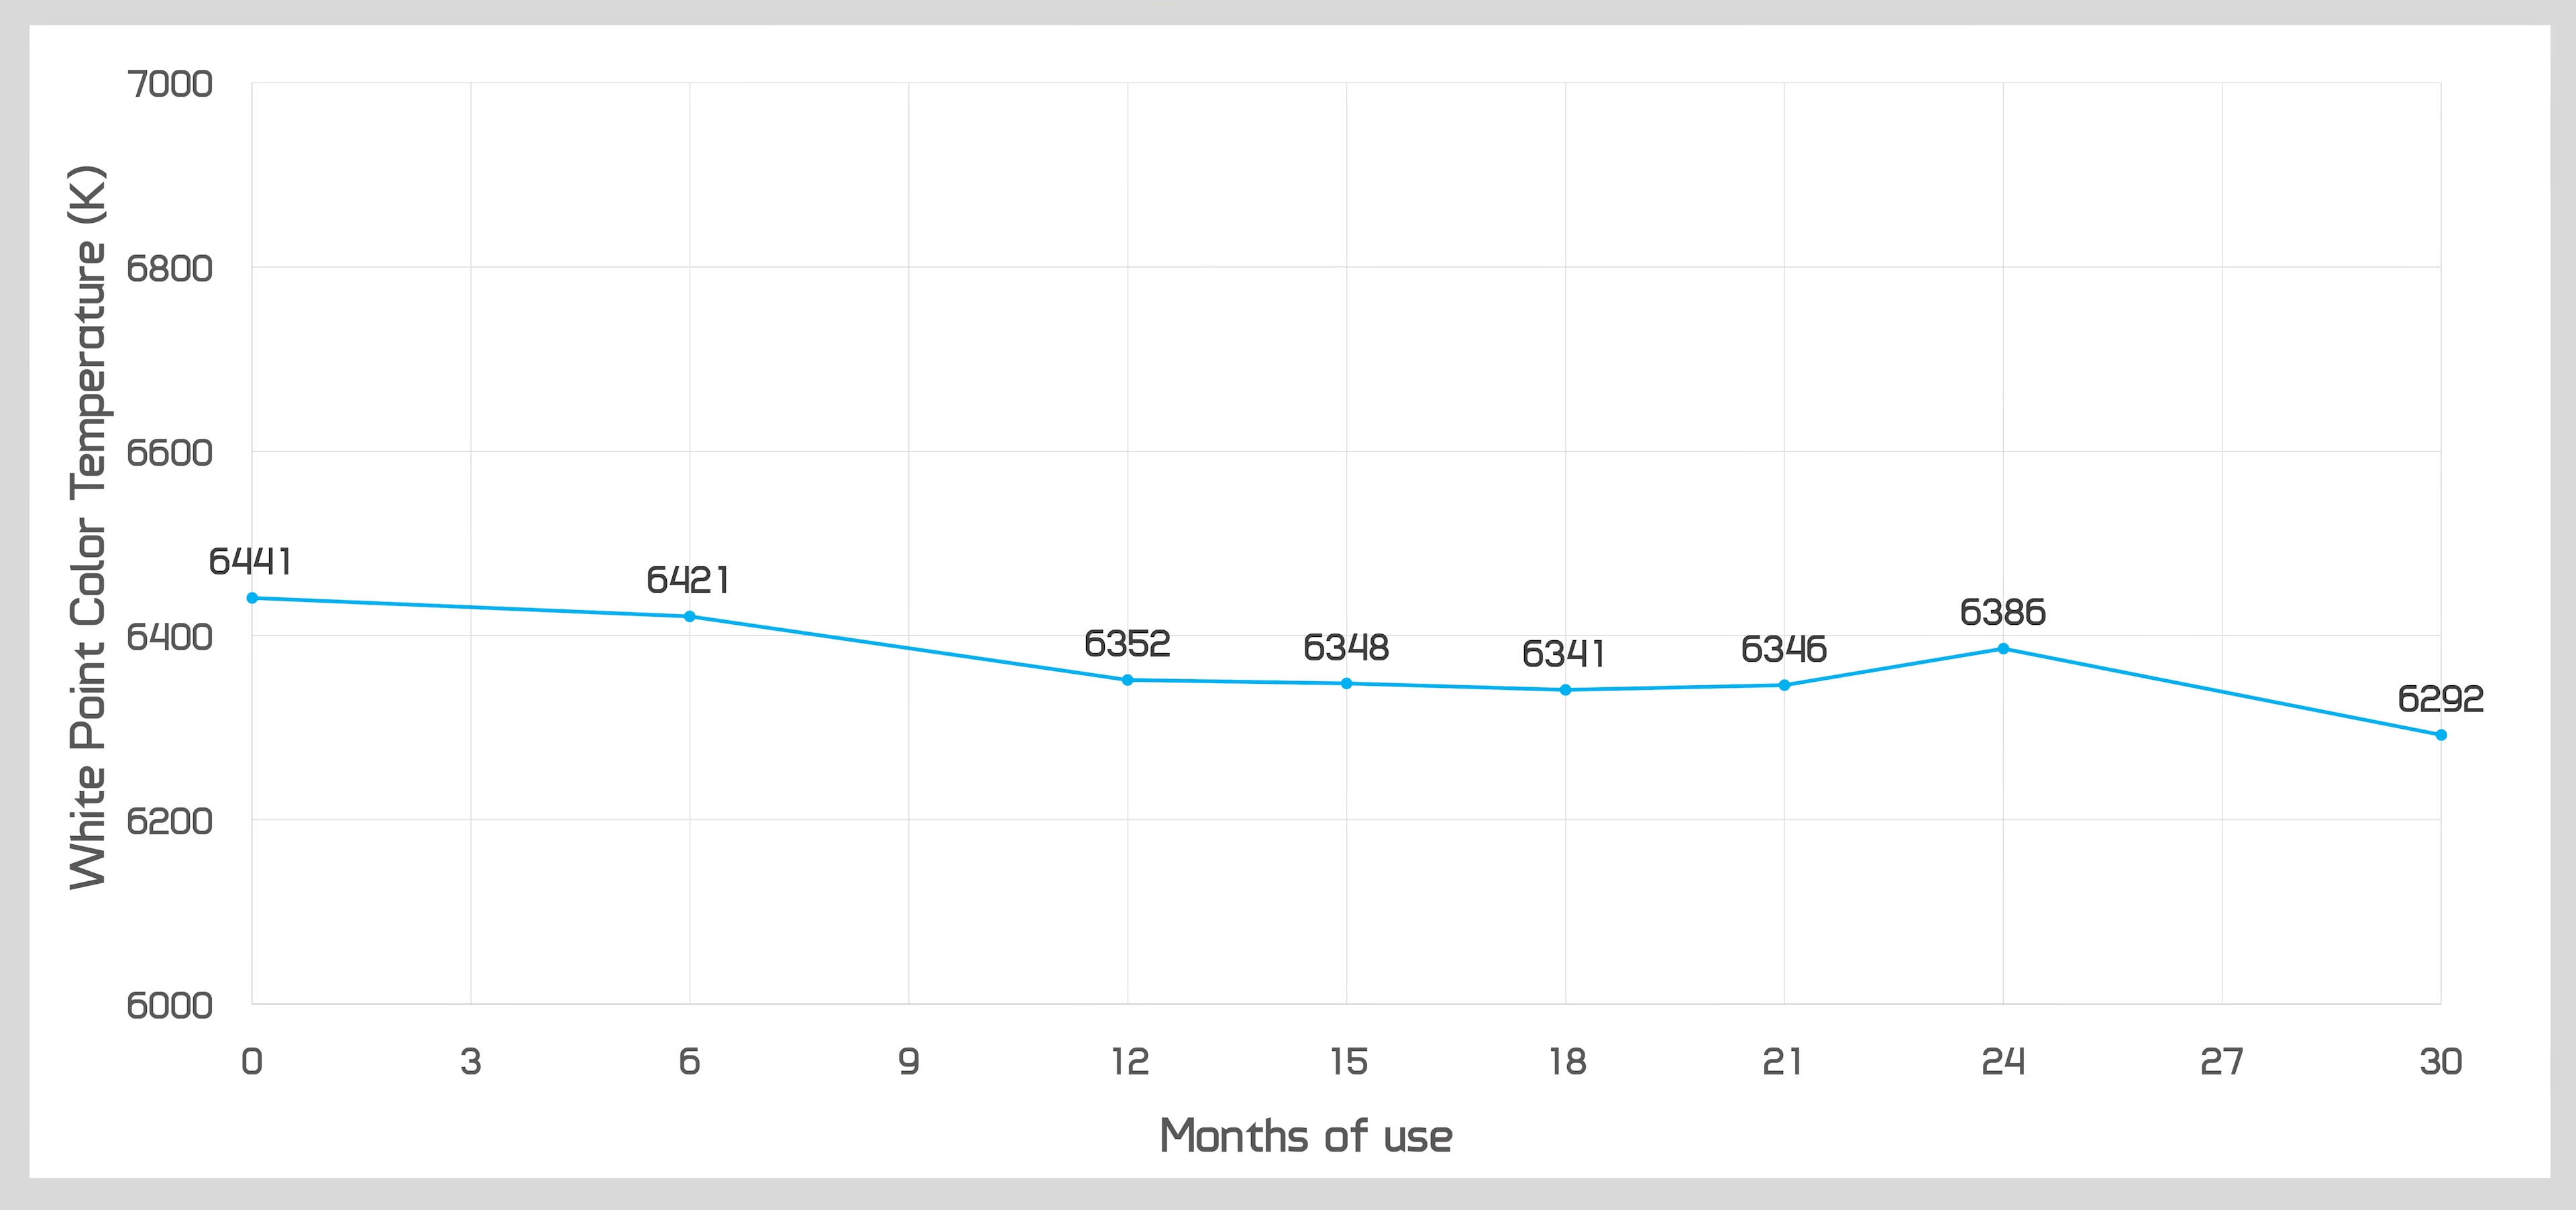
At the 12-month mark, color temperature had noticeably dropped from around 6,440K out of the box to 6,350K. It increased slightly by the 24-month mark compared with some earlier measurements, but has dipped again at 30 months and now sits at 6,292K.
OLED Color Temperature Over Time
MSI MPG 321URX QD-OLED - White Point
That's roughly 150K lower than our original measurement, meaning the display is now slightly warmer than it was when new despite no changes to the settings.
It'll be interesting to see how the color temperature progresses over the next few updates, because for a while seeing virtually no change after 3 months was quite common, but the 30-month result is now the lowest color temperature we've measured yet.
Brightness Loss After 8,000 Hours
There's also a theory that burn-in compensation cycles will reduce peak brightness over time, as they attempt to compensate for uneven wear by causing the entire panel to operate at a lower brightness level.
OLED Peak Brightness Over Time
MSI MPG 321URX QD-OLED - Max Full Screen SDR Brightness
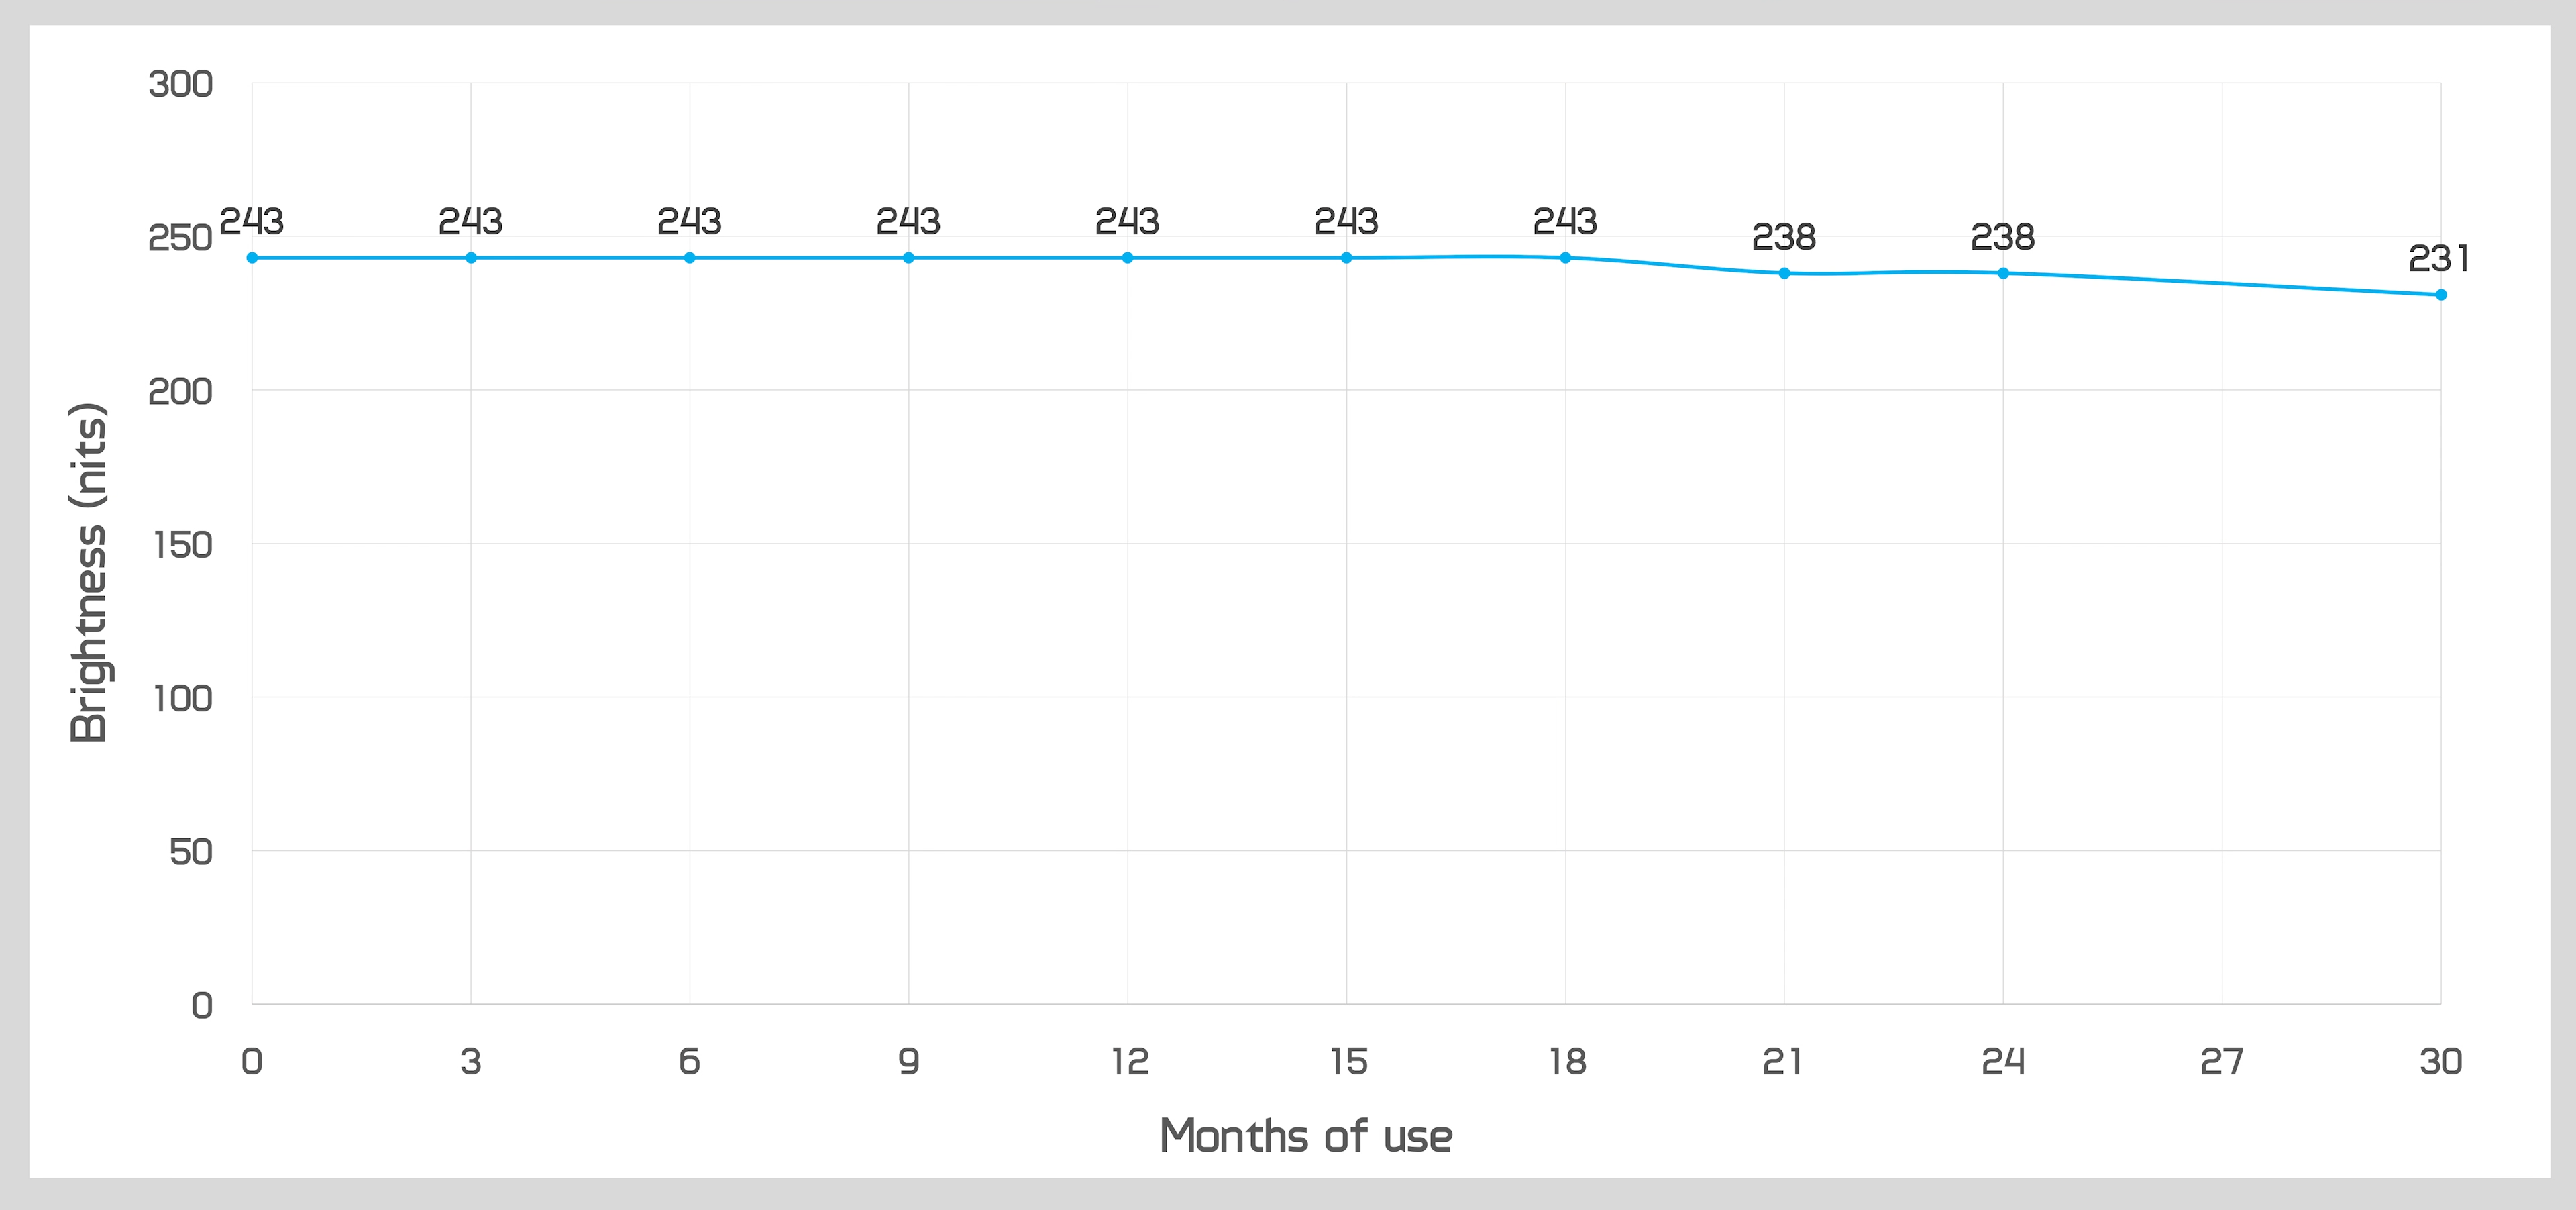
For the first 18 months, we measured precisely zero change in brightness. The monitor started at a peak of 243 nits and remained at 243 nits after all that time. At 21 months, for the first time, we recorded a small drop to 238 nits, and now the panel has fallen further to 231 nits. That's a 5% reduction in peak brightness over the course of 8,000 hours of predominantly static content.
On the surface, that's not too bad. What's slightly concerning, though, is the more recent rate of degradation. The entirety of that brightness loss has occurred within the last 12 months, so another couple of years could produce a more substantial decline. At this point, we think it's safe to say that OLED panel brightness will drop slightly over time as the compensation algorithm attempts to mitigate the effects of burn-in.
Looking at an accelerated time-lapse of the burn-in so far, there's nothing dramatically different from what we saw last time. It provides the usual view of gradual degradation and burn-in accumulating over two and a half years of use. Many of the artifacts were first visible as early as three or six months into the test, while more recently we've started seeing additional issues such as burn-in from the taskbar icons.
Impact on Daily Usage
So how has burn-in affected my actual use of this monitor? If you've been following this series for a while, you've probably heard me say many times that there haven't been substantial changes between individual updates. That's because burn-in progresses too slowly for me to notice major differences from one update to the next.
But over a longer period, the issues and artifacts caused by burn-in continue to accumulate. Every so often, I'll notice something like the line down the center of the screen and be reminded that, yes, I'm using an OLED and it has indeed burned in to some degree.
The line down the center doesn't have much impact during most day-to-day use because I'm typically working with applications side by side, and the line aligns with the split between those windows. It's effectively hidden and doesn't hurt image quality in that situation. But it's certainly noticeable when I switch to full-screen applications with darker backgrounds, such as Photoshop and Premiere.
It would obviously be nice to have a pristine, burn-in-free screen, but that's no longer the case.
In fact, the line is more noticeable than ever and is approaching the point of being genuinely annoying, especially given that I've now been seeing this artifact for quite some time. It would obviously be nice to have a pristine, burn-in-free screen, but that's no longer the case.
The taskbar burn-in, including the visible traces of some application icons, has had little to no impact so far. I almost always use the monitor with the taskbar visible, which effectively hides the damage because the same static elements that caused the burn-in are still being displayed in those locations.
I'm sure this will eventually become more noticeable with full-screen content, but so far I'm not particularly concerned about it. I'm also not seeing any other significant burn-in artifacts. No application toolbars or other interface elements have burned in yet. At this stage, the main issues remain the vertical line down the center and the taskbar.
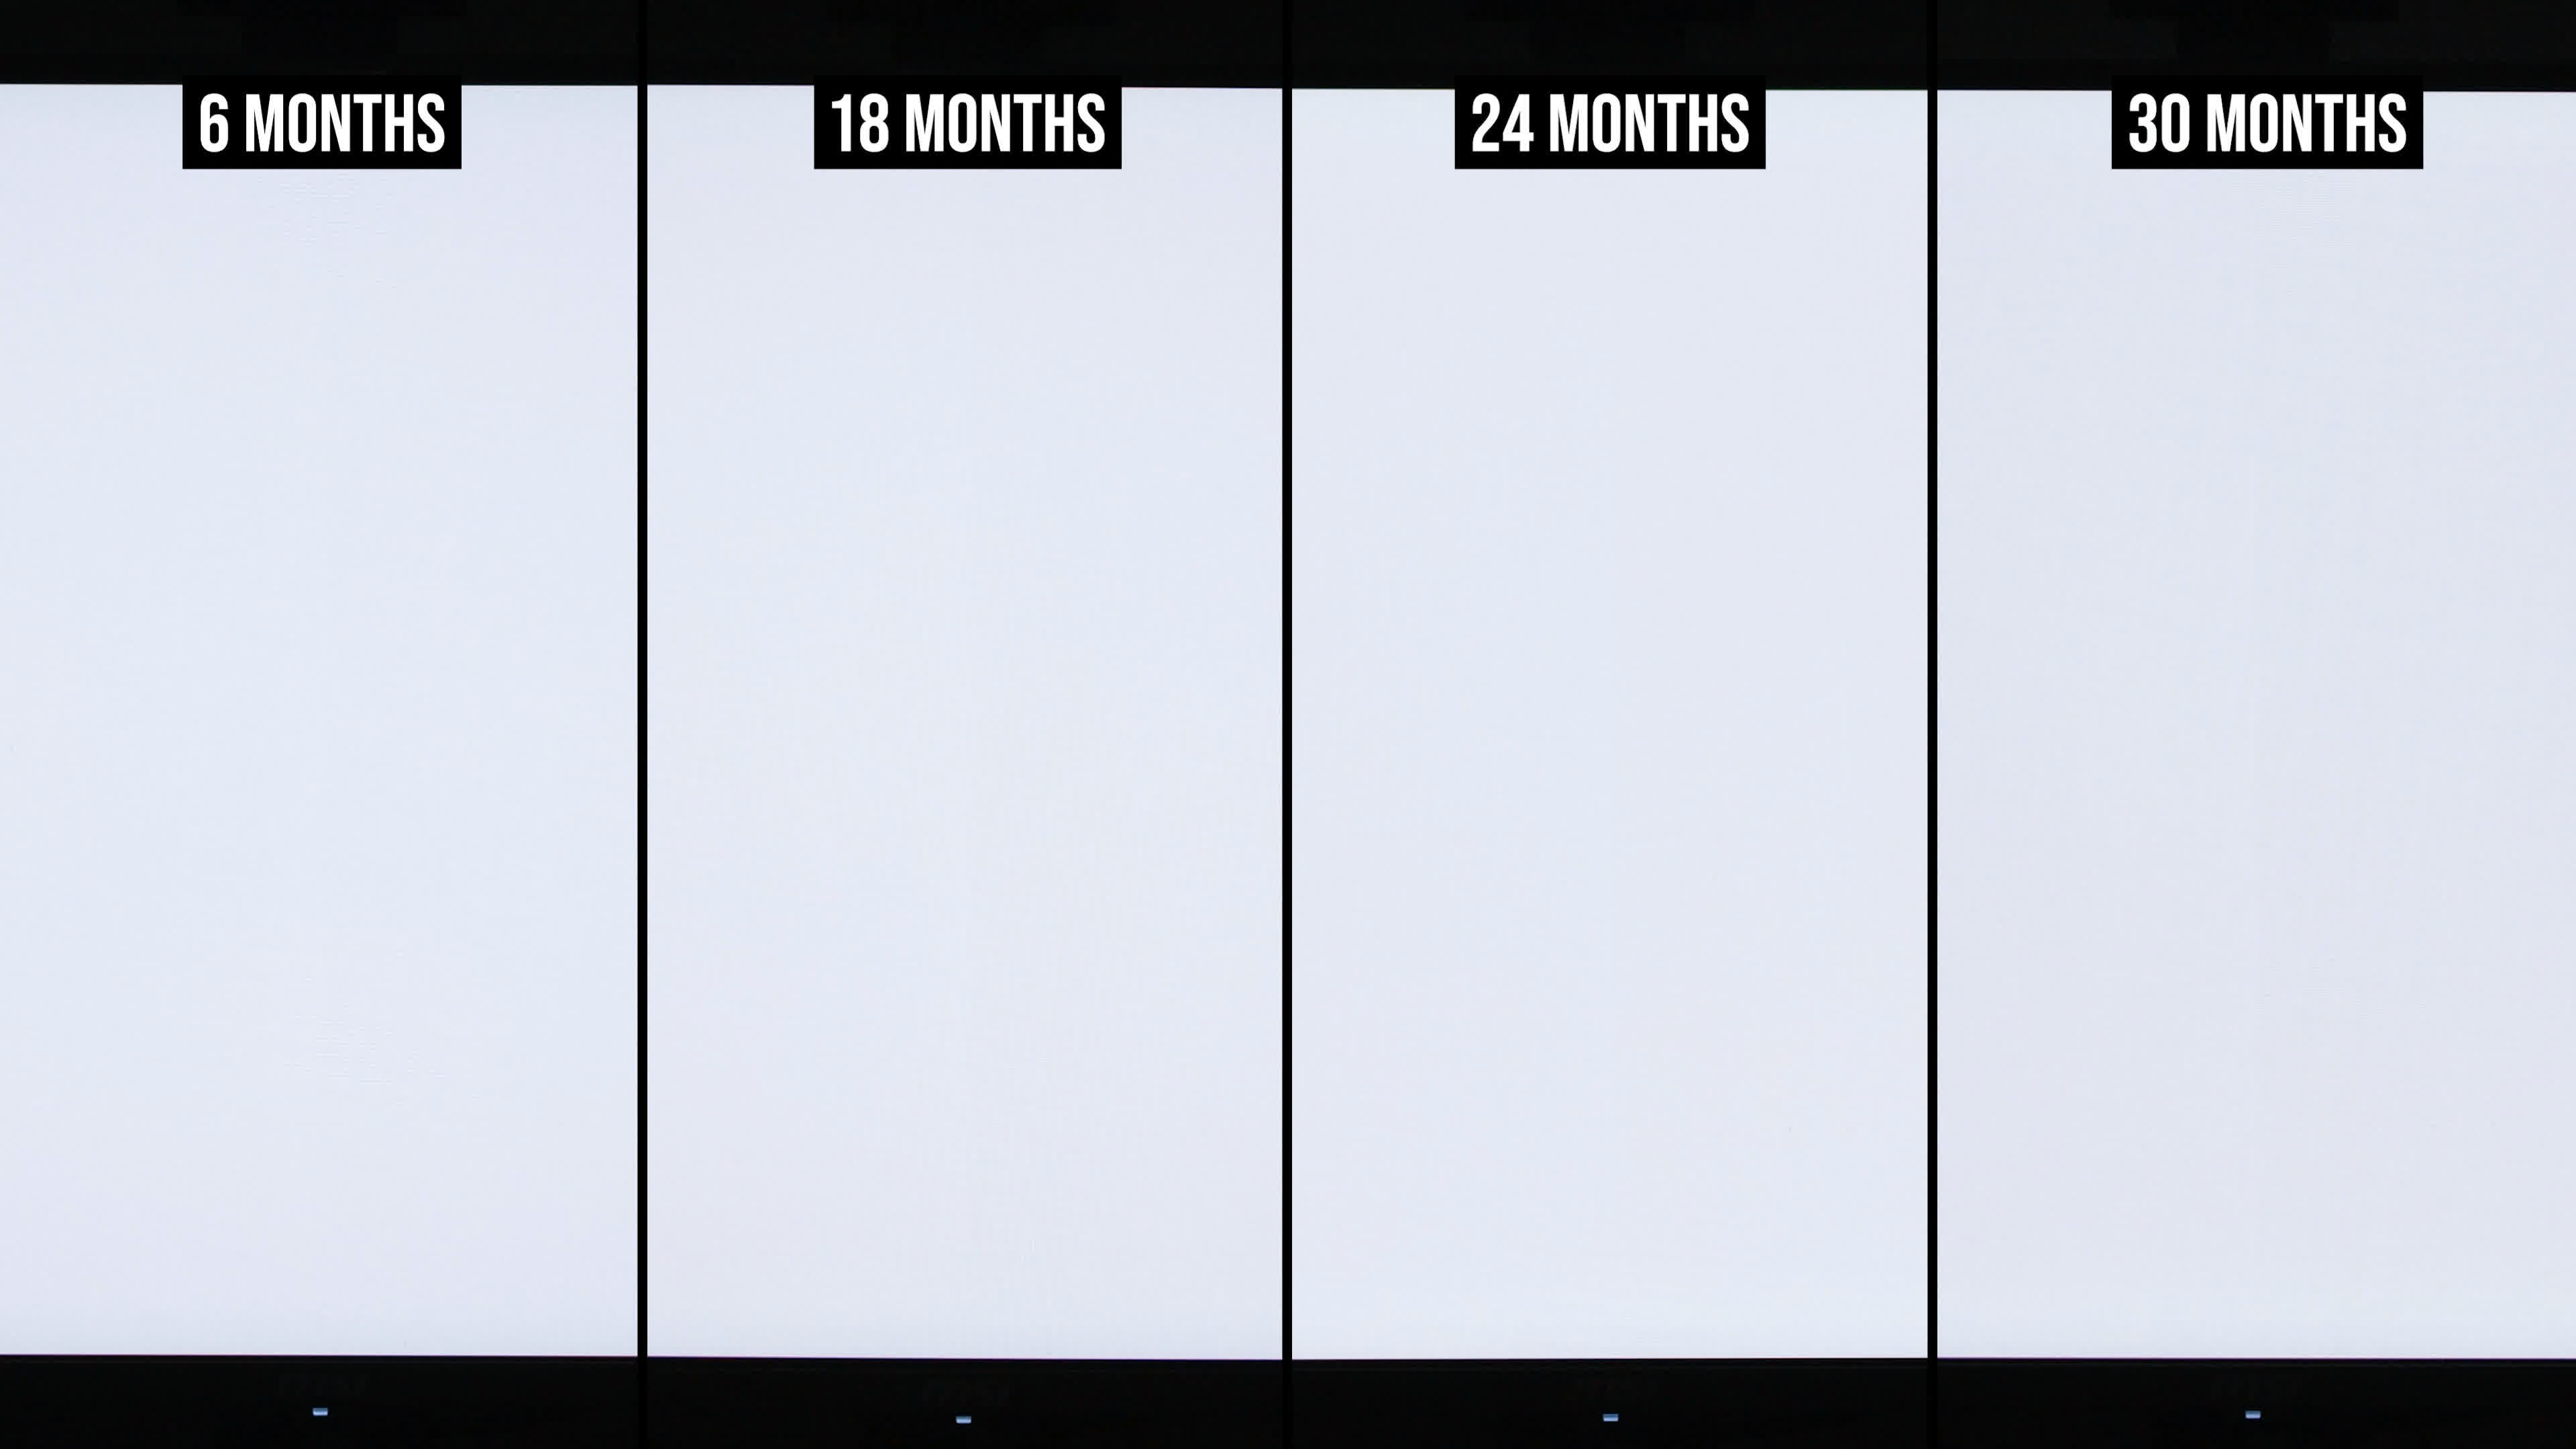
What I have noticed for the first time in this update is that the line down the center is now faintly visible even on a full-screen 100% white image. Previously, I'd only noticed it on various medium-to-dark gray backgrounds, but it's now faintly present in essentially all conditions. That's not ideal, but it doesn't make the screen unusable. I still think we're some way from this panel being completely ruined by burn-in.
As you can see from the results without the burn-in enhancement filter, the artifacts remain relatively faint. They're visible, but not overwhelmingly so.
As always, it's important to remember that we're burning this screen in on purpose. We're taking no meaningful steps to prevent burn-in and are deliberately using the monitor in a worst-case scenario, including extensive use of light-mode applications. Using an OLED in a more sensible way will extend its lifespan, and it's also possible that newer monitors with improvements to their emissive layers and panel technology will perform better in terms of burn-in resistance.
With 8,000 hours of use, these results are roughly equivalent to four years of productivity use at a standard 40-hour work week. In a more part-time work environment, what we're showing here could easily represent five or six years of usage.
That's because burn-in is cumulative and directly related to how many hours the display spends showing the same static content. If you use static applications for only four hours a day instead of eight, you'd expect the same amount of cumulative wear to take roughly twice as long to occur.
This testing has also revealed a few practical ways to reduce burn-in. One of the main reasons we're seeing these artifacts is uneven wear. The taskbar is dark, while the applications we use every day are predominantly light. We'd recommend using a similar brightness level across applications, taskbars, and navigation bars, such as through a universal dark mode. This should help the panel age more evenly. Had we done that from the beginning, we suspect these burn-in artifacts would be less noticeable.
The other obvious measure is simply using the screen less when you don't need it. We don't bother switching the monitor off whenever it's sitting unused, but doing so would extend its lifespan. This could be handled with a shorter screensaver timer or putting the monitor to sleep after say, five minutes. Some newer monitors come with presence-detection capabilities, too, to help with this.
Lastly, if you're using your display primarily for content consumption like gaming or watching videos, or even if you have a relatively mixed workload combining light productivity with gaming, we wouldn't be particularly worried about burn-in.
A couple of hours of web browsing here and there combined with gaming is unlikely to produce a significant level of burn-in within a reasonable period, based on what we're seeing from this testing. The main scenario that requires caution is heavy use of static applications, especially productivity workloads running for many hours every day.
For most buyers, we still don't think OLED burn-in should be a major concern. We'll be back in a few months with another update and more burn-in testing.