Application optimization and hardware utilization shouldn't be ambiguous. Nsight Graphics offers an unparalleled level of access into the performance markers of your graphics API – an invaluable aid in finding optimization opportunities that couldn't be identified without looking under the GPU's hood.
Debug graphics
Nsight Graphics is the cornerstone of smooth development on NVIDIA platforms. Identify bugs and trace them back to their source on the target application. At its most granular, Nsight Graphics lets developers inspect every individual event involved in generating a frame – down to the pixel.
Boost ray tracing
Ray-tracing debugging in Nsight Graphics enables the next generation of real-time rendering technology, improving acceleration-structure efficiency and optimizing axis-aligned bounding boxes (AABBs), build flags, and overlaps. The entire frame can be thoroughly examined to ensure the best image fidelity and frame performance.
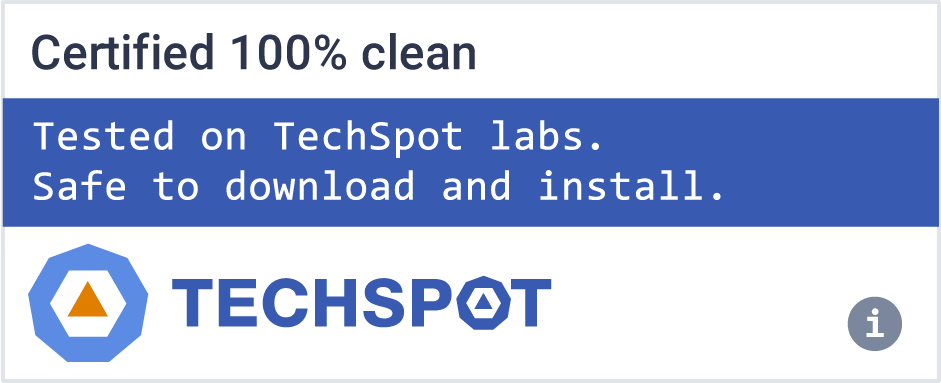
Track GPU performance
Analyze GPU throughput and utilization with minimal overhead for non-biased activity data. On the captured timeline, drill down into critical performance markers and inspect hardware unit throughputs, cache hit rates, memory throughput, and more.
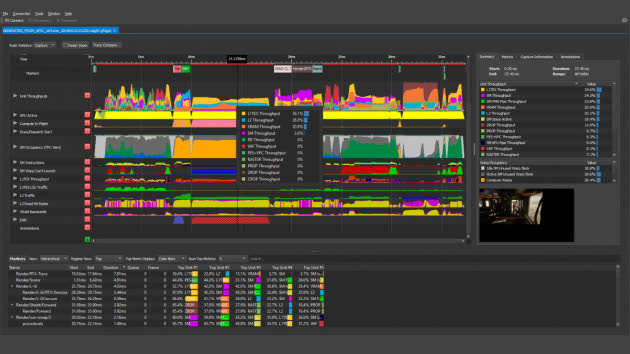
Analyze GPU traces
Nsight Graphics supports automated performance analysis on captured GPU traces. Deep profiling of streaming multiprocessor (SM) performance is accomplished by automatically tracing the execution of shaders across a series of frames.
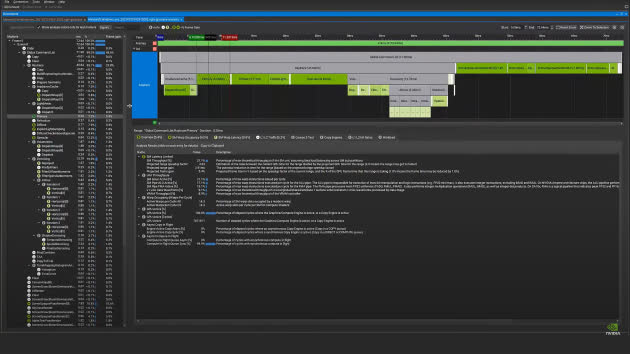
Debug ray tracing pipelines
Debug ray-tracing API calls and examine their state. Ray-tracing specific tools, like the Acceleration Structure Viewer, ease common pain points of developing ray-traced applications. Ensure ray-traversal speeds are high and eliminate unnecessary performance hindrances.
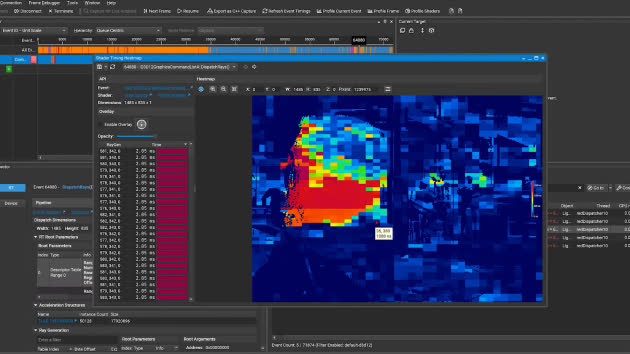
Profile ray tracing shaders
Profiling ray-tracing shaders can be an arduous task that requires extensive knowledge of the GPU. The Nsight Graphics Shader Profiler exposes shader data, including stalls and the reasons they occurred. For an even more immediate approach, the shader timing heatmap visualizes hotspots – overlaid on the scene itself – where shader times lagged per pixel. These features turn ray-tracing profiling into a highly streamlined and intuitive process.
Export C++ capture
Create a self-contained C++ project that allows for frame analysis in a reduced CPU-load scenario. This lets you perform repeatable and isolated analysis without being bound to the original application and provides a protected environment for experimenting with optimization tweaks.