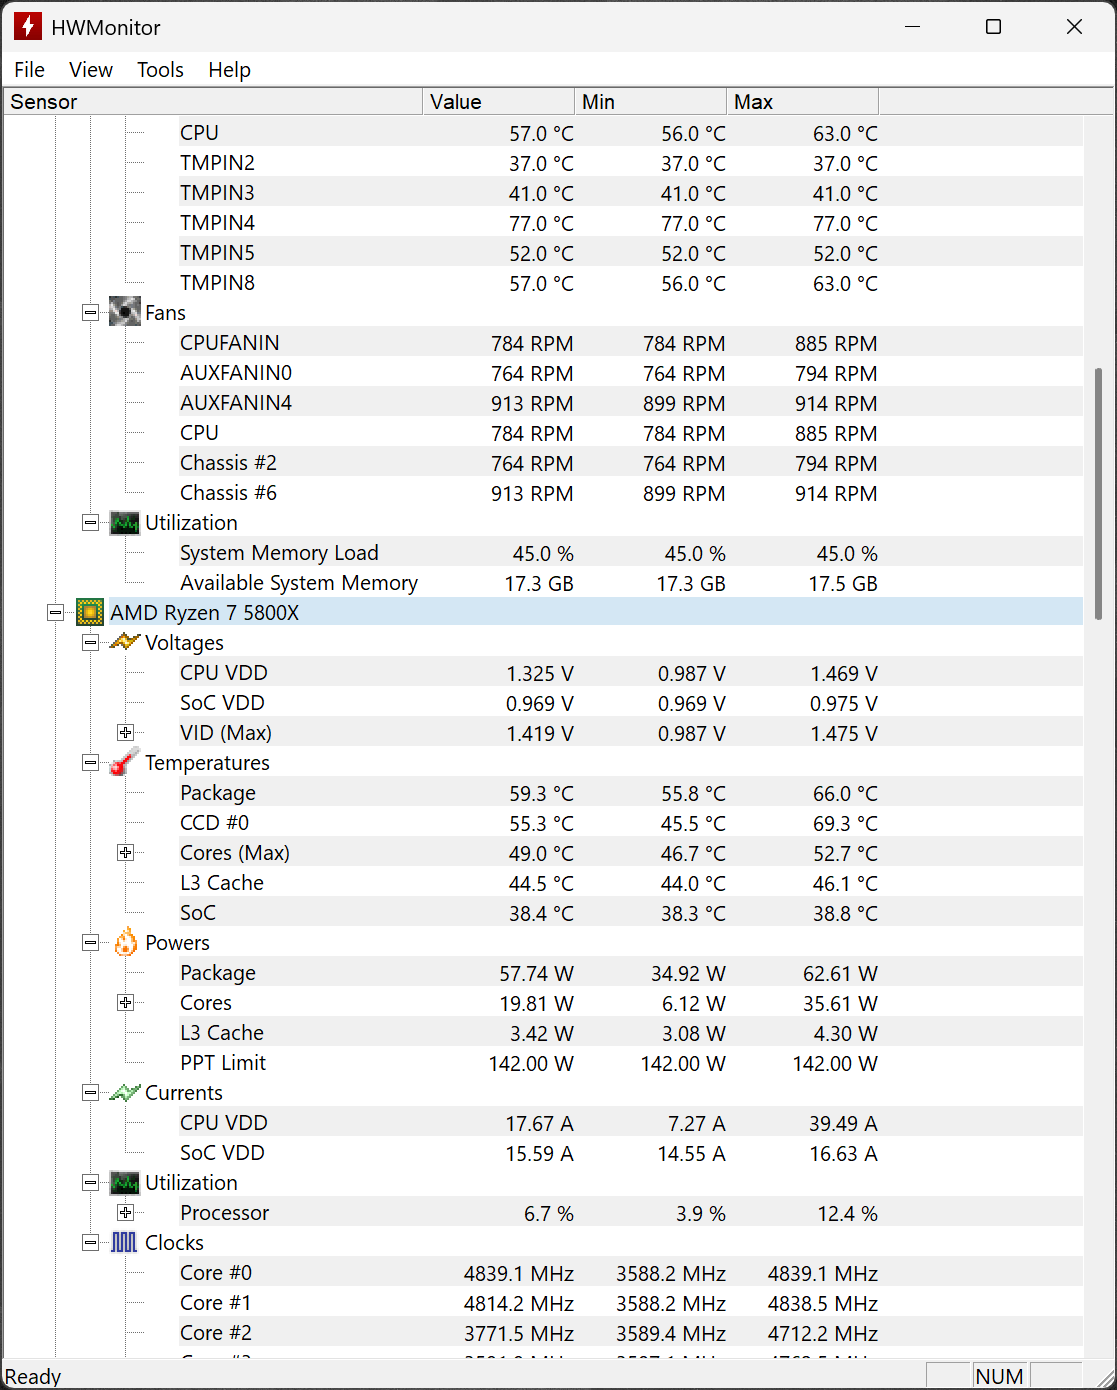
HWMonitor is a lightweight hardware monitoring program that reads your system's main health sensors. It provides real-time data on voltages, temperatures, fan speeds, and power consumption for CPUs, GPUs, motherboards, storage devices, and more.
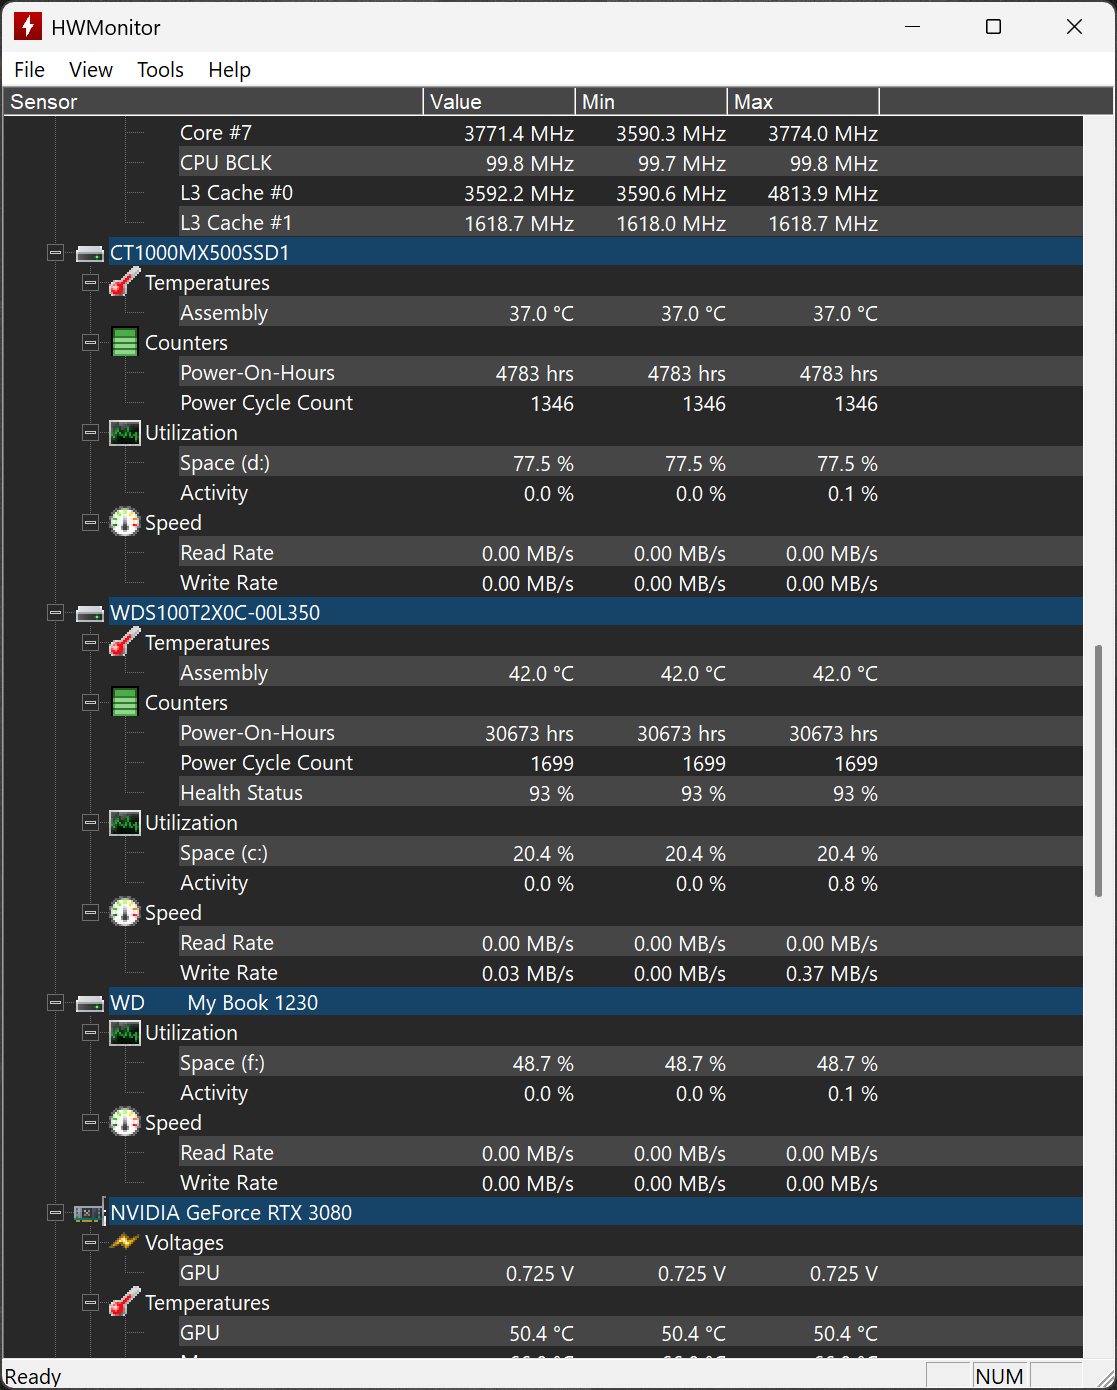
Whether you're troubleshooting, stress testing, or just keeping an eye on system health, HWMonitor delivers clear and reliable metrics in a simple interface. Ideal for PC enthusiasts, overclockers, and tech professionals. The program handles the most common sensor chips, like ITE IT87 series, most Winbond ICs, and others. In addition, it can read modern CPUs on-die core thermal sensors, as well has hard drives temperature via S.M.A.R.T, and GPU temperature.
Why does HWMonitor show several different CPU temperatures?
HWMonitor lists core temperatures individually (Core 0, Core 1, etc.) and also shows an overall CPU package temperature. The core readings are from thermal sensors inside each CPU core, while the package temperature represents the hottest part of the CPU die. When monitoring for thermal issues or stress testing, the highest of these values is the most important.
Is HWMonitor accurate for reporting GPU temperatures?
HWMonitor is generally accurate for GPU temperature readings, as it pulls data directly from the onboard sensors. However, some users report small differences when comparing with MSI Afterburner and other tools. If you need exact numbers for overclocking or thermal analysis, it's worth comparing with a second tool.
Can HWMonitor show how much power my GPU is using?
Yes, HWMonitor can display GPU power usage if your graphics card supports it. It shows readings from the PCIe slot and the auxiliary power connectors (6-pin or 8-pin). By adding these values together, you can estimate the total power draw of your GPU. This can be helpful when deciding whether your power supply is sufficient or if you're planning an upgrade.
What are TMPIN readings in HWMonitor?
TMPIN labels are temperature sensors on the motherboard, but their exact purpose can vary depending on the manufacturer. They might monitor the VRMs, CPU socket area, chipset, or other components. Because the naming isn't standardized, the readings can be hard to interpret without checking your motherboard documentation.
Which CPU temperature should I focus on: package, cores, or motherboard?
The most important temperatures to monitor are the CPU package and the highest individual core temperatures. These reflect the real thermal state of your processor. Motherboard CPU readings are often lower and less precise. As long as your CPU stays below 90 – 95 °C under load, it's within safe limits for most modern CPUs.
What's New:
- AMD Radeon RX 9060 XT (Navi 44).
- NVIDIA RTX 5060 (GB206).
- AMD Ryzen 9 8945HX, 8940HX, Ryzen 7 8840HX, 8745HX (Dragon Range refresh).
- AMD Ryzen AI Max+ 395 & AI Max+ PRO 395, Ryzen AI Max 390 & AI Max 385 (Strix Halo).
- AMD Ryzen AI 7 350, Ryzen AI 5 340 (Kraken Point).
- AMD Ryzen 7 5705G, 5705GE, Ryzen 5 5605G, 5605GE, Ryzen 3 5305G, 5305GE (Cezanne).
- AMD Radeon RX 9070 XT & 9070 (Navi 48).
- Zhaoxin KaiXian KX-U6780A and KX-U6580 (LuJiaZui, 8 cores).
- NVIDIA RTX 5070 Ti (GB203) & 5070 (GB205), RTX 5060 Ti (GB206).
- NVIDIA PCI-E error counters.
- Fix NVIDIA GPU temperature bug (drivers GeForce 576.02).
- Asus RTX Astral 5080 & 5090 12VHPWR per-pin currents.