The ASUS PC Probe is a simple utility that monitors vital information in the computer such as fan rotations, voltages and temperature. Additionally, it gives system information such as hard disk space, memory usage, CPU type and processor speed. After installation, the application resides in the taskbar and provides audio warning through the PC speakers if certain thresholds such as temperature and voltage have been exceeded. If your system is overclocked, remember to raise the appropriate warning limits or face frequent warning pop-ups.
How to use Asus PC Probe II?
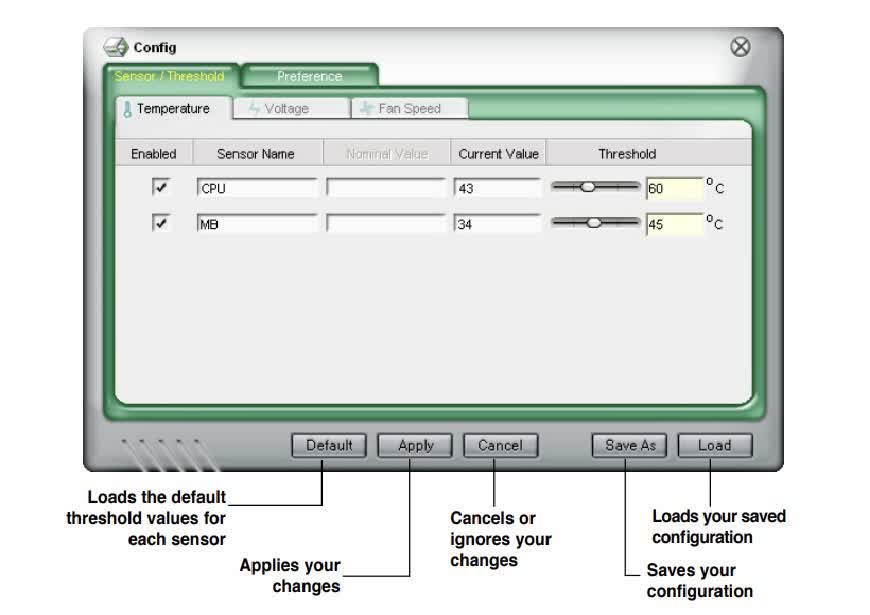
The PC Probe II main window allows you to view the current status of your system and change the utility configuration. By default, the main window displays the Preference section. You can close or restore the Preference section by clicking on the triangle on the main window right handle.
Sensor Alert
When a system sensor detects a problem, the main window right handle turns red, as the illustrations below show. When displayed, the monitor panel for that sensor also turns red. Refer to the Monitor panels section for details.
Preferences
You can customize the application using the Preference section in the main window. Click the box before each preference to activate or deactivate
Hardware monitor panels
The hardware monitor panels display the current value of a system sensor such as fan rotation, CPU temperature, and voltages. The hardware monitor panels come in two display modes: hexagonal (large) and rectangular (small). When you check the Enable Monitoring Panel option from the Preference section, the monitor panels appear on your computer's desktop.
Usage
The Usage browser displays real-time information on the CPU, hard disk drive space, and memory usage. Click "Usage" to display the Usage browser.
CPU Usage
The CPU tab displays realtime CPU usage in line graph representation. If the CPU has an enabled Hyper-Threading, two separate line graphs display the operation of the two logical processors.
Hard Disk Drive Space Usage
The Hard Disk tab displays the used and available hard disk drive space. The left panel of the tab lists all logical drives. Click a hard disk drive to display the information on the right panel. The pie chart at the bottom of the window represents the used (blue) and the available HDD space.
Memory Usage
The Memory tab shows both used and available physical memory. The pie chart at the bottom of the window represents the used (blue) and the available