CapFrameX is a free Windows application designed for capturing and analyzing gaming performance, especially frame times and FPS (frames per second). It works alongside tools like PresentMon to record detailed performance data while you play, making it popular among PC gamers, reviewers, and hardware enthusiasts.
The software provides advanced benchmarking features, including frame time graphs, statistical comparisons, and smoothness metrics such as 1% and 0.1% lows. This makes it useful for evaluating GPUs, CPUs, driver updates, and game settings beyond just average FPS.
Features
Record list
- Active directory observer
- Tree view expander for selecting capture folder and deleting/creating subfolders
- Customized sorting
- Move records to other folders through context menu
- Editable game name, hardware info and comment for each record
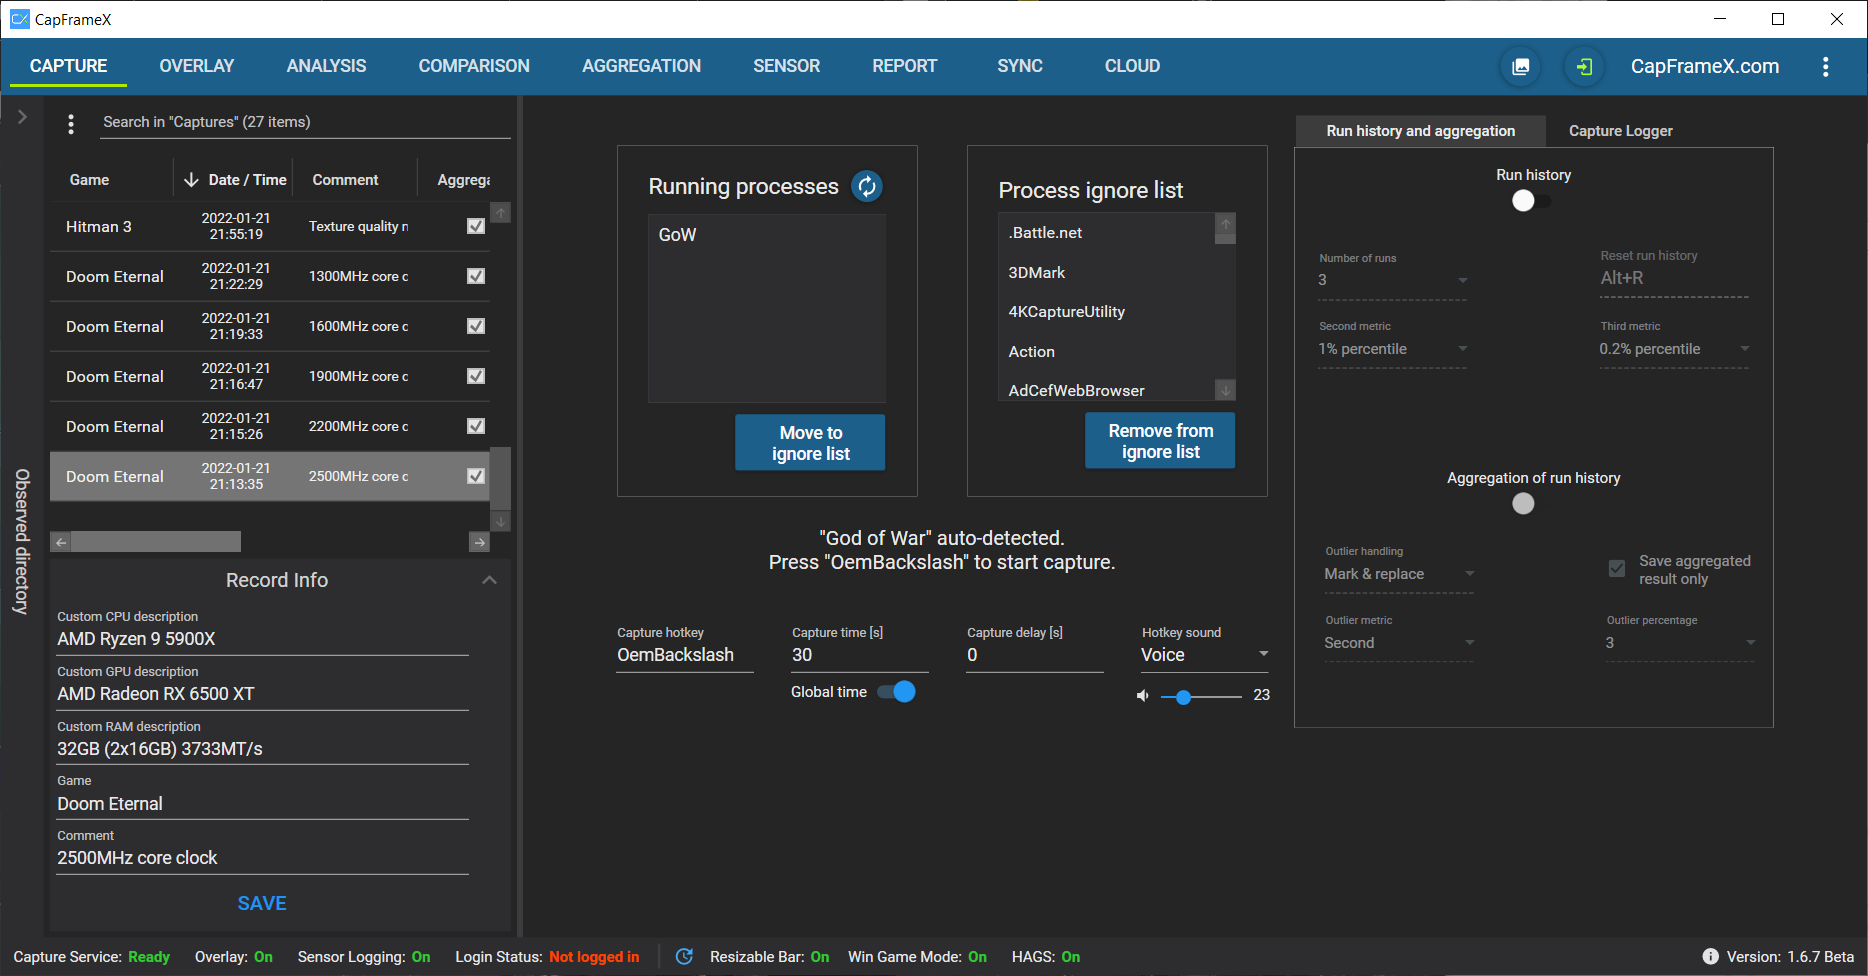
Capture page
- Running processes list containing every active process that can be captured
- Ignore list containing every process that will not be seen as process to capture
- Capture status information text
- Settings for capture hotkey, capture time and hotkey sounds
- Info box with capture log
Overlay page
- Overlay items list to select displayed items, edit their group name and enable graphs
- Overlay hotkey and refresh period setting
- Show 3-5 runs as history on overlay with selectable metrics
- Aggregate the history to a new single record file
- Detect outliers within the history
- Option to use outlier runs for aggregation or to replace them with additional runs
- Options for overlay item colors, formats and group separators
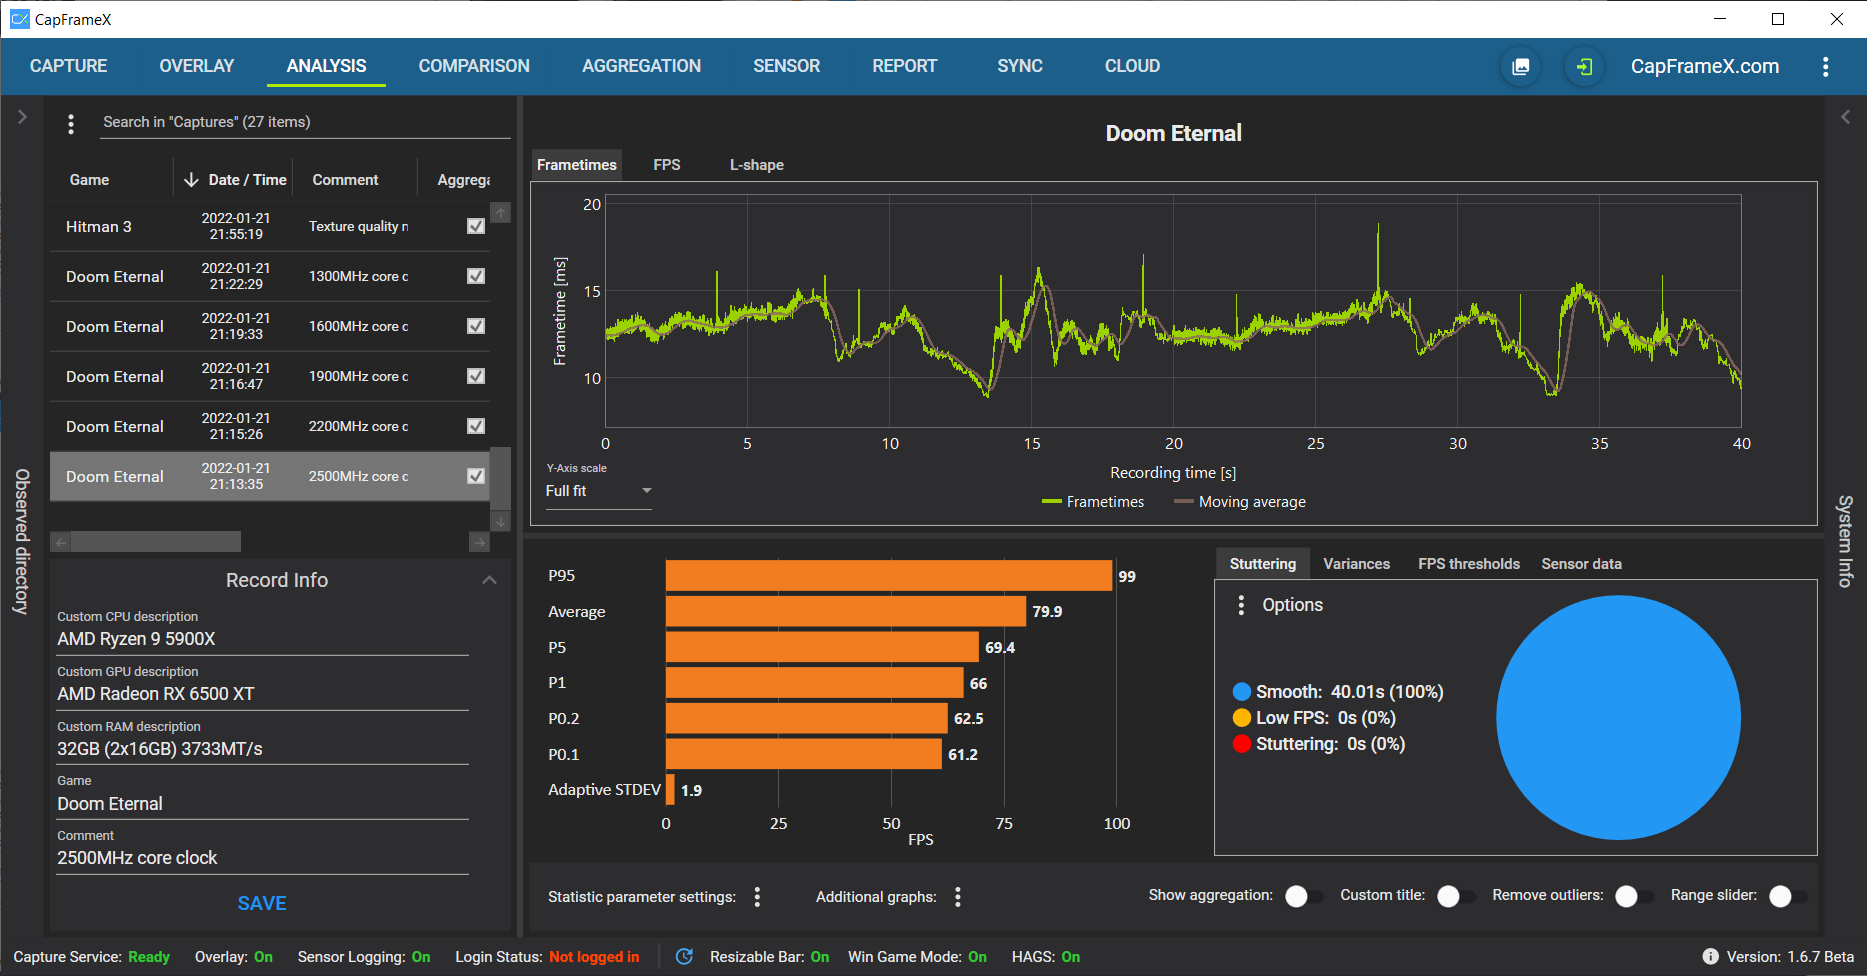
Analysis page
- Analyse your recordings with ease
- Graphs for frametimes, FPS and L-shapes
- FPS graphs either as raw values, time-based average filtered or both
- Additional charts and statistic tab when using sensor logging
- Bar charts for performance metrics
- Pie chart for stuttering and low FPS analysis (configurable stuttering factor and low FPS threshold)
- Bar charts for fps thresholds(frame counts or times in absolute or relative values)
- Select y-axis scale
- Parameter settings (average, percentiles, average lows, min/max)
- Range slider toggle to cut and move a specific time window
- Remove outlier toggle to ignore unsusual spikes
- System info expander to show hardware and software info
- Copy data to clipboard via context menu
Aggregation page
- Manual aggregation of existing records
- Selectable metrics
- Outlier relation settings
- Marking of outlier runs
- Aggregation option with or without outliers
- Comparison page
- Compare multiple records with each other
Bar charts
- Bar charts with up to 2 selectable metrics
- Relative percentages automatically on mouseover or fixed on mouse click
- Up to 2 lables as selectable context(date/time, CPU, GPU, RAM, Custom comment)
- Sorting mode by selectable metric
- Grouping option to sort by game names before sorting by FPS
Frametimes / L-Shapes
- Frametime and l-shape graphs
- FPS graph with optional average filter
- Custom color selection
- Hiding single graphs
- Highlight graphs on mouseover in comparison list
- Range slider toggle to cut and move a specific time window
- Legend toggle
Sensor Page
- Set sensor logging and logging polling period
- Choose sensors to be logged
- Analyze all logged sensors
- Copy sensor data to clipboard
Report page
- Comparing multiple records in an overview with all infos and metrtics
- Copy data to clipboard via context menu
Synchronization page
- Until displayed time analysis
- Graphs comparing frametimes and until displayed times
- pPrcentage for frames within valid monitor sync range
- Historgram chart for until displayed time distribution
- Pie chart for dropped frames
Input lag analysis
- Graphs comparing frametimes and input lag times to analyse input lag
- Offset option to account for monitor and mouse/keyboard input lag
- Historgram chart for input lag time distribution
- Bar charts average input lag(upper bounds, lower bounds, expected)
Cloud page
- Upload records and get an ID to share with others
- Download records with ID
- Log in to see your uploads on the website
- Share new game names and ignored entries with us
- Receive auto-updates for your process list
Global options
- Set graph filter time window(for moving average frametimes and average filtered FPS graphs)
- Set fps value rounding digits
- Auto-start and start minimized options
- Change or open screenshot directory
- Set hardware info source (CPU, GPU and RAM that gets written into the capture file)
Important notes
- To use the portable version you have to install the standard version on your system once to ensure all frameworks are installed.
- If you are using a network drive as your capture directory and having problems connecting to it on autostart, you might want to download this additional zip file too and read the info inside it.
What's New
Enhancements & New Features
- Increased buffer capacity for extremely high fps scenarios
Bugfixes
- Fixed driver version overlay info for AMD GPUs
Platform & Infrastructure
- Readded signed PawnIO.sys driver to address Windows SmartScreen issues
Runtime Requirements
- .NET 9 is now required for full feature support and optimal stability. Download here.
CapFrameX Portable Mode
- CapFrameX now supports a portable mode that allows the application to run entirely from a single folder without writing to system directories. This is useful for running from USB drives, network shares, or keeping multiple isolated installations.
How It Works
- Portable mode is activated by placing a portable.json file in the same directory as the CapFrameX executable. When the application starts, it checks for this file and redirects all data storage to paths relative to the application directory.
Key Features
- Self-contained: All configuration, captures, screenshots, and logs are stored relative to the application folder
- No registry modifications: The application doesn't write to the Windows registry in portable mode
- No system folder usage: Bypasses %AppData% and Documents folders entirely
- Configurable paths: All storage paths can be customized via portable.json