
A week ago, we took a deep dive into Battlefield 6's GPU performance, testing 43 graphics cards to see how they handled the game's demanding visuals. Your response was great, but one single request stood out: readers also wanted to know how CPUs stack up. So this time, we turned our attention to the processor side of the equation, running 33 different CPUs across three quality presets to see how they drive performance.
There's a lot of data to unpack, but first, let's talk about how we gathered it. The single-player campaign was perfectly suited for measuring GPU performance, and the margins between various GPUs in that testing should translate closely to what you will see in multiplayer modes. But when it comes to CPU performance, single-player might as well be a different game altogether. As we learned during the Open Beta, accurately comparing CPUs in a live multiplayer environment is a challenge.

Multiplayer matches are dynamic and highly variable. What happens in one match will not necessarily occur in the next. Different structures are destroyed, players move through distinct areas, and chaos never repeats itself. Those variables make consistent CPU testing nearly impossible.
To work around that for head-to-head comparisons, we tested two CPUs simultaneously in the exact same match, mirroring each other's actions. It's an elegant idea but requires two testers and two RTX 5090 graphics cards per run. Scaling that up to 33 CPUs would mean 33 GPUs, 33 people, and 33 test systems.

This makes testing the multiplayer portion of the game accurately a difficult, if not impossible, task. Fortunately, there is a solution. Using the Portal Builder, we created a bot match that was surprisingly similar to a real multiplayer session in terms of CPU performance.
The advantage of using bots is their predictability, allowing us to achieve consistent results across every match, with each team engaging in the same area for a highly repeatable benchmark.
Our testing process involved walking from one end of the street to the other and back for each benchmark pass. We then reset the match and repeated the process two more times to obtain a three-run average. This method proved highly reliable and provided accurate, consistent data.

For the map, we selected "Empire State," one of the most CPU-demanding environments we tested during the Open Beta. On less demanding maps such as "Liberation Peak," the 9800X3D was more than 40% faster than the 14900K, but on Empire State, that margin was reduced by half.
Test System Specs
All testing was conducted at 1080p using an Nvidia RTX 5090, as our focus was on CPU performance. We tested using the low, medium, and overkill presets. All CPUs were tested with the memory profile loaded, while everything else was left at stock settings. There was no overclocking, PBO was disabled for Ryzen CPUs, and no Intel 1-click overclocking features such as 200S Boost were enabled.
| CPU | Motherboard | Memory |
| AMD Ryzen 9000 AMD Ryzen 7000 |
Gigabyte X670E Aorus Master [BIOS F38e] | G.Skill Trident Z5 RGB 32GB DDR5-6000 CL30-38-38-96 |
| AMD Ryzen 5000 AMD Ryzen 3000 AMD Ryzen 2000 |
MSI MPG X570S Carbon MAX WiFi [BIOS 7D52v1D1] | G.Skill Ripjaws V Series 32GB DDR4-3600 CL14-15-15-35 |
| Intel Core Ultra 200S | Asus ROG Maximus Z890 Hero [BIOS 2201] | G.Skill Trident Z5 CK 32GB DDR5-8200 CL40-52-52-131 CUDIMM |
| Intel 12th & 14th Gen | MSI MPG Z790 Carbon WiFi [BIOS 7D89v1H] | G.Skill Trident Z5 RGB 32GB DDR5-7200 CL34-45-45-115 |
| Intel 10th Gen Series | Asus ROG Maximus XIII Hero [BIOS 2302] | G.Skill Ripjaws V Series 32GB DDR4-3600 CL14-15-15-35 |
| Graphics Card | Power Supply | Storage |
| Asus ROG Astral RTX 5090 OC Edition | Kolink Regulator Gold ATX 3.0 1200W | TeamGroup T-Force Cardea A440 M.2 PCIe Gen4 NVMe SSD 4TB |
| GeForce Game Ready Driver 581.42 WHQL | ||
Now, let's take a look at the data.
Performance Benchmarks
Overkill Preset
Starting with the overkill preset, we see that the AM5 X3D CPUs dominate, averaging almost 200 fps in this test. The 9800X3D was the fastest, reaching 192 fps. Our 7800X3D was unavailable because we lent it to another reviewer, but it is generally around 10% slower than the 9800X3D. That means it should achieve at least 170 fps in this test, making it roughly 13% faster than the 7600X3D, which aligns with expectations.
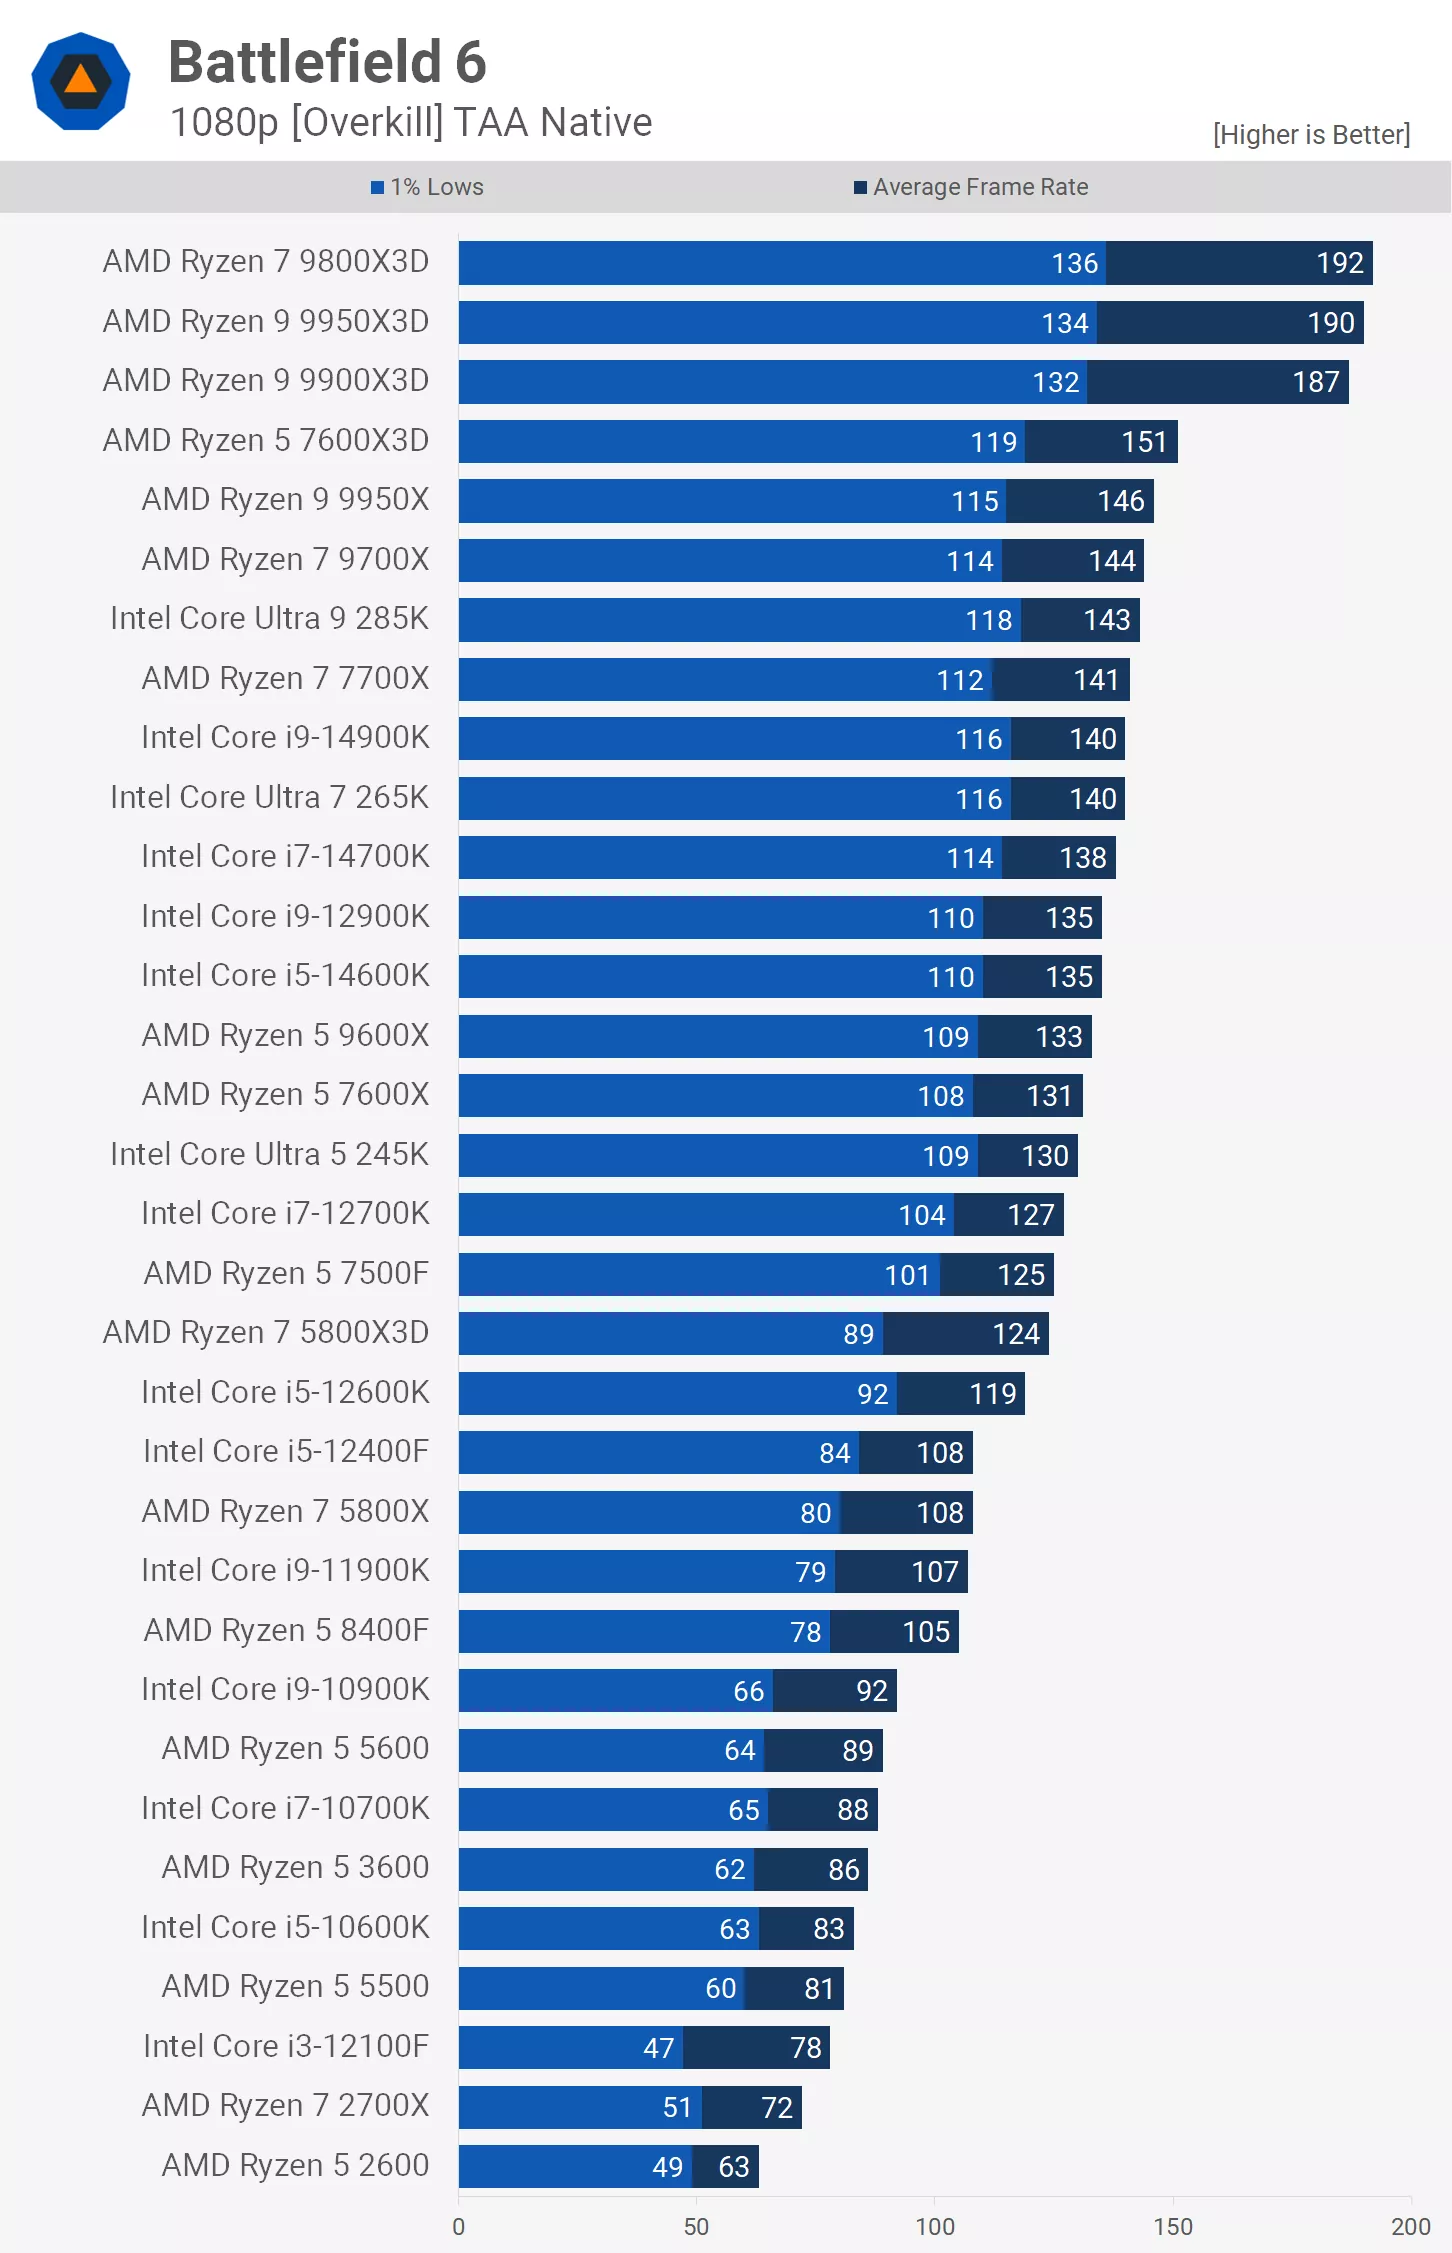
Speaking of the 7600X3D, it achieved 151 fps, making it slightly faster than the 9950X. Following that, we have the 9700X and 285K at just over 140 fps. In fact, about half a dozen CPUs fall within the 140 fps range, including the 265K, 14900K, and 7700X.
In the 130 fps range, we find the 245K, 7600X, 9600X, 14600K, 12900K, and 14700K. A fan favorite, the 5800X3D, trails behind some of the newer models but still performs well with an average of 124 fps. It roughly matches the 7500F, although with weaker 1% lows.
Standard Zen 3 CPUs, such as the 5800X, just managed to surpass the 100 fps mark, performing on par with the 12400F, 11900K, and the confusingly named 8400F. The 5800X outperformed the 10900K by 17% in this case, while the 10600K matched the Ryzen 5 3600. At the bottom of the chart, we find the quad-core 12100F and the older Zen+ processors.
High Preset
Switching to the high preset slightly reduces CPU load. For example, when using the overkill preset, the 9800X3D was 34% faster than the 285K. While one might expect that gap to widen as we lower the quality preset, the opposite happens: the 9800X3D is now 27% faster. It remains a large margin, but it has narrowed.
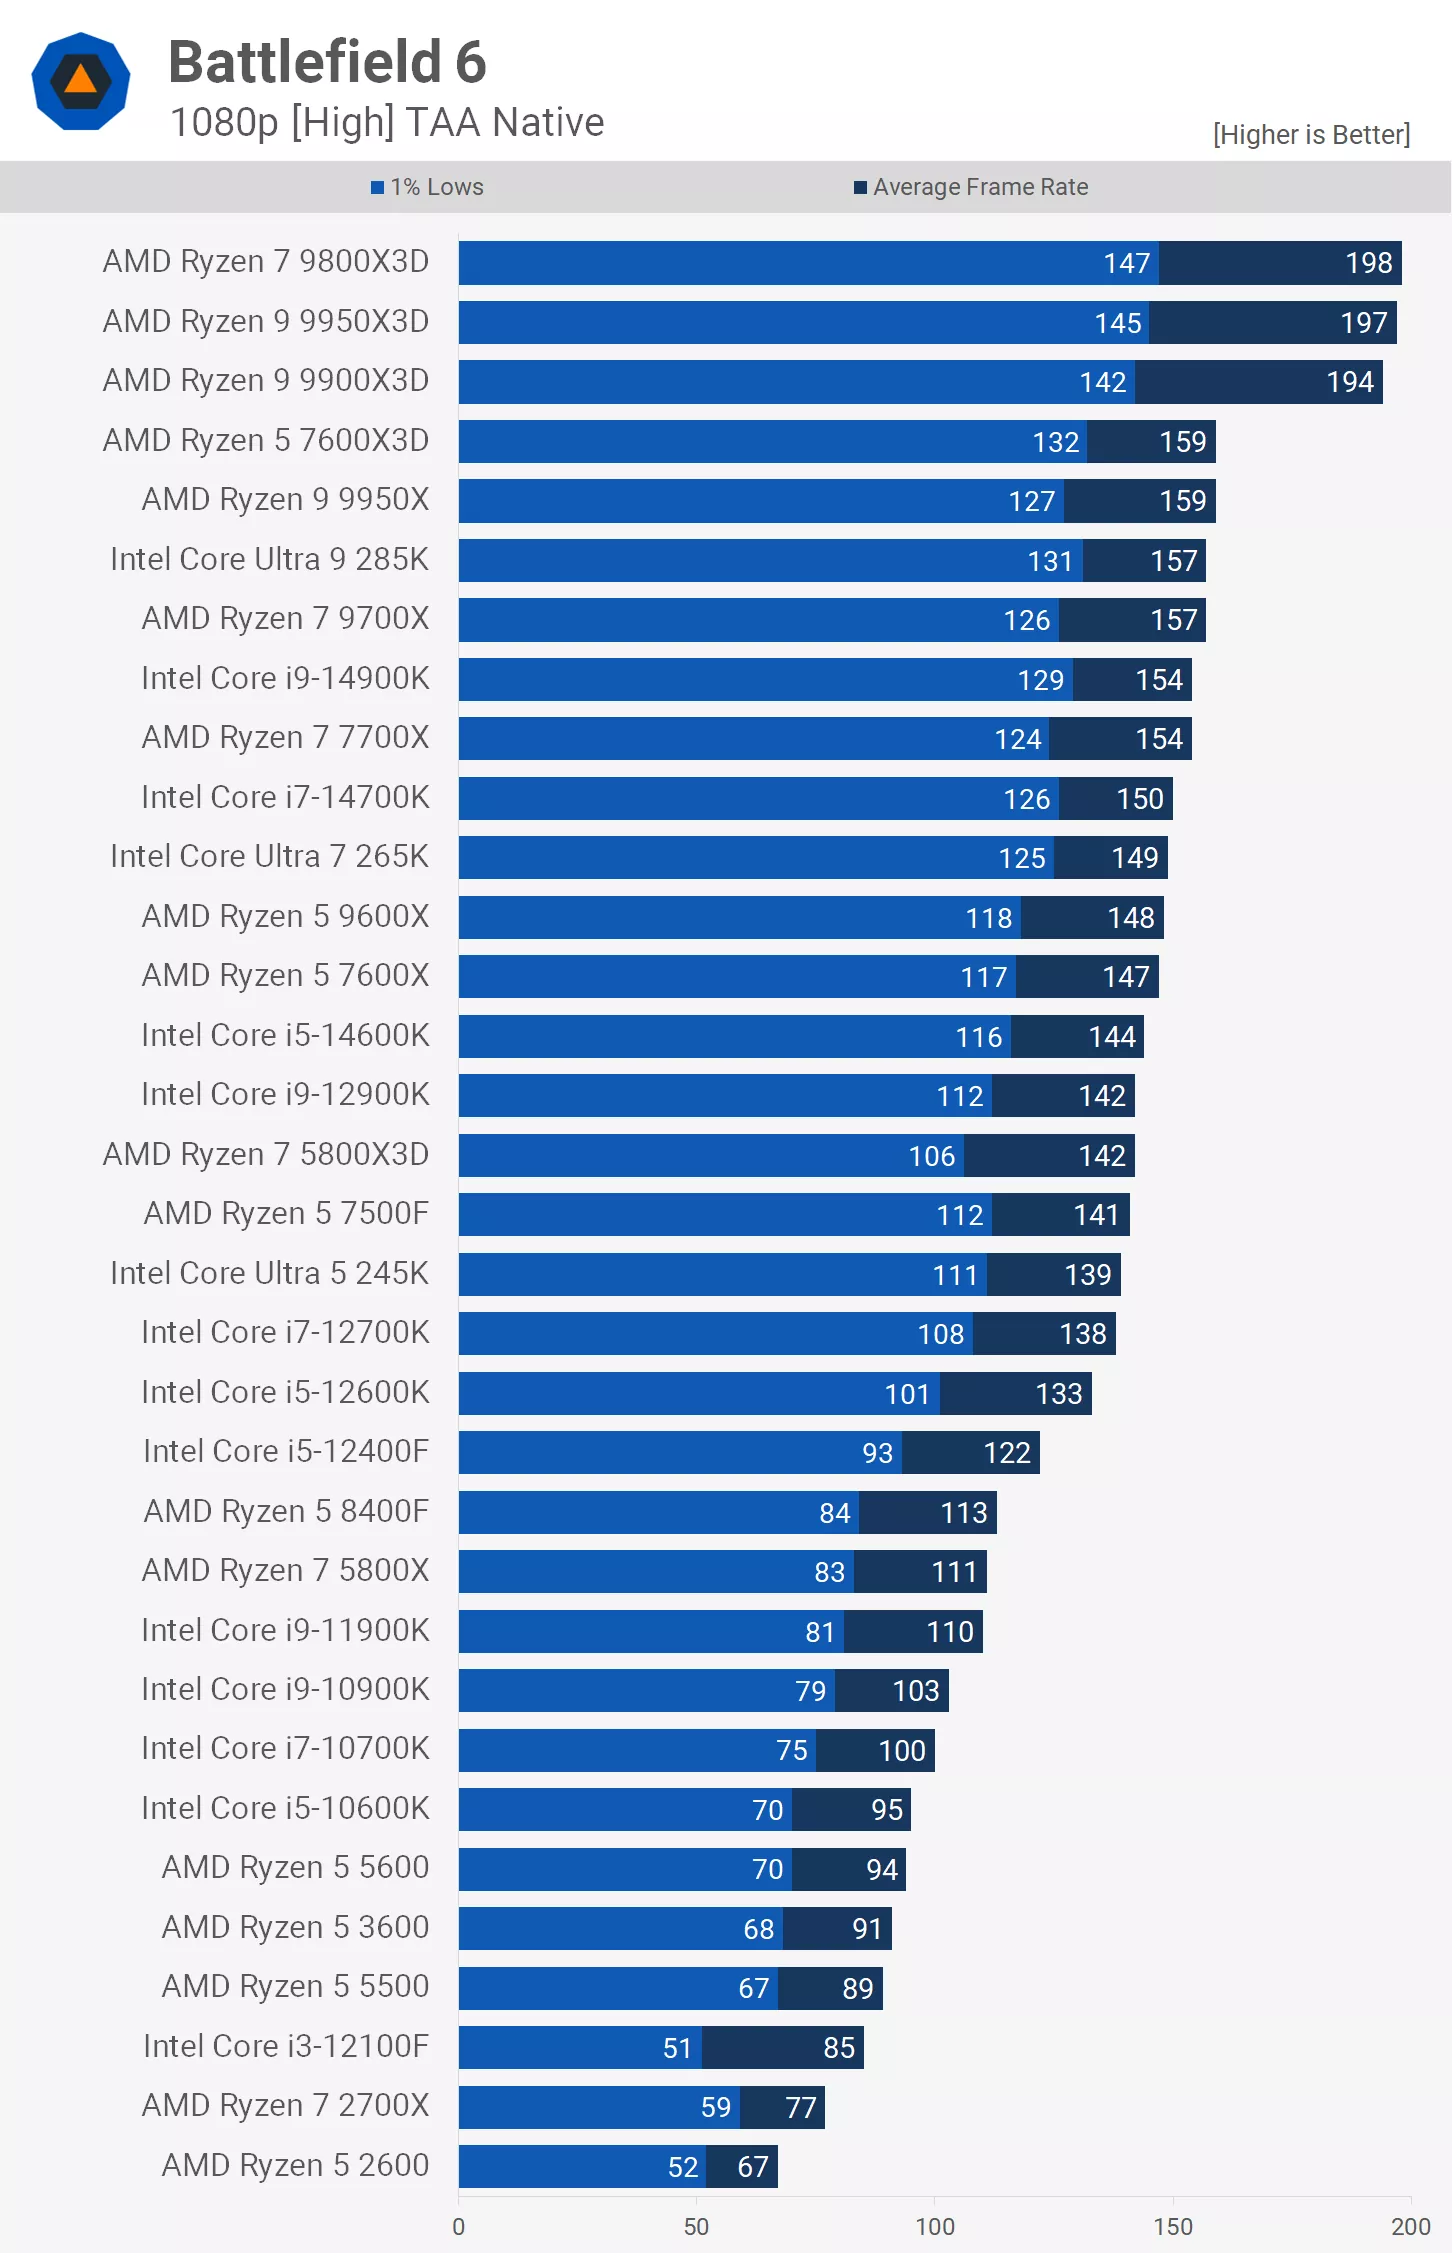
Most CPUs tested delivered between 138 and 159 fps, a range of about 15%. Toward the top of that range are the 7600X3D, 9950X, 285K, 9700X, 14900K, and 7700X. The 265K, 9600X, 7600X, and 14600K performed very similarly, while the first processors to drop from the leading group included the 12600K and 12400F.
The 8400F delivered the weakest performance among modern CPUs, only matching the 5800X and 11900K. The 10900K was closer to the 5800X this time, while the 10600K aligned with the 5600. Once again, the slowest CPUs tested were the 12100F, 2700X, and 2600.
Low Preset
Finally, we have the low preset, and this setting did not significantly improve the performance of the Zen 5 3D V-Cache processors, although it did help some of the slower CPUs catch up. The 9800X3D remained 27% faster than the 285K, but we now see a wide range of CPUs delivering between 158 and 163 fps, a very tight grouping of ten processors with no more than a 3% performance variation.
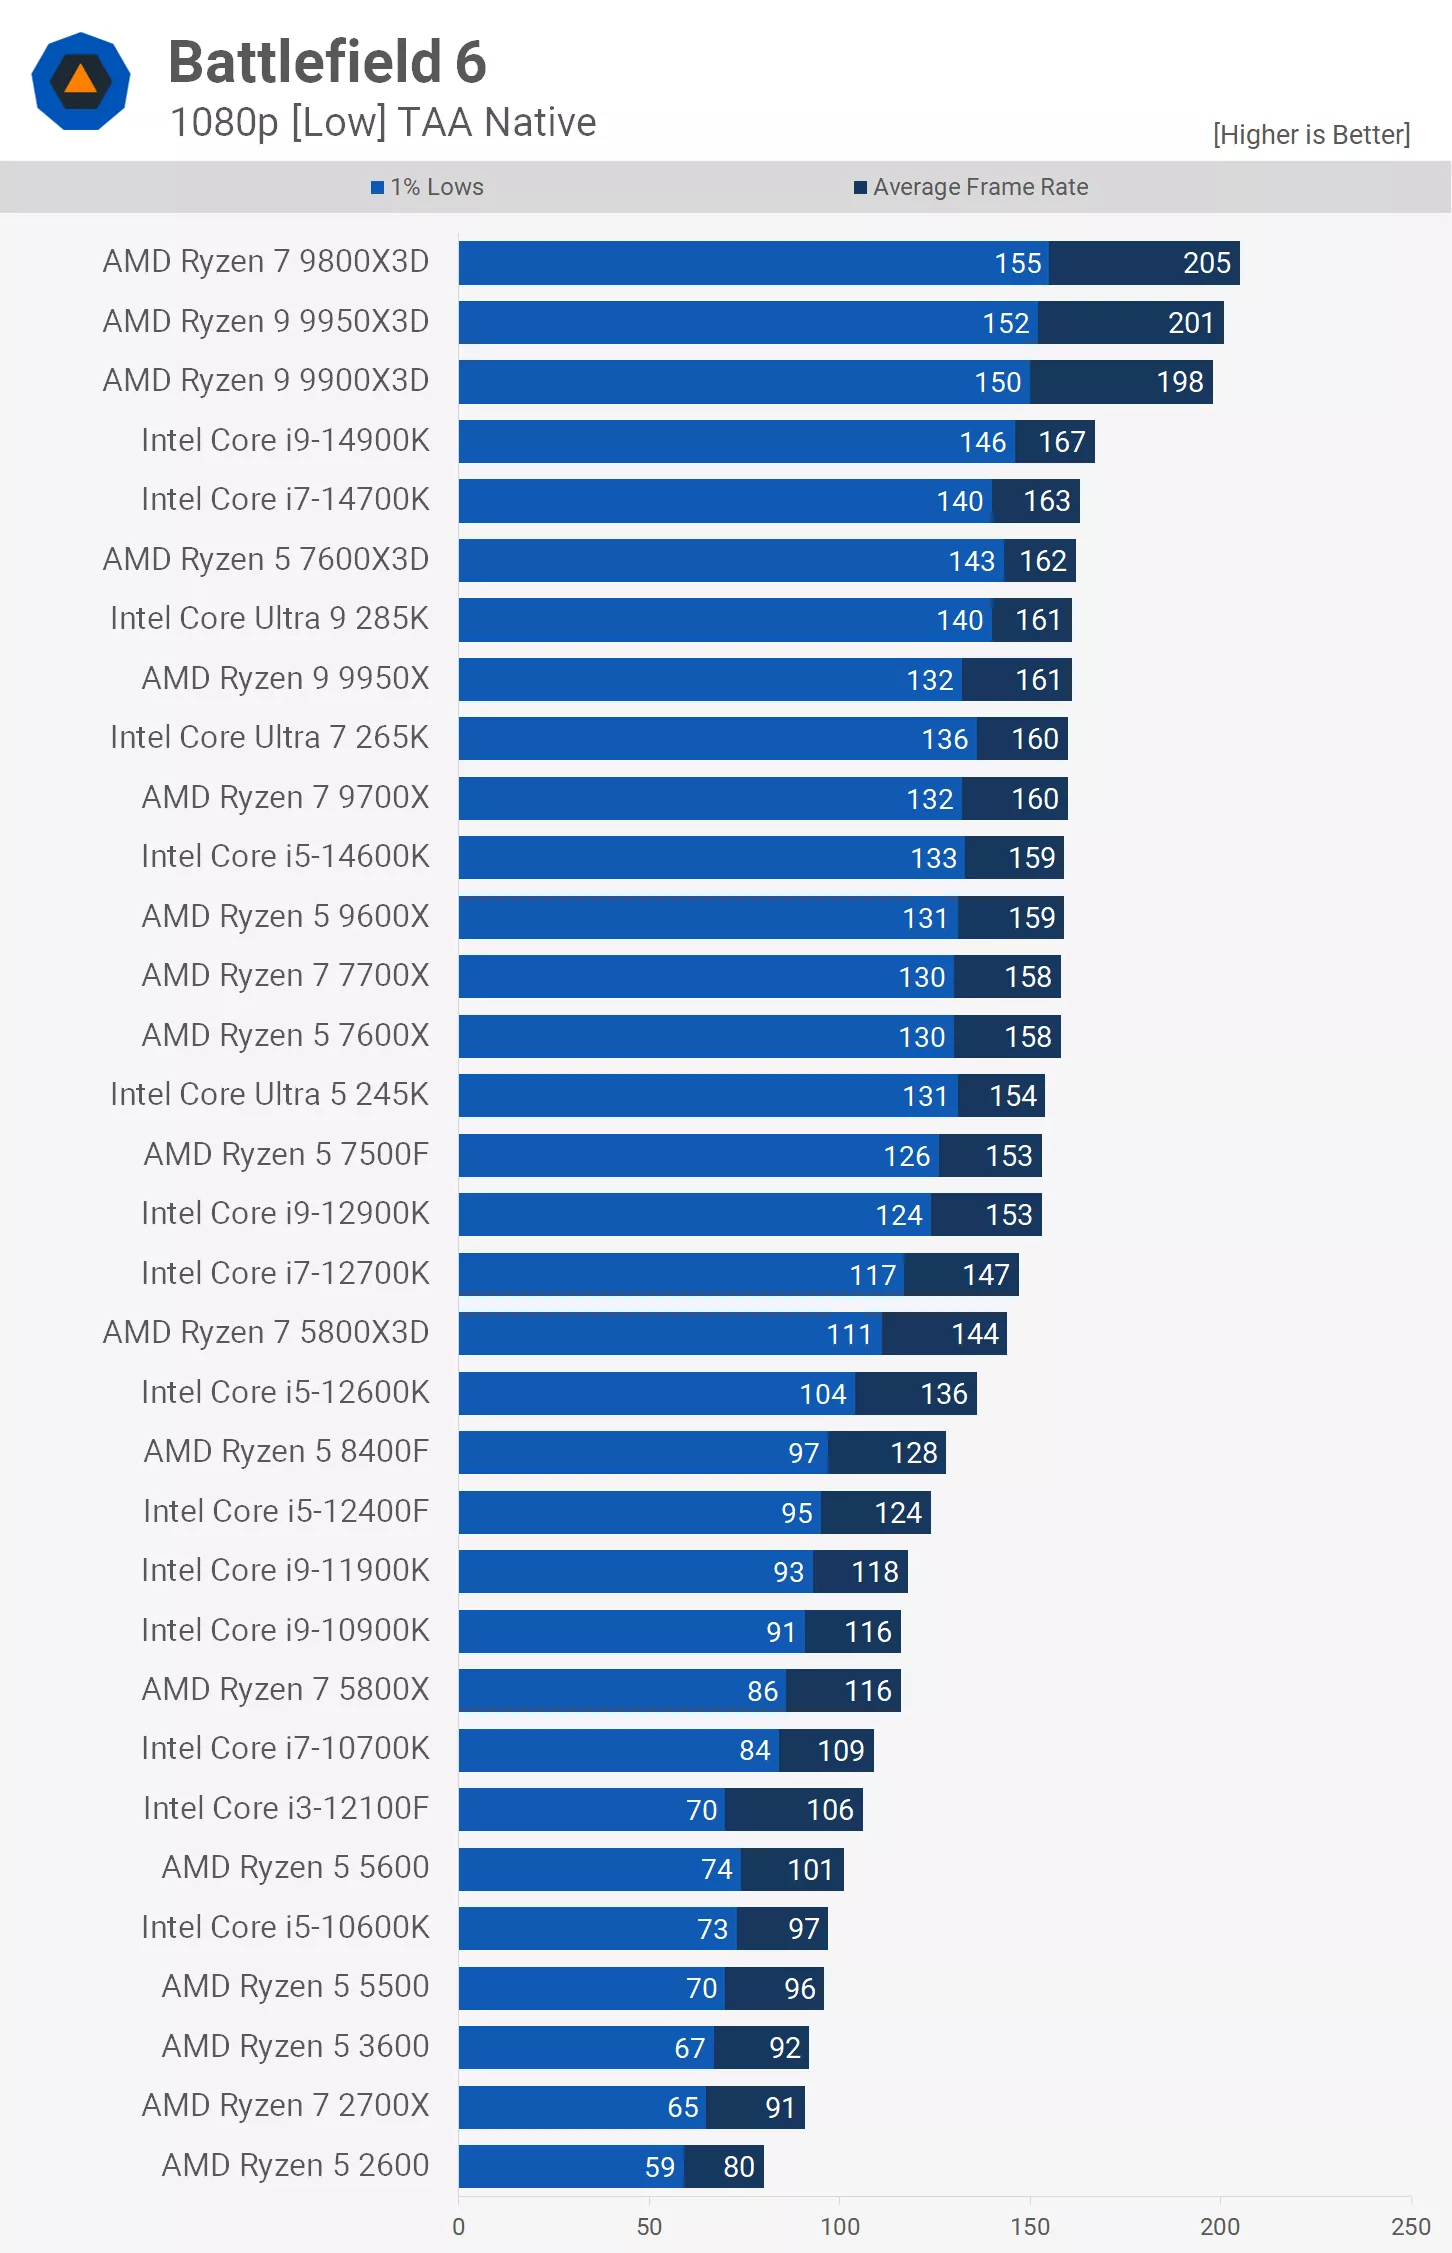
This means that the Ryzen 7 7600X, for example, performed similarly to the 285K, while the 7600X3D was only slightly faster, improving the 1% lows by about 10%. Compared to the overkill preset, the low preset boosted the performance of processors like the 12600K by 14%. That is not a massive increase, but every improvement helps, especially for older hardware.
The biggest impact is seen with older, lower-end CPUs, such as the Core i3-12100F, which experienced a 49% improvement in 1% lows and a 36% increase in average frame rate. Therefore, if you are using an older or slower CPU, enabling the low preset can dramatically improve performance. Importantly, these gains are not simply the result of reducing the GPU's workload.
8GB vs. 16GB VRAM
While we're at it, we want to address some confusion that arose from the previous GPU testing, where we found that 8 GB GPUs were significantly slower than their 16 GB counterparts. Some other benchmarks reported no difference, showing 8 GB and 16 GB versions of cards like the RTX 5060 Ti performing similarly. This discrepancy highlights how difficult VRAM testing can be and how issues related to insufficient VRAM may not appear during short benchmark passes.
This is why we played the game extensively using both the 16 GB and 8 GB versions of the RTX 5060 Ti to observe real-world performance differences.

For example, when loading the beginning of the third mission with both the 8 GB and 16 GB versions of the 5060 Ti using the overkill preset with quality upscaling at 1440p, performance appears nearly identical for the first few minutes. However, as gameplay continues, the 8 GB card begins to fall behind. The difference starts small but gradually becomes significant the longer you play.
... with both the 8 GB and 16 GB versions of the 5060 Ti using the overkill preset with quality upscaling at 1440p, performance appears nearly identical for the first few minutes. However, as gameplay continues, the 8 GB card begins to fall behind. The difference starts small but gradually becomes significant the longer you play.
After about 15 minutes, the game begins using over 10 GB of VRAM, putting the 8 GB model at a severe disadvantage. At this point, two factors come into play: the game has had enough time to fully load VRAM, and the scene becomes more demanding. As a result, the 16 GB RTX 5060 Ti delivers over 80% better performance and crucially, it can provide a smooth, enjoyable experience, whereas the 8 GB card becomes a laggy mess.

But these VRAM issues only really apply for the single-player campaign, as it's here where most players like to crank the visuals up for the best possible experience. In contrast, the opposite will be true for most when it comes to the multiplayer portion of the game, which is why we didn't make a big deal out of the VRAM issue for this title.
... if we drop to the high preset, the game still looks excellent, and 8 GB GPUs perform well, especially when upscaling is enabled

Not only that, but if we drop to the high preset, the game still looks excellent, and 8 GB GPUs perform well, especially when upscaling is enabled. At the medium or low presets, upscaling is no longer necessary to avoid performance issues on 8 GB GPUs, and these settings are typically preferred by competitive players who prioritize frame rate and responsiveness.
How Much CPU Power Do You Really Need?
Battlefield 6 proves that while it's one of the most CPU-hungry shooters around, most modern processors have no trouble keeping pace. Even something as modest as the Ryzen 5 7500F averaged 141 fps on the high preset in our tests – proof that you don't need a flagship chip to enjoy the game at high frame rates.
It's worth noting that frame rates can sometimes be considerably higher than what we report here.

Step away from the main action and frame rates can climb by as much as 50%. Different maps also stress the CPU in different ways, so results will always vary slightly from one scenario to another. The important point is that every CPU in this benchmark was tested under identical conditions.
So if your 265K hovers closer to 200 fps, that doesn't mean ours was underperforming or that yours is unusually fast – it just means you're looking at a lighter slice of gameplay. Our focus was squarely on the most intensive parts of each match, where CPU limits really show.

We are also aware of the "user config file" trick that has existed in previous Battlefield titles. This involves creating a configuration file that specifies the number of physical cores and maximum threads your CPU can use. Doing this can sometimes improve performance, but when we tested it on the 9800X3D system, we saw no measurable gains. If you want to try it, there are plenty of simple guides online that walk through the steps.
The broader picture is encouraging: if you're running a relatively recent AMD or Intel processor, Battlefield 6 should run beautifully. The AM5 3D V-Cache CPUs are currently the best performers, offering the highest frame rates, but they are by no means essential. Processors like the 285K, 14900K, and 9700X all deliver an excellent, top-tier gaming experience.