
It's time to review the new GeForce RTX 4080, Nvidia's latest $1,200 GPU, which is a massive 71% increase over the RTX 3080's MSRP, though of course Nvidia would prefer we forget that was ever a thing and instead focus on the $1,200 3080 Ti.
Granted, the market has changed a lot since then, so it will be interesting to see what the RTX 4080 has to offer. There's plenty to discuss and benchmarks to check out, but first let's touch on the specifications, take a look at the Nvidia Founders Edition model, and then we'll get to the blue bar graphs. In time for this review we also received partner models from PNY, Asus, and MSI, which we'll show off towards the end of the review.
The GeForce RTX 4080 is based on the AD103 silicon which measures 378.6 mm2, that's a 38% smaller than the AD102 used by the RTX 4090 which sees a 40% reduction in transistors. The 4080 still packs 62% more transistors than the previous-gen 3090 Ti flagship though. Given those figures it should be no surprise to learn that the 4080 packs 41% fewer CUDA cores than the 4090, the memory bus width has been reduced by 33% and there's 11% less L2 cache.
As for core clocks, there's little difference between the RTX 4090 and 4080, we're talking 2505 MHz versus 2520 MHz for the boost clocks, with a slight advantage to the 4090. The RTX 4080 has been awarded faster 22.4 Gbps GDDR6X memory, a 7% increase there from the series flagship, though the smaller 256-bit wide memory bus means that overall memory bandwidth has been cut down by 29% to 717 GB/s.
| GeForce RTX 4090 | GeForce RTX 4080 | GeForce RTX 3090 Ti | GeForce RTX 3080 Ti | |
|---|---|---|---|---|
| Price [$US MSRP] |
$1,600 | $1,200 | $2,000 | $1,200 |
| Release Date | October 12, 2022 | November 16, 2022 | March 29, 2022 | June 3, 2021 |
| Codename | AD102 | AD103 | GA102 | |
| Process | TSMC 4N | Samsung 8LPP | ||
| Cores | 16384 / 512 / 176 | 9728 / 304 / 112 | 10752 / 336 / 112 | 10240 / 320 / 112 |
| GPU Boost Clock | 2520 MHz | 2505 MHz | 1860 MHz | 1665 MHz |
| Memory Capacity / Type | 24GB / GDDR6X | 16GB / GDDR6X | 24GB / GDDR6X | 12GB / GDDR6X |
| Memory Speed | 21 Gbps | 22.4 Gbps | 21 Gbps | 19 Gbps |
| Bus Type / Bandwidth | 384-bit / 1008 GB/s | 256-bit / 717 GB/s | 384-bit / 1008 GB/s | 384-bit / 912 GB/s |
| Total Board Power | 450 watts | 320 watts | 450 watts | 350 watts |
Nvidia claims a total graphics power rating of 320 watts for the RTX 4080. That's the same rating given to the 3080, though the maximum GPU temperature has been downgraded from 93c to 90c. The minimum power supply requirement is 750 watts and for testing we'll be using an 850w unit.

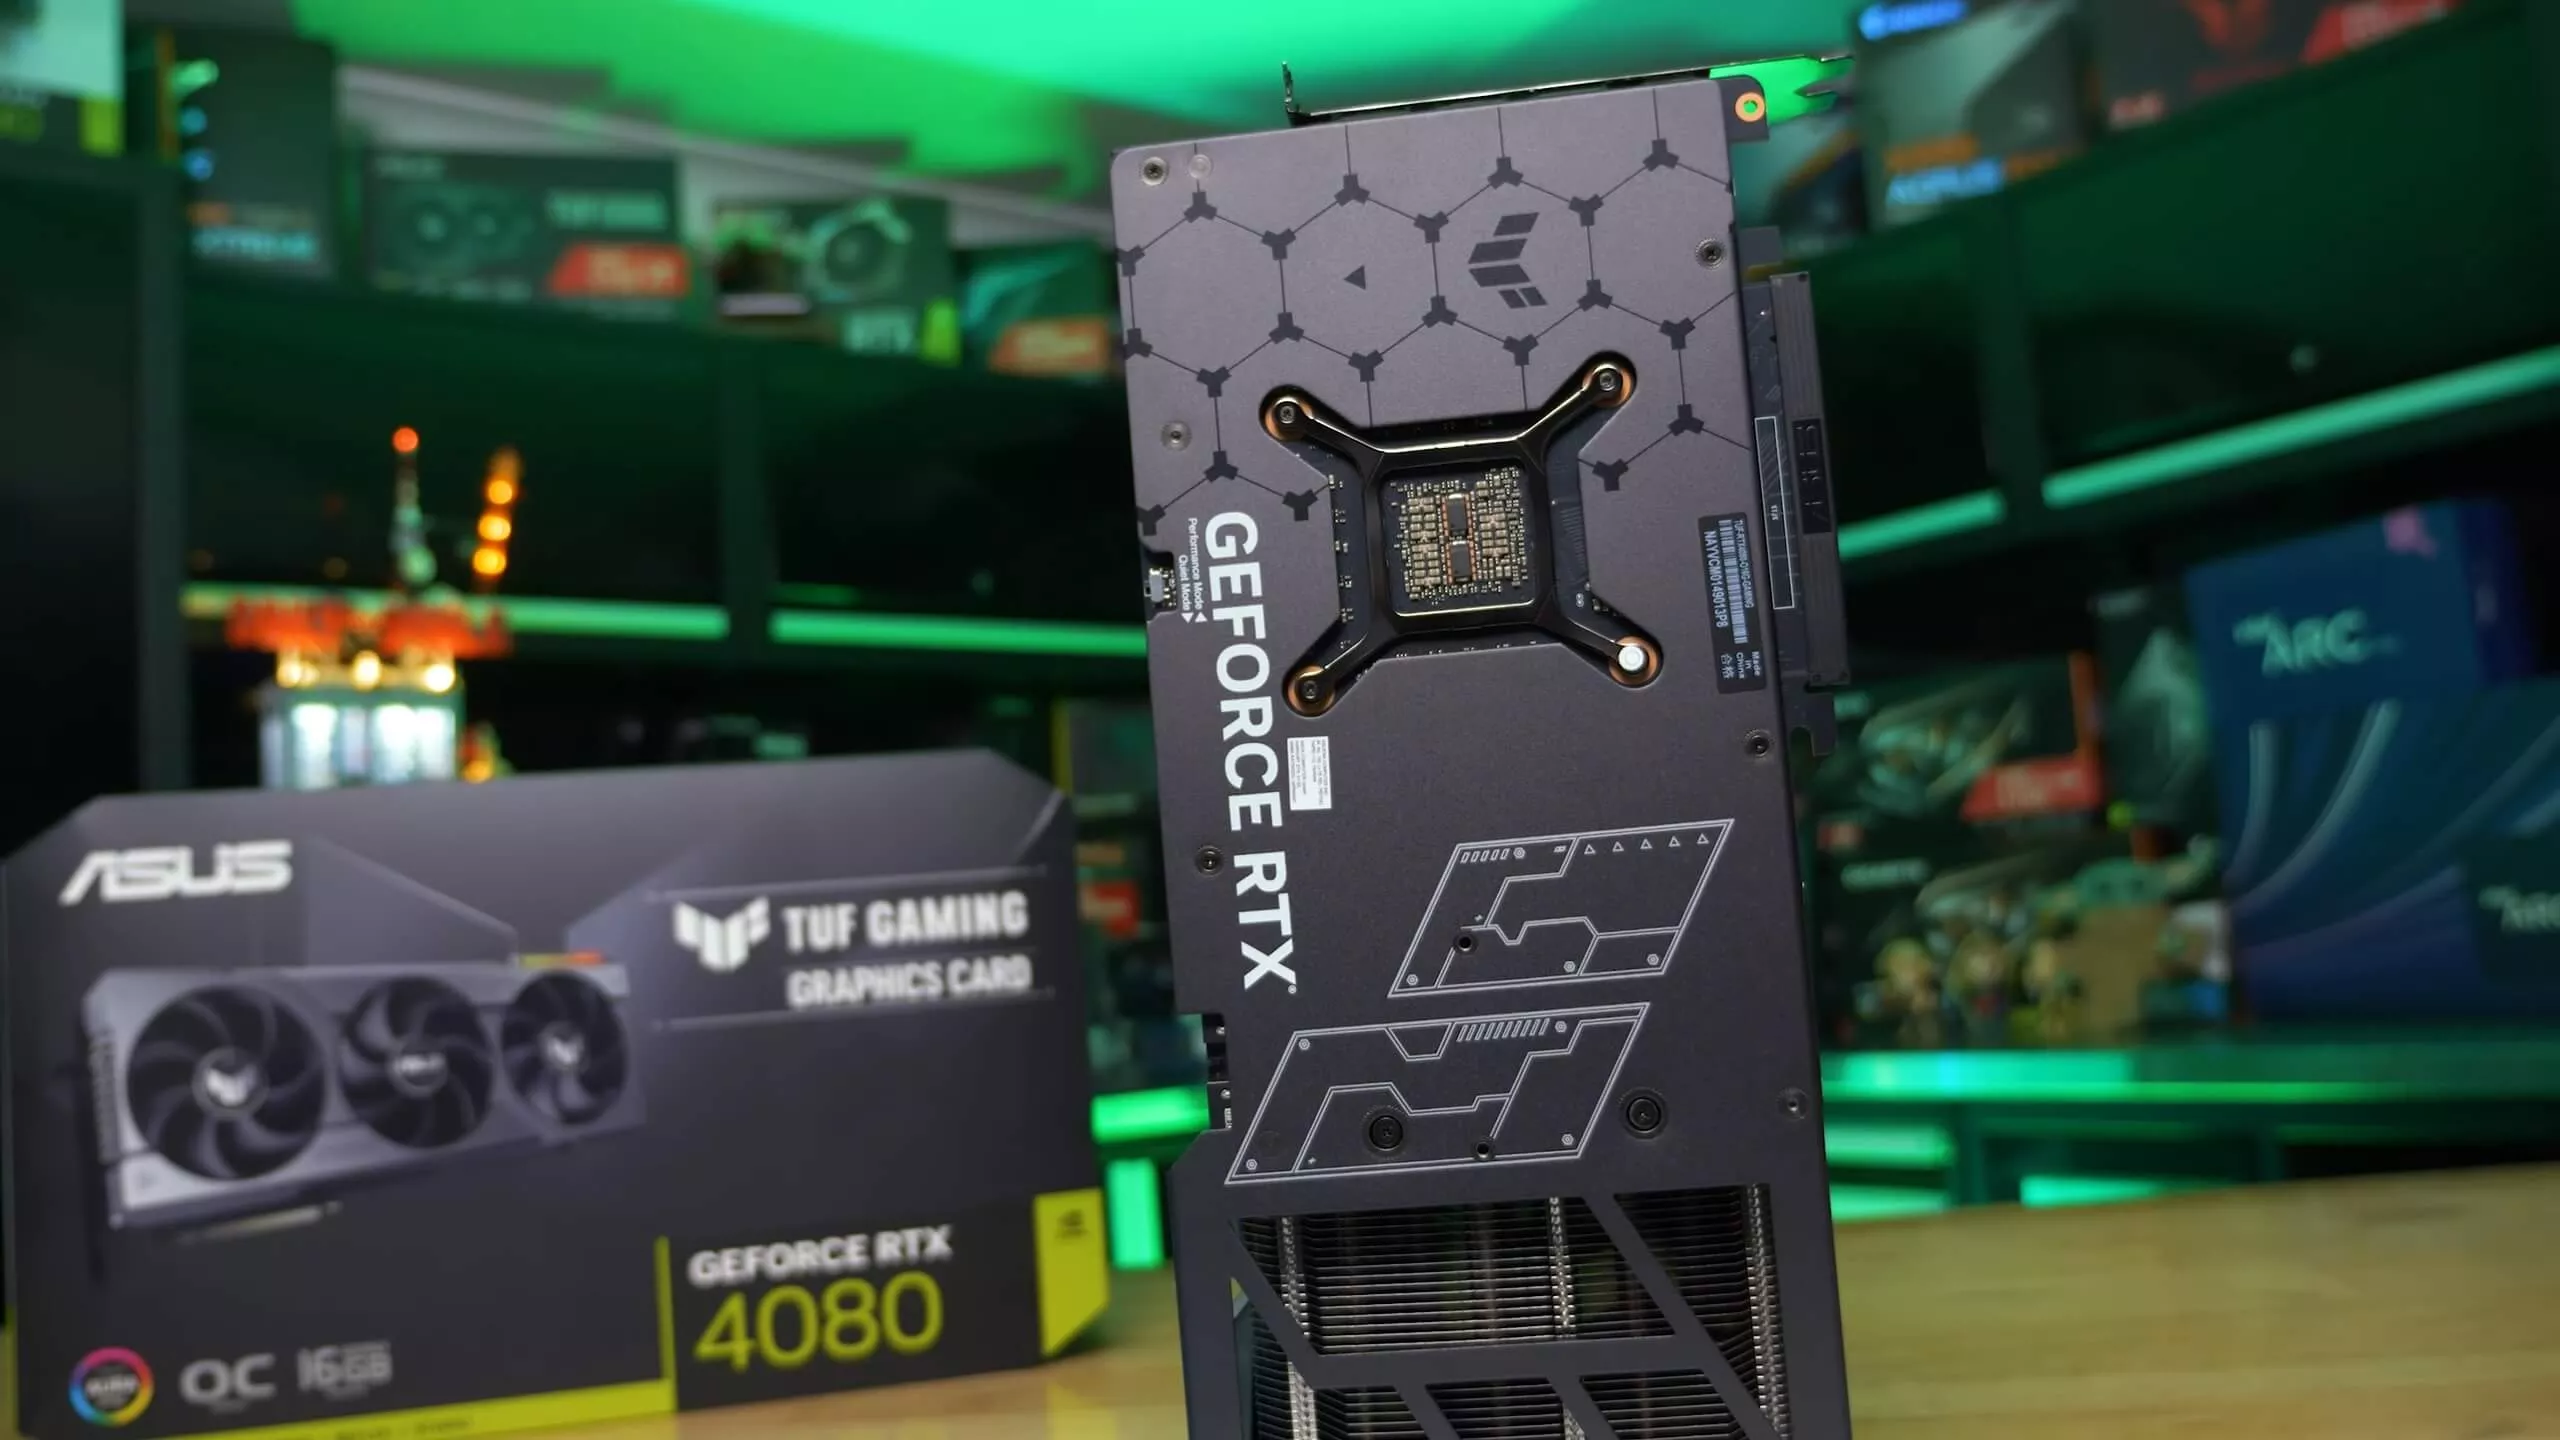
In terms of design, the Founders Edition RTX 4080 is identical to the 4090 on the outside, the only difference we can account for so far is the weight, the 4080 FE model is 3% lighter. Obviously there are some physical changes under the skin, we imagine power delivery has been cut down, the memory configuration has changed, and the GPU die is smaller. It's also possible Nvidia made some changes to the cooling, but we didn't have time to tear it down for this review. Point is though, they physically look like the same product.

This means the GeForce RTX 4080 is still using the controversial 16-pin 12VHPWR power connector. A lot has been said about this connector over the past month, but what the real story is – in our opinion – it's unknown at this point. So we're not going to feed into that story as we believe a lot more investigation needs to be done before drawing any conclusions.
A single PCIe 5.0 power connector can deliver up to 600 watts and previously that would require four 8-pin power connectors. However, you won't need a new PCIe 5.0 compliant power supply as RTX 4080 comes with a 3x 8-pin to single 16-pin adapter, similar to the 3x 8-pin to 16-pin model supplied with the 3090 Ti.

In addition to the increase in cores, there's the inclusion of 4th-gen Tensor cores and 3rd-gen RT cores, the GeForce 40 series also introduces DLSS 3, a feature that for now is exclusive to the new series.
Since we tested Nvidia's DLSS 3 technology not a whole lot has changed, aside from the launch of a few more games supporting it. Our investigation came after the launch of the RTX 4090 and remains the best place for a comprehensive breakdown of the tech. In our testing, DLSS 3 largely performs in the same manner on the RTX 4080. Nvidia is aware of the issues we brought up and is working on a few fixes for things such as broken UI elements and transitions.

As for our general thoughts on DLSS 3, the technology does have some benefit, but it's more limited compared to DLSS 2. Gamers will benefit most from DLSS 3's Frame Generation technology when games are already being run at a good frame rate: somewhere around 100 FPS before DLSS 3 frame generation is enabled, with DLSS 3 then boosting FPS to around 180-200 FPS. This improves visual smoothness with high refresh rate displays and works quite well under these conditions as it hides visual artifacts and latency problems are minimized. We wouldn't recommend it for gaming below 120 fps, so it's more of a niche feature that adds to Nvidia's strong feature set.
For this review we won't be including any DLSS 3 benchmarks though we plan to revisit it once Nvidia addresses the issues uncovered in our initial investigation. Another big issue with DLSS 3 benchmarks is reporting frame generation as an "FPS" metric, as 120 fps using DLSS 3 frame generation isn't really 120 fps – rather it's the smoothness of 120 fps with the input of roughly half that frame rate, plus a few graphical issues.

This is a serious concern for comparing benchmark results and we would suggest anyone benchmarking with frame generation enabled should report the numbers as "120 DLSS 3.0 fps," as an example.
For testing all GPUs were running at the official clock specifications with no factory overclocking. The CPU used is the Ryzen 7 5800X3D with 32GB of dual-rank, dual-channel DDR4-3200 CL14 memory on the MSI MPG X570S Carbon Max Wi-Fi motherboard. In total we tested 13 games at 1440p and 4K, so let's get into the data...
Benchmarks
First up we have Watch Dogs: Legion and at 1440p we are CPU limited with these higher end GPUs. Still the data is relevant for anyone with a 5800X3D or a CPU that's slower. But for unrestrained GPU performance let's move to 4K...

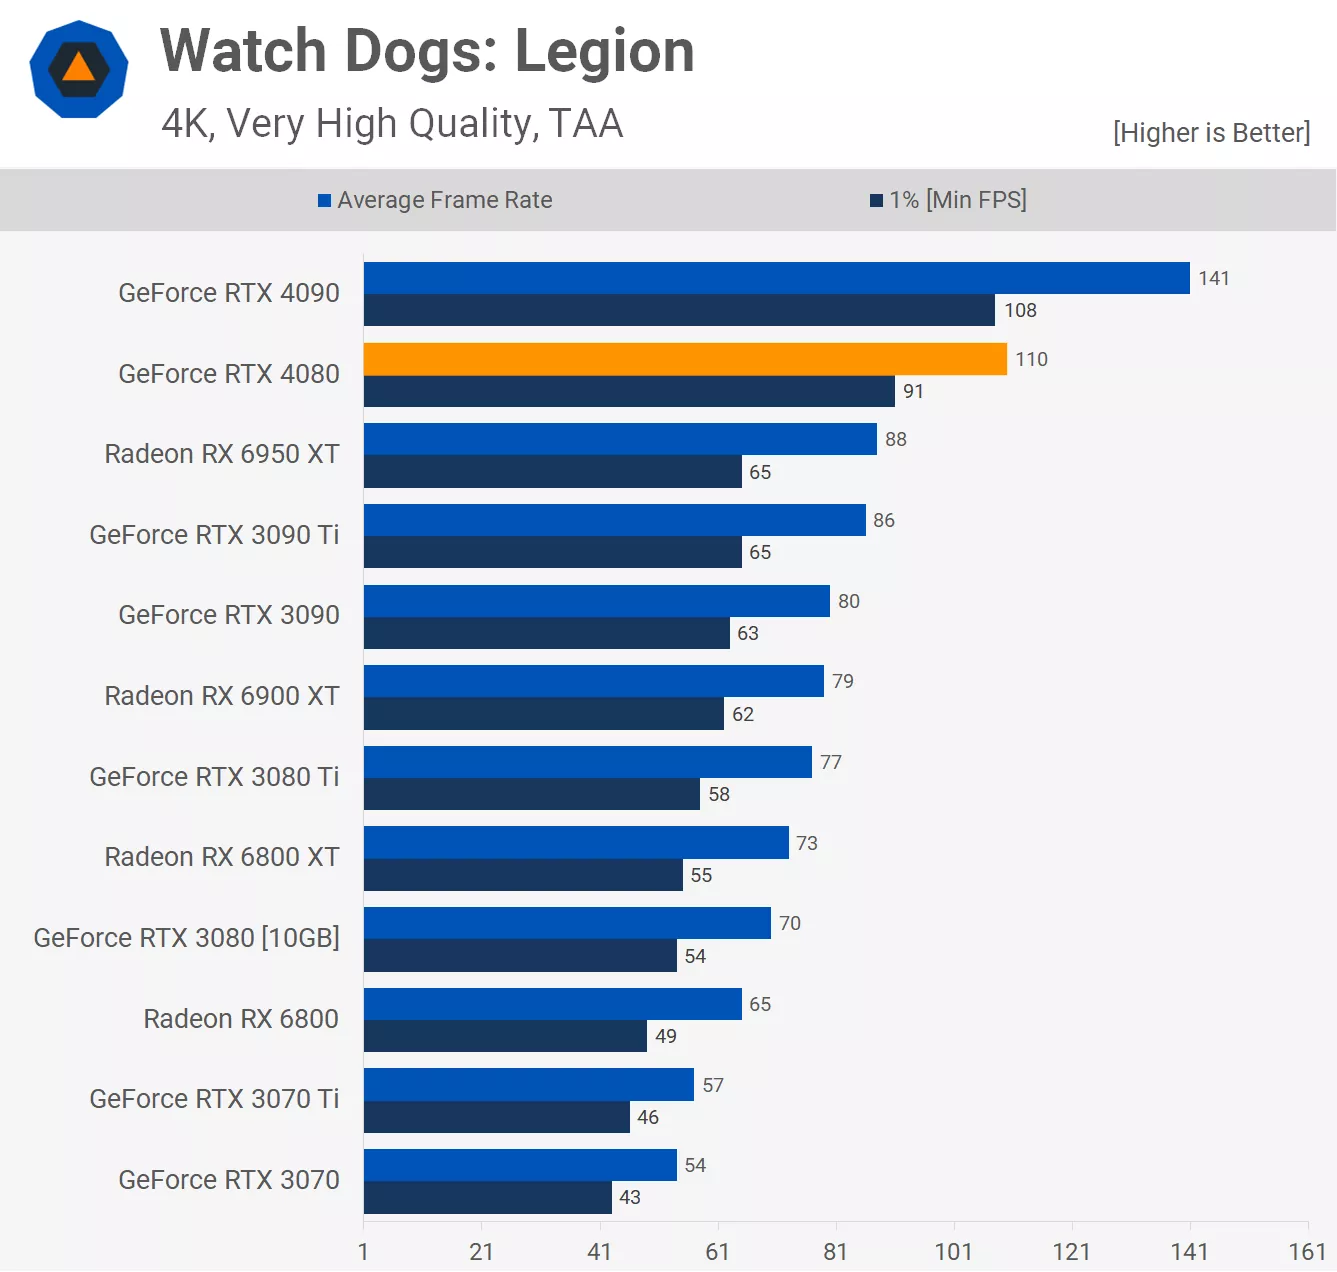
At 4K we get a much better idea of what the RTX 4080 is capable of. 110 fps on average meant it was 22% slower than the RTX 4090, but also 25% faster than the 6950 XT, 42% faster than the 3080 Ti and 57% faster than the 3080. That's some pretty impressive generational improvements.

Rainbow Six Extraction isn't as CPU limited at 1440p as what we saw with Watch Dogs: Legion and as a result the 4080 was 40% faster than the 6950 XT and 30% faster than the 3090 Ti. That said it was just 18% slower than the 4090, so let's see if that margin grows at 4K.

As expected it does as here the 4080 was 20% slower than the 4090, though it did still manage an impressive 158 fps at 4K. That made it 45% faster than the 3080 Ti, 56% faster than the 3080 and 61% faster than the 6950 XT.

For testing Far Cry 6 we use actual in-game performance instead of the built-in benchmark tool. Unsurprisingly, the data is CPU limited at 1440p and as a result the 4080 was just 3% slower than the 4090 with 181 fps on average.
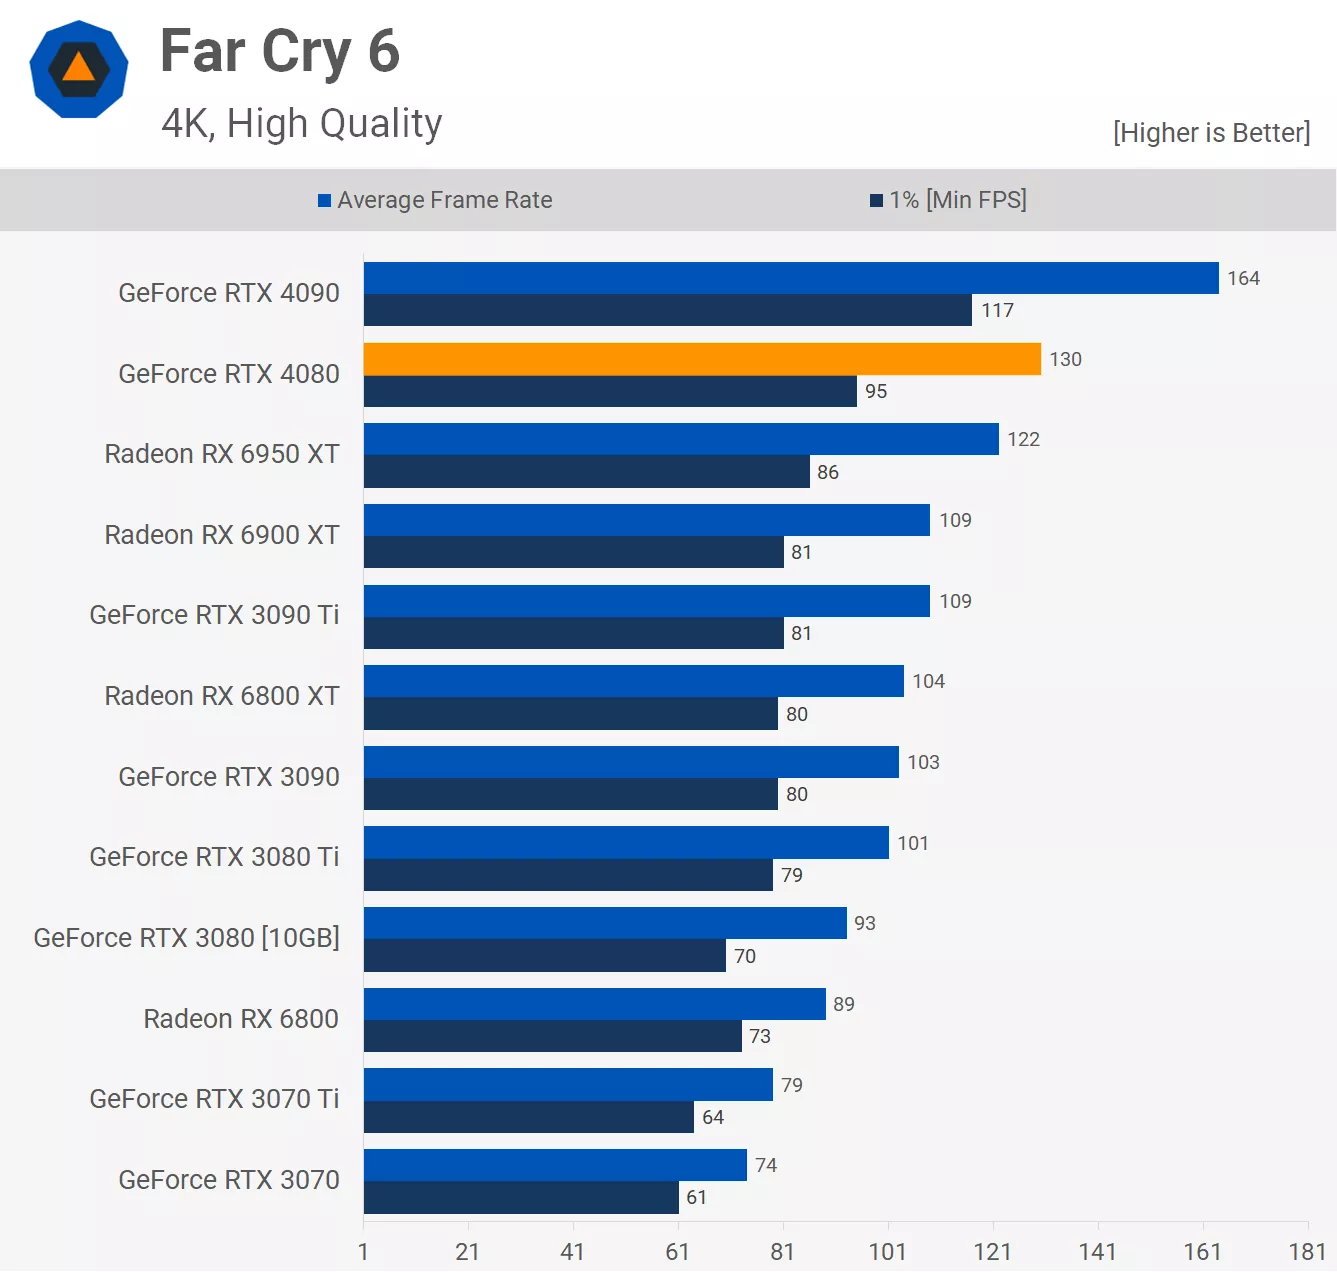
Moving to 4K shifts the primary performance limitation onto the GPU and now the 4080 is seen trailing the 4090 by a 21% margin with 130 fps on average. That also made it just 7% faster than the 6950 XT, but 29% faster than the 3080 Ti and 40% faster than the 3080.

Next we have Assassin's Creed Valhalla and at 1440p the RTX 4080 was good for 161 fps which saw it trail the 4090 by a 12% margin, while beating the 6950 XT by a 12% margin, but let's move to 4K to see how those margins change.

Even at 4K the RTX 4080 was just 14% slower than the 4090 and just 15% faster than the 6950 XT. The Radeon GPU is helped along by excellent support for Resizable BAR, so overall a disappointing result for the new GeForce GPU.

The GeForce RTX 4090 really impressed us in Hunt Showdown and while the 4080 isn't as impressive, it's still well ahead of previous generation parts, trailing the 4090 by a 22% margin but leading the 6950 XT by 34%, the 3080 Ti by 37% and the 3080 by a massive 58%.

Then we see that the 4K margins are much the same, here the 4080 was 24% slower than the 4090 with 121 fps on average, making it 29% faster than the 6950 XT and 44% faster than the 3080.

We're seeing a clear pattern emerge. This time testing with The Outer Worlds at 1440p saw the 4080 just 21% slower than the 4090, but 22% faster than the 3090 Ti, 27% faster than the 3080 Ti, 34% faster than the 6950 XT, and a massive 46% faster than the 3080.

The margins remained the same at 4K though there are some odd changes. We see that the RTX 4080 was good for 119 fps making it 25% slower than the 4090, but just 13% faster than the 3090 Ti despite still beating the 3080 Ti by a 28% margin, so the 3090 Ti does a little better than you might expect.

Hitman 3 is a very CPU intensive game and the 5800X3D isn't the fastest CPU here, not even close with the release of Zen 4 and Raptor Lake.

CPU limitations aren't an issue at 4K however and here we see that the 4080 is the expected 22% slower than the 4090 with 142 fps on average. This did make it 26% faster than the 6950 XT and 69% faster than the RTX 3080.

The 5800X3D does perform well in Horizon Zero Dawn and despite that we still run into a hard CPU bottleneck with the new GeForce 40 series GPU as both the 4080 and 4090 were limited to just over 210 fps.

Jumping up to 4K removes CPU performance limitations and delivers the expected margins. As we've seen time and time again, the 4080 is a little over 20% slower than the 4090 but faster than the rest of the pack.

Next we have F1 2021 and at 1440p the 4080 was 16% slower than the 4090 with 206 fps, and that meant it was 34% faster than the 3090 Ti and a massive 48% faster than the 6950 XT.
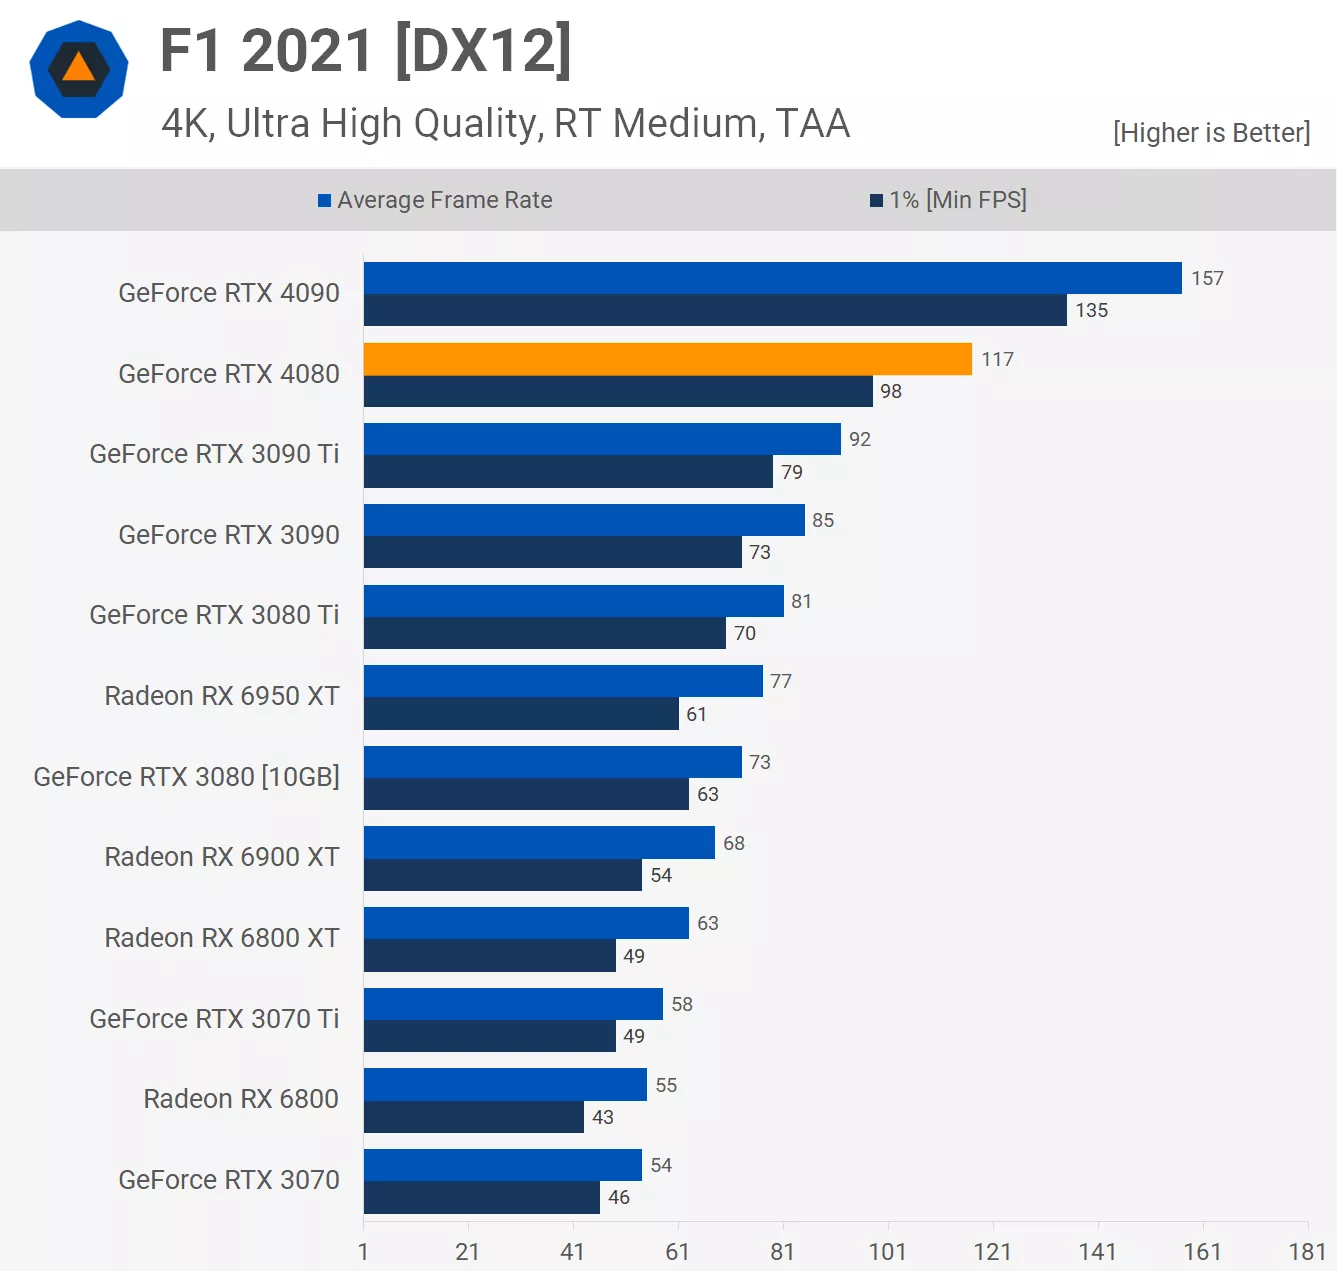
Then at 4K we see predictable margins as now the 4080 is 25% slower than the 4090, and 52% faster than the 6950 XT. It was just the 4090 that was running into system limitations at the lower 1440p resolution.
Then at 4K we see predictable margins as now the 4080 is 25% slower than the 4090, and 52% faster than the 6950 XT. So really it was just the 4090 that was running into system limitations at the lower 1440p resolution.

Moving on to Cyberpunk 2077 we find that the 4080 was good for 128 fps on average with the 5800X3D pairing, which made it 12% slower than the 4090, and just 17% faster than the 6950 XT.

Increasing the resolution to 4K results in fairly typical margins based on what we've seen so far, the 4080 is now 23% slower than the 4090, but 33% faster than the 3080 Ti and almost 50% faster than the original 3080.

Dying Light 2 Stay Human isn't very CPU demanding and as a result we're not limited at 1440p, allowing the RTX 4080 to churn out 151 fps on average, resulting in a typical 21% deficit to the 4090.

That margin did grow slightly to 25% at 4K and interestingly the 4080 was just 11% faster than the 6950 XT, due to an unusually strong result for the Radeon GPU.

In Halo Infinite we are clearly running into a CPU bottleneck at 1440p as the RTX 4080 was just 6% slower than the 4090, but impressively still 42% faster than the 3090 Ti and 51% faster than the 6950 XT.

At 4K the RTX 4080 is now only 32% faster than the 3090 Ti which is still a large margin, but smaller than the 42% margin seen at 1440p.

In Shadow of the Tomb Raider at 1440p, the RTX 4080 rendered an impressive 206 fps, and that meant it was 13% slower than the 4090, but 35% faster than the 6950 XT.

Bumping up the resolution to 4K saw an average of 116 fps, though this did make the 4080 28% slower than the 4090, so that's one of the bigger margins we've seen. It was also only 23% faster than the 3090 Ti and 33% faster than the 6950 XT.
13 Game Average
Looking at average frame rates at 1440p, the RTX 4080 produced 189 fps, making it 12% slower than the RTX 4090 at 1440p. It was also 24% faster than the Radeon 6950 XT, and 25% faster than the RTX 3090 Ti, while we're looking at a 38% boost over the 3080 Ti and 51% over the RTX 3080.

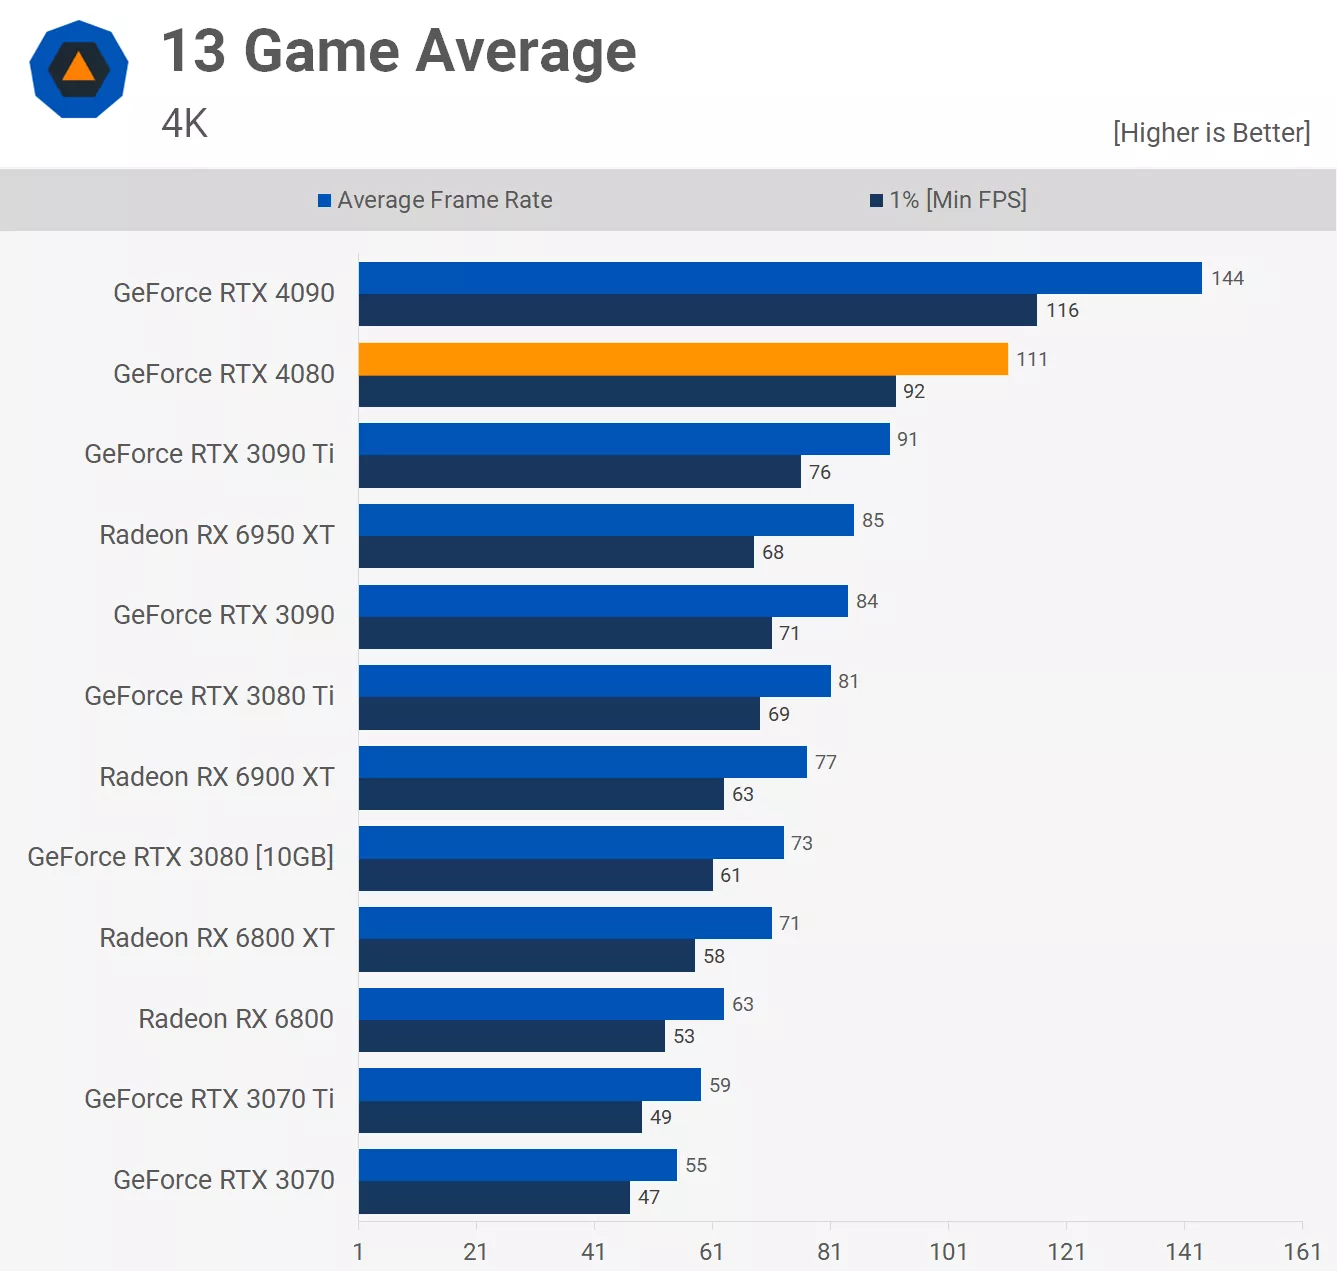
At 4K where the CPU bottleneck is removed, the RTX 4080 was on average 23% slower than the RTX 4090, making the flagship Ada Lovelace GPU 30% faster.
The RTX 4080 was also 22% faster than the 3090 Ti, 31% faster than the Radeon 6950 XT, 37% faster than the 3080 Ti and 52% faster than the 3080.

Just because we know many of you will want to see the 1080p data, here's the 13 game average at the lower resolution. Of course, we were almost always heavily CPU limited in this testing, which is why the RTX 4080 is just 16% faster than the 3090 Ti and only 7% slower than the 4090.
Ray Tracing + DLSS Performance
Time for a look at ray tracing and upscaling performance, starting with F1 22. At 1440p the 4080 and 4090 are limited to around 300 fps with the RT effects disabled. Enabling RT + DLSS resulted in roughly the same level of performance with 181 fps for the 4080 and 189 fps for the 4090, this made the RTX 4080 just 12% faster than the 3090 Ti.
Then with upscaling disabled, the RTX 4080 was 32% slower than the RTX 4090 and 22% faster than the 3090 Ti, while it crushed the 6950 XT by a massive 83% margin.
Moving to 4K helps to remove the CPU bottleneck and then the 4080 is 27% slower than the 4090 before RT effects are even enabled. The margin actually grew to 36% with RT + DLSS enabled and then 38% with just RT enabled with no upscaling. When compared to the 3090 Ti the 4080 was 19% faster and then 100% faster than the 6950 XT, yikes.
Next up we have Watch Dogs: Legion and here the 4080 and 4090 delivered similar performance under all three test conditions. The 3090 Ti was also able to match the 4080 with DLSS enabled as this appears to be the limit of what the 5800X3D can render with RT enabled.
Moving to 4K gives us a better picture of where the RTX 4080 stands and here it is 27% slower than the 4090 with RT + DLSS enabled, and 26% faster than the 3090 Ti. It was also a massive 115% faster than the 6950 XT which was using FSR.
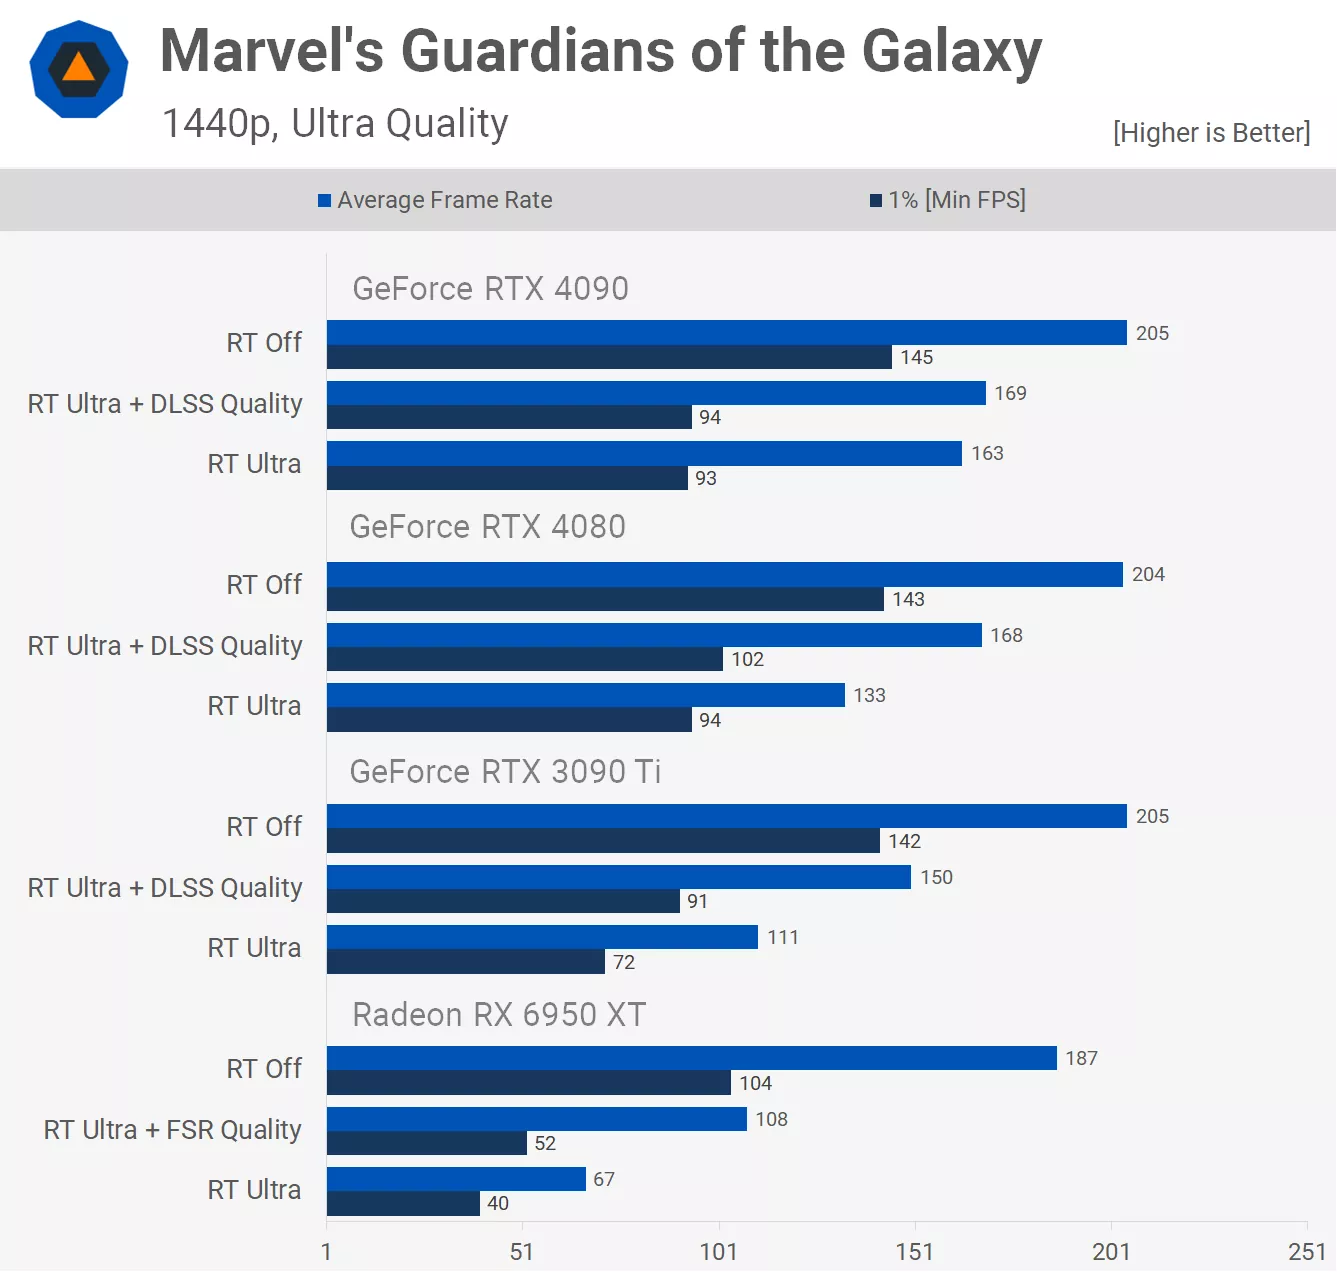
Marvel's Guardians of the Galaxy is also quite CPU limited at 1440p, of course the performance overall is stellar with frame rates up around 200 fps without RT enabled, but it also doesn't show us how the 4080 truly stacks up, so let's move to 4K.

At the 4K resolution, the 4080 is 22% slower than the 4090 with RT + DLSS enabled, and 21% faster than the 3090 Ti. It was also a massive 81% faster than the 6950 XT which was again using FSR.

Dying Light 2 shows that at 1440p the RTX 4080 was 26% slower than the 4090 when comparing the RT + DLSS results. This also made it 47% faster than the 3090 Ti, which is a huge margin and we saw previously that the GeForce 40 series does very well in this title.

It's a similar story at 4K, where the 4080 was 31% slower than the 4090, but 46% faster than the 3090 Ti and a massive 100% faster than the Radeon 6950 XT which was again using FSR.

The last ray tracing/DLSS benchmark that we have for you looks at Cyberpunk 2077. Here the RTX 4080 rendered 102 fps at 1440p which RT + DLSS enabled, making it just 10% slower than the 4090 and 23% faster than the 3090 Ti.
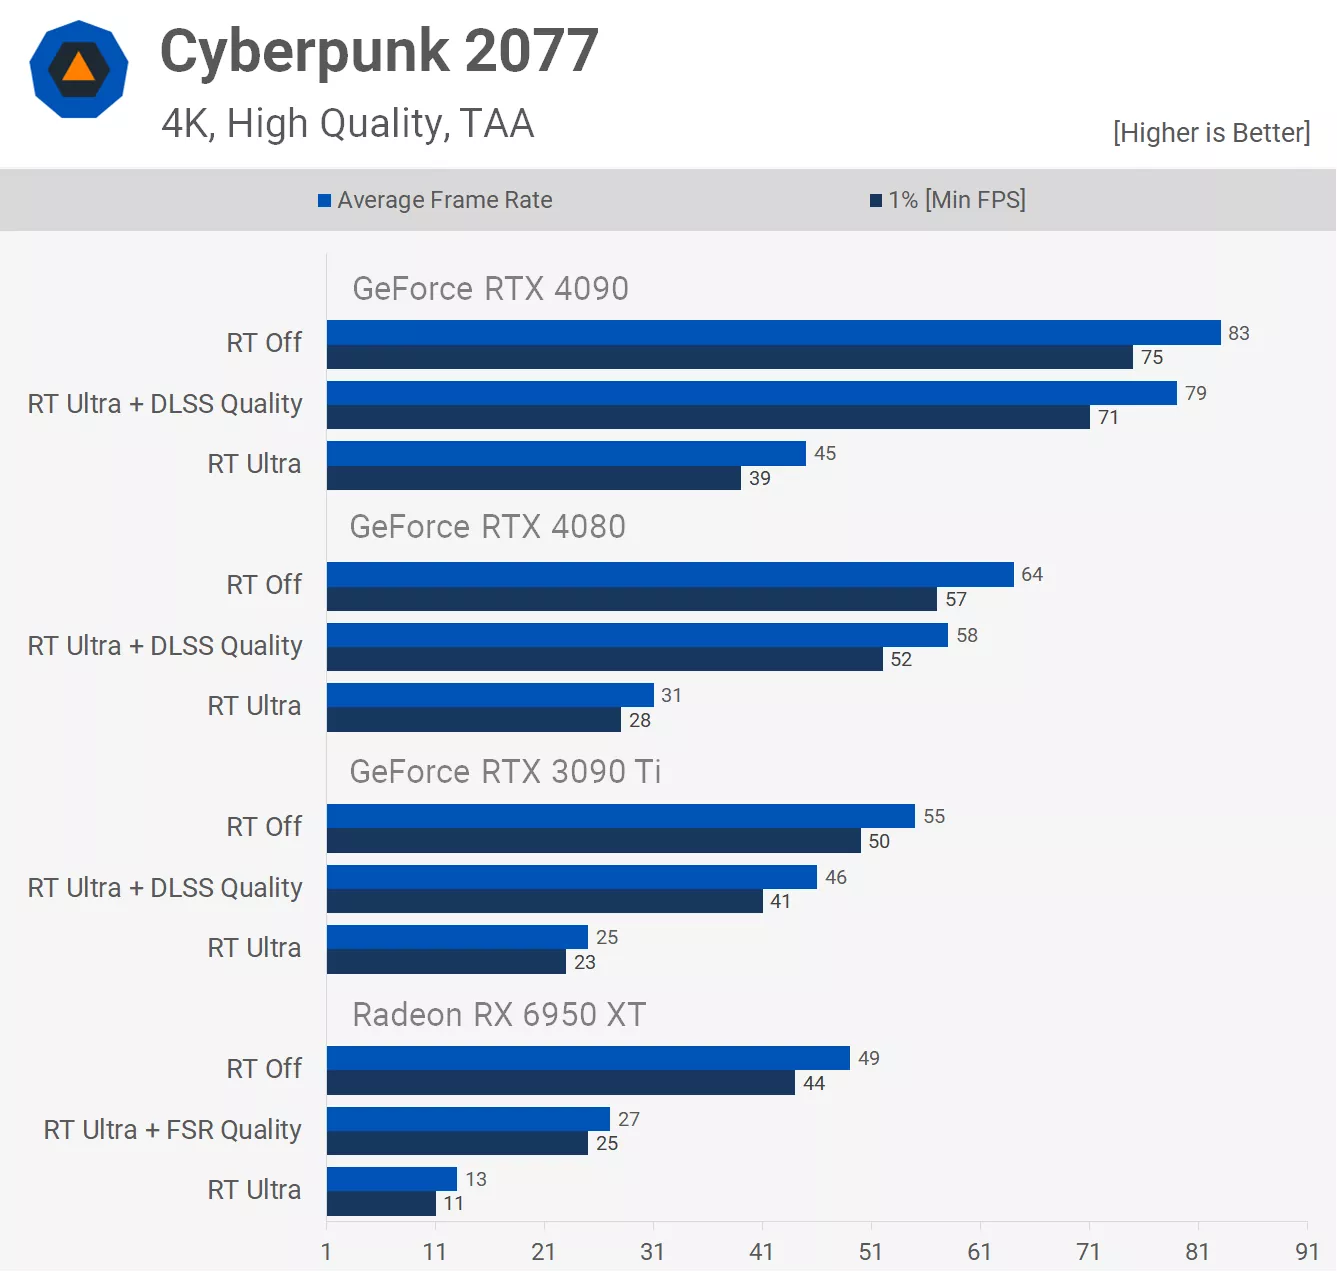
At 4K those margins change and now the 4080 is 27% slower than the 4090 when both are running RT effects with upscaling enabled. This also saw the 4080 defeat the 3090 Ti by a 26% margin and the 6950 XT by an incredible 115% margin.
Power Consumption
The GeForce RTX 4080 is remarkably good in terms of power consumption as we see in Dying Light 2, pushing usage to just 404 watts, which is similar to that of the RTX 3070 Ti and Radeon 6800 XT, which is very manageable. It's also a 23% reduction in total system usage when compared to the 4090.


Power usage did creep up a little in Doom, hitting 471 watts and thus the RTX 4080 finds itself situated between the 3080 and 3090, but it's a reduction in total system usage by 22% when compared to the RTX 4090 flagship.

Finally in Hitman 3, we find more of the same, power usage is still lower than the 3090 and is really comparable to the 3080. Given the performance just seen, we'd say the RTX 4080 is very efficient, but let's lock the frame rate for an interesting look at power efficiency...

With all four GPUs locked to 90 fps, we get to see just how power efficient the RTX 4080 is.
The RTX 4090 really impressed in this test before and we see that the smaller AD103 die is even more efficient again, dropping power usage by ~6%. This means that under the same operating conditions, the RTX 4080 uses half as much power as the RTX 3090 Ti – super impressive stuff.
Cost per Frame
For our cost per frame analysis we'll start with MSRP pricing, just to get a feeling for where pricing over the life of each product should have been. Starting with the cost per frame based on the 1440p data, we see that the RTX 4080 slots in between the 3070 Ti and 6900 XT, neither of which were particularly great value in their respective series.
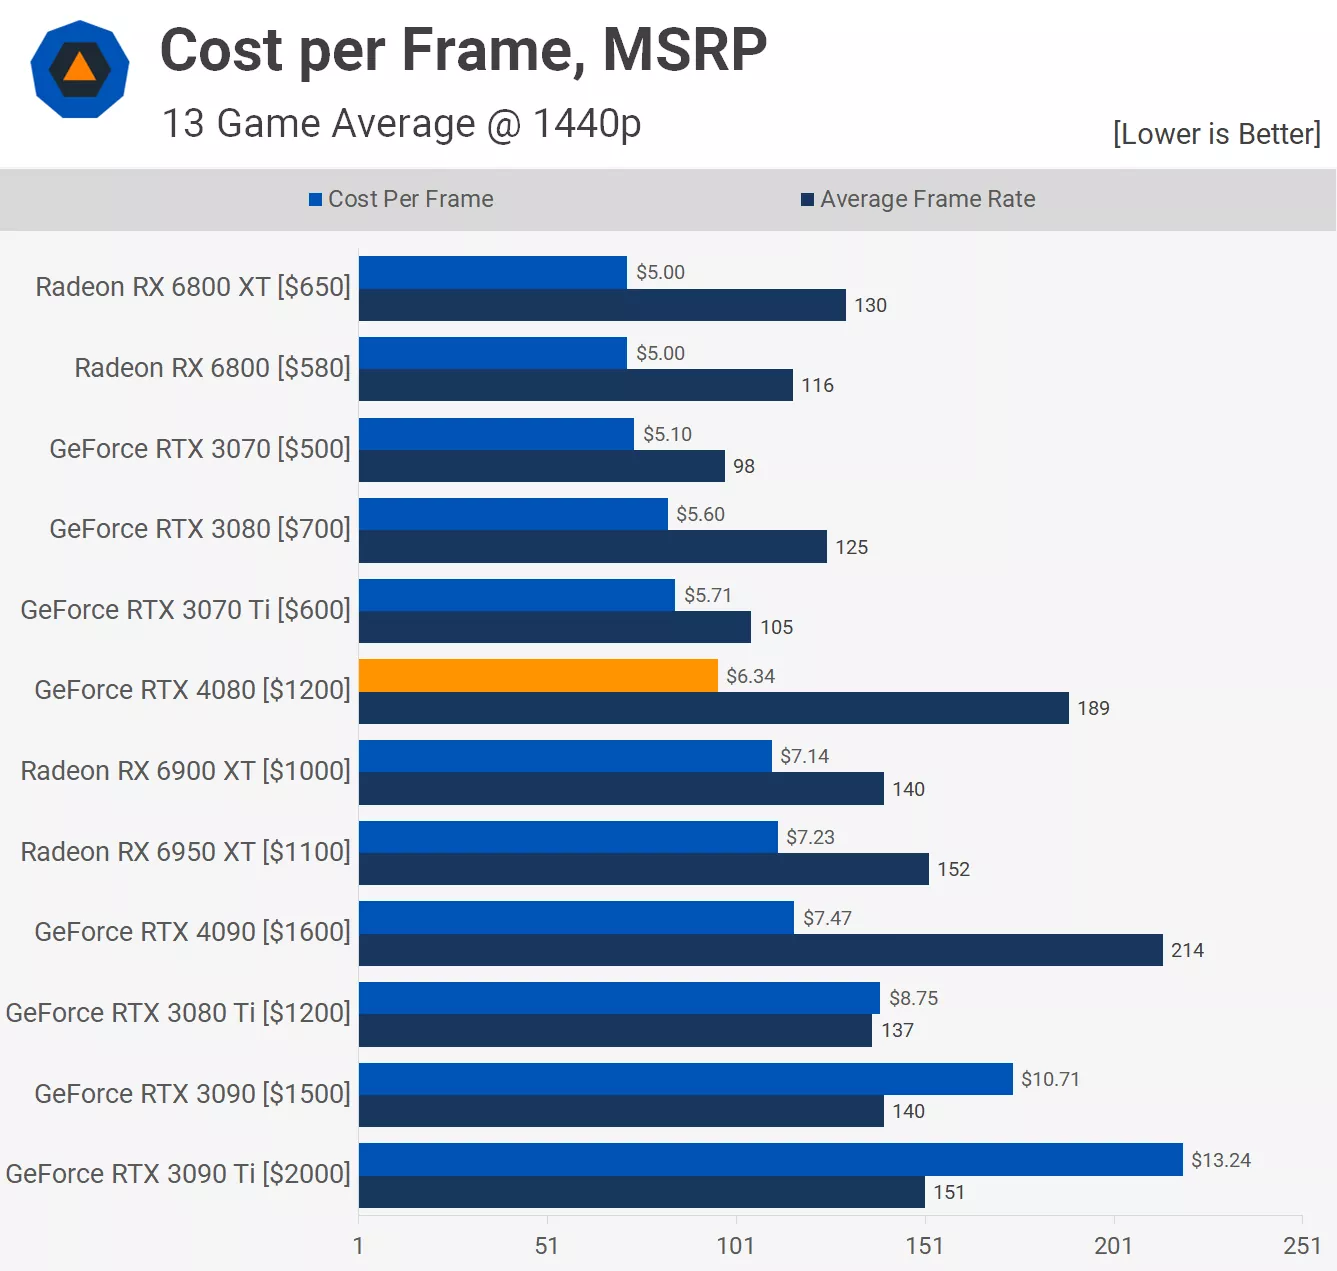
When compared to the RTX 3080, price to performance has regressed by 13%, and 27% when compared to the Radeon RX 6800 XT. Still, Nvidia would be quick to point out that when compared to the 3080 Ti, the RTX 4080 is a substantial improvement in value, reducing the cost per frame by 28%.

The 4K MSRP data is a little more favorable, but even so the RTX 4080 is still 13% more costly per frame than the RTX 3080, so in that sense even based on MSRP pricing, it's not great value. But when compared to the RTX 4090 it is a slight improvement, though we suspect many who are entertaining the idea of spending $1,200 on a graphics card would probably just opt to go the full hog with the 4090.

The bigger issue with the RTX 4080 when discussing value is the current GPU market and in this graph using the 1440p data it slips to one of the weakest options you can purchase right now, only roughly matching the terrible value RTX 3080 Ti. But given how CPU limited much of the 1440p results were, let's make our final value analysis based on the 4K data.

The cost per frame results based on the 4K data using current retail pricing. Here the RTX 4080 is slightly better value than the 4090, reducing the cost per frame by just 3%.
Value-wise the RTX 4080 is also comparable to the 3080 Ti at its current asking price of $860, which frankly isn't great given that makes it 11% more costly per frame than the 3080, which is worse value than AMD's 6900 XT and worlds worse value than the 6800 XT.
Of course, none of those GPUs are even remotely in the same league as the RTX 4080 when it comes to performance, so it will be interesting to see what RDNA 3 can do here.
More RTX 4080 AIB Models
Before we're done today, let's take a look at the three partner models we have on hand before checking out the operating behavior of each of them and Nvidia's FE version.
Starting with MSI's RTX 4080 Suprim X, this one is pretty simple if you've seen our RTX 4090 Suprim X review as it's the exact same cooler. The 4080 version weighs just 60 grams less and like the FE model, that difference can be attributed to the smaller GPU, fewer memory chips, cut-down power delivery and fewer components on the PCB in general. Still at 2360 grams this thing is still heavy and massive.


Given the RTX 3090 Ti version of the Suprim X is smaller, the size and weight of the RTX 4080 is unnecessary, but it seems as though it was just easier for Nvidia's partners to mass produce these monstrosities and stick them on all current generation high-end graphics cards.
Regardless of how you feel about these comically large graphics cards, it appears they're here to stay. The Suprim X is an excellent quality board, it looks great, and as we're about to see it works very well.


The Asus RTX 4080 TUF Gaming is a carbon copy of the RTX 4090 model. This thing is wrapped in metal, with very few plastic elements to speak of. However, while it appears to be the same cooler, there are some noteworthy changes which will reduce manufacturing costs.
Whereas the 4090 TUF Gaming tipped the scales at 2320 grams, the 4080 version is 17% lighter at 1920 grams. The bulk of that difference can be attributed to the cooler which is 308 grams lighter at a total weight of just 772 grams.
Whereas the RTX 4090 version made use of 8 nickel-plated copper heatpipes to contact the large vapor chamber, the 4080 does away with the vapor chamber entirely and although there's still eight heatpipes, just two of them measure 8mm in diameter with the rest of the 6mm variety. The 4090 packed five 8mm heatpipes and this allowed for a significantly larger contact with the base plate.
Speaking of the base plate, the RTX 4080 version only makes contact with the GPU while an aluminum spreader contacts the memory chips, with the aid of thermal pads of course. Then over on the PCB there are fewer power deliver components, the much smaller GPU and just eight memory chips opposed to the dozen you'll find on the 4090.

Then we have the PNY RTX 4080 which wins the award for the worst name, are you ready for this? It's the PNY RTX 4080 XLR8 Gaming Verto Epic-X, so let's just call it the Verto.
This is a fairly standard looking RTX 4080, it measures 71mm wide, so it will take up 4 slots, it's 332mm long and stands 136mm tall from the PCI connector. All up it weighs 1860 grams making it just 3% lighter than the RTX 4090 version.
There are some real design changes between the 4080 and 4090 version, despite them looking very similar overall. The RTX 4090 has a reinforcing structural bracket that runs the entire parameter of the card, whereas the 4080 does away with the bracket for a modified heatsink design.
The only issue we have with this model is the lack of a dual-BIOS feature which for many can be a bit of a deal breaker, especially at this price point. So with that let's take a look at thermals, operating clocks, and power.
Cooling
Here's a look at how the Nvidia Founders Edition operates after an hour of Hitman 3 at the 4K resolution using max settings. These temperatures were recorded in a 21c room installed inside an ATX case with the doors closed. The GPU hotspot peaked at 78c while the memory reached 74c, and we saw an average core clock frequency of 2760 MHz, a power draw of 300 watts and a fan speed of 1450 RPM. Decent results but nothing amazing.


The MSI Suprim X results were remarkably similar with the hotspot temperature also hitting 78c though the memory was slightly cooler at 72c. We're also looking at a similar operating frequency at 2745 MHz with power draw at 308 watts. The fans were spinning slower at 1200 RPM, but overall a very similar result to Nvidia's FE model.
The Asus TUF Gaming model spun its fans a bit faster at 1550 RPM which limited the peak hotspot temperature to 77c and the memory to 72c, so the same result as the Suprim X and FE models. The average power draw was higher at 314 watts and this allowed for a slightly higher sustained 2775 MHz operating frequency.


Finally, the PNY Verto, and you guessed it, basically the same results again. Here we have a hotspot temperature of 78c though the memory was considerably cooler at 62c, so that's an impressive result. The average power draw was also fairly standard at 312 watts and we have a typical 2730 MHz core clock frequency. All this at a 1300 RPM fan speed, so the differentiating factors here are the card's appearance and pricing.
What We Learned
The new GeForce RTX 4080 is clearly an impressive product, delivering on average 111 fps at 4K across the 13 games tested. That's a 20 to 30% increase over previous generation flagships.
That's all great except that it's also 'adequately' priced above previous generation flagships. It's currently 20% more expensive than the Radeon 6900 XT and just 25% less than the massively overpriced RTX 3090.

While we absolutely love the performance and features of the RTX 4080, it's hard to get too excited when we know you will have to stomach the $1,200 asking price for the privilege.
AMD is expected to counter-punch next month and we can anticipate that the awkwardly named Radeon RX 7900 XTX will arrive next month at $1,000. This GPU should comfortably beat the RTX 4080 in terms of rasterization performance – but there's still the issue of ray tracing, which continues to gain ground and is an important performance metric now. Also, while AMD's FSR continues to improve, so does DLSS, which remains the superior upscaling technology.

If only Nvidia would have increased the 80 series MSRP by around 30% – we know, "only" – would have seen the GeForce RTX 4080 coming in at $900, or $200 more than the RTX 3080 at launch. In that hypothetical scenario, the 4080 would have been excellent value in today's market, and would become the best value GeForce GPU on the market, matching the cost per frame of the $510 Radeon 6800. Sadly though, that's not to be, because Nvidia knows gamers will pay $1,200, and the performance boost appears to takes them there.

If you want top performance, we now know exactly how the GeForce RTX 4080 performs and while you're there, the RTX 4090 might be a better choice for many since it's the faster (and more expensive) GPU option. But if you're looking for best value, it's difficult to draw any conclusions until we've seen what the 7900 XTX has to offer and see what gets you the most bang for your buck. It's not a long wait either.
Shopping Shortcuts:
- Nvidia GeForce RTX 4080 on Amazon
- Nvidia GeForce RTX 4090 on Amazon
- AMD Ryzen 7 5800X3D on Amazon
- AMD Ryzen 7 7700X on Amazon
- Intel Core i5-13600K on Amazon
- Intel Core i7-13700K on Amazon
- AMD Ryzen 9 7950X on Amazon
Further Testing
Since we published this day-one review of the GeForce RTX 4080, we have run additional benchmarks and comparisons you may be interested in: